UrbanFootprint Analyst
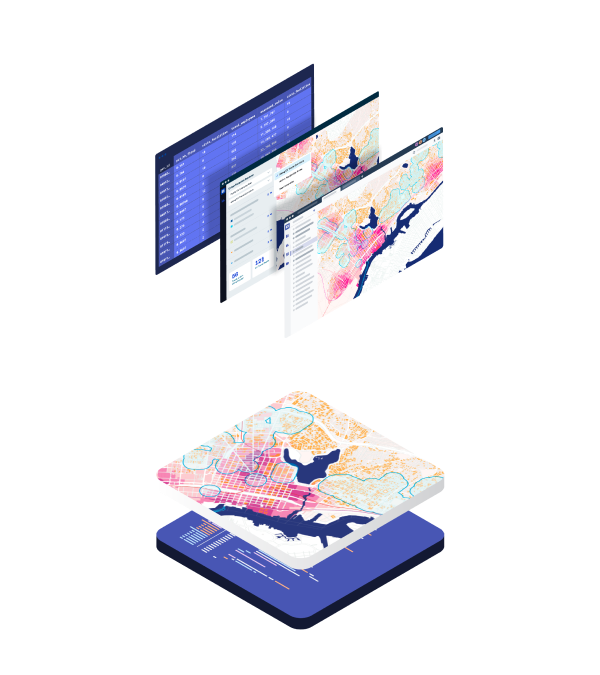
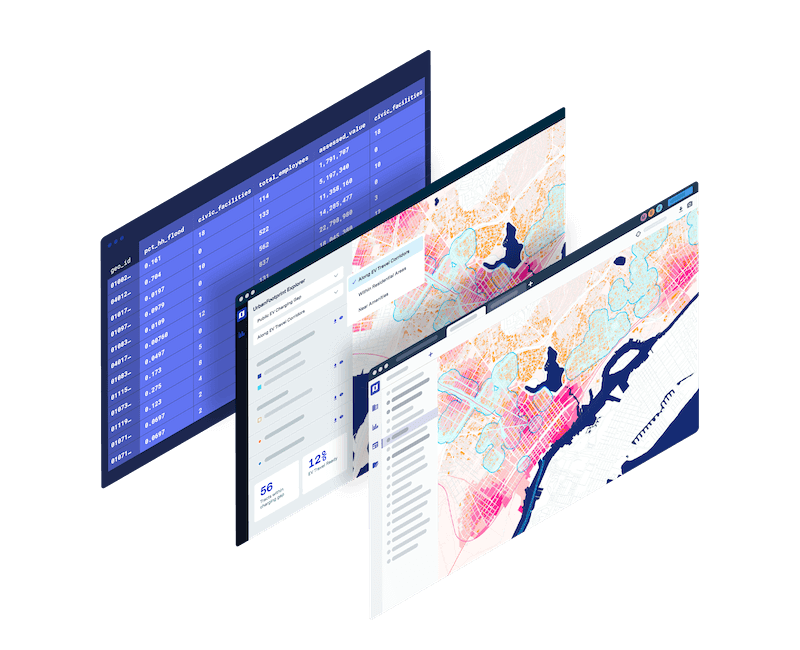
Thousands of ready-to-use datasets let you spend less time searching for data and more time focused on planning.
Access an unparalleled national parcel database with land use categories and key stats for more than 110 million parcels across the U.S., plus zoning and local land use codes.
Map roads, rail, and transit accessibility with hundreds of nationwide transportation datasets, including public transit routes and stops for nearly every city in the U.S.
Get the data you need for your next existing conditions assessment or environmental impact report. Browse hundreds of curated environmental datasets, from wetlands and park areas to habitat and carbon sequestration data.
Quickly and easily map relevant U.S. census data for your next project or proposal.
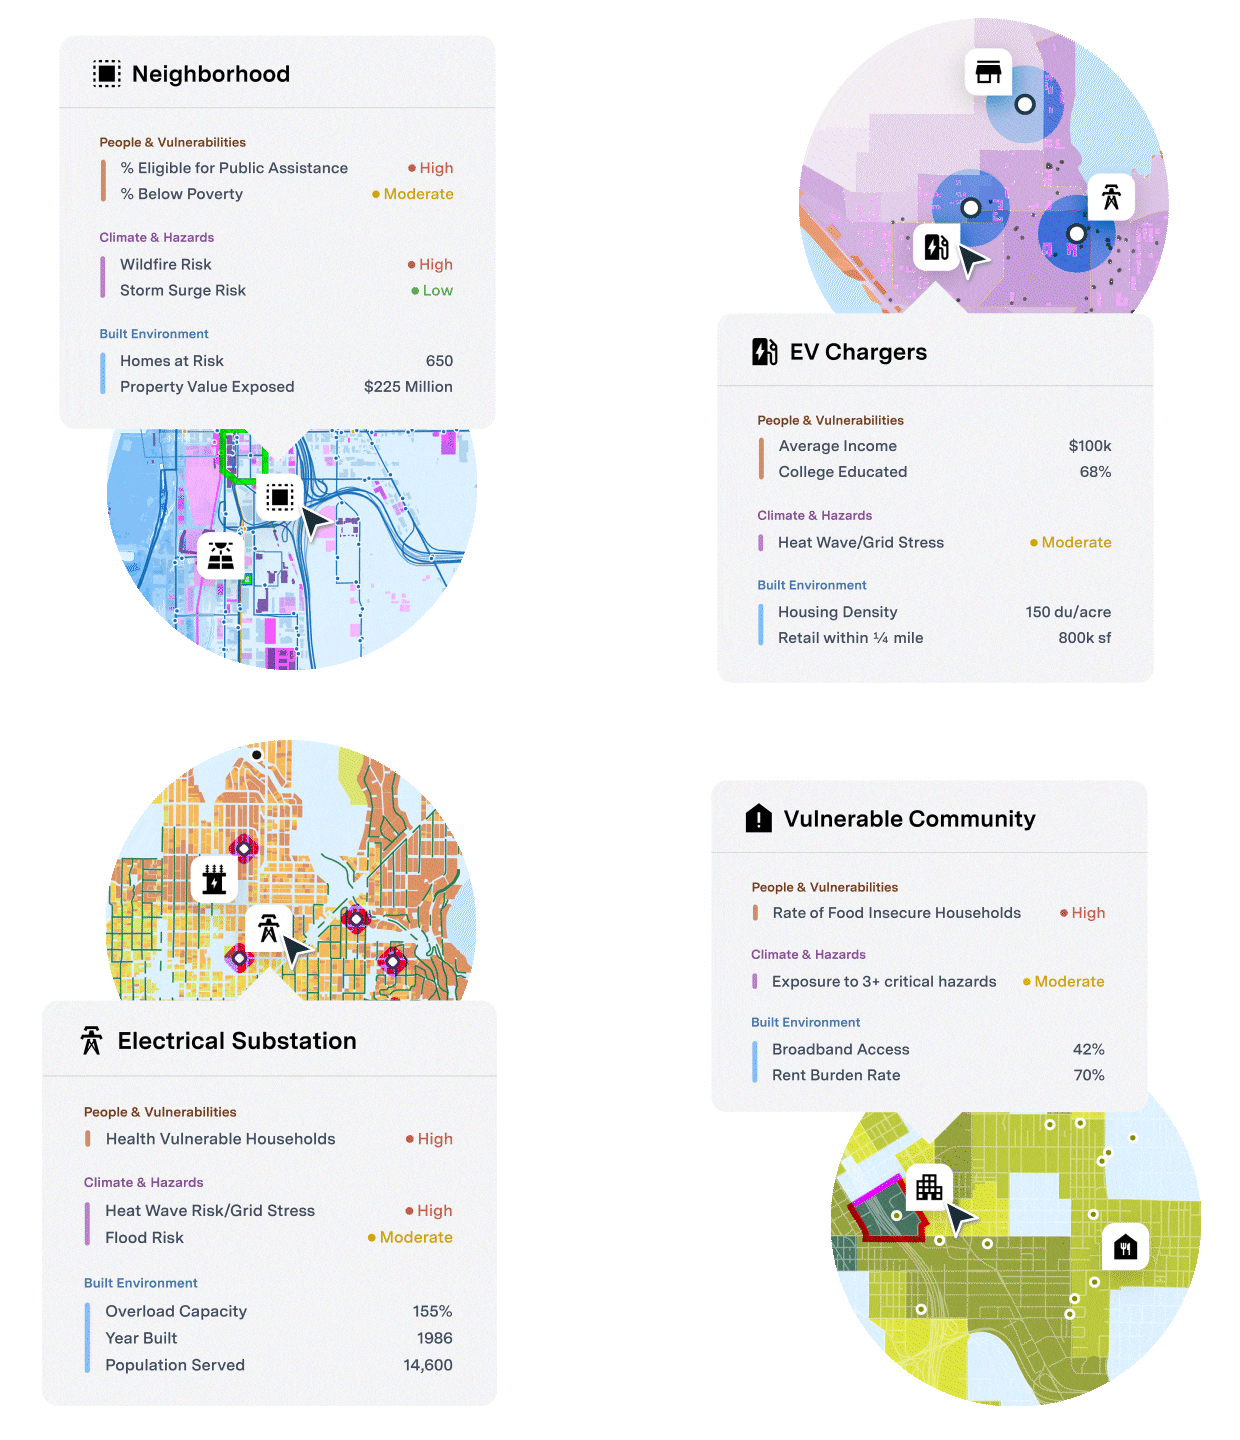
Map and measure hazard and climate impacts with up-to-date sea rise, flood risk, and fire hazard data from a host of federal, state, and local sources.
Visualize habitat areas, soils, water resource areas, agricultural data, and more.
Locate schools and other key institutions with updated and curated national datasets.
Access federal and local data on environmental justice, opportunity zones, fair market rents, and more.
Easily access public health data, including nationwide hospital locations, CalEnviroScreen, and more.
Survey and map the infrastructure in your community, including roads and rail, water districts, major power lines, energy use rates, and more.
Browse congressional districts, census tracts, jurisdiction boundaries, and more.
Easy Data Visualization
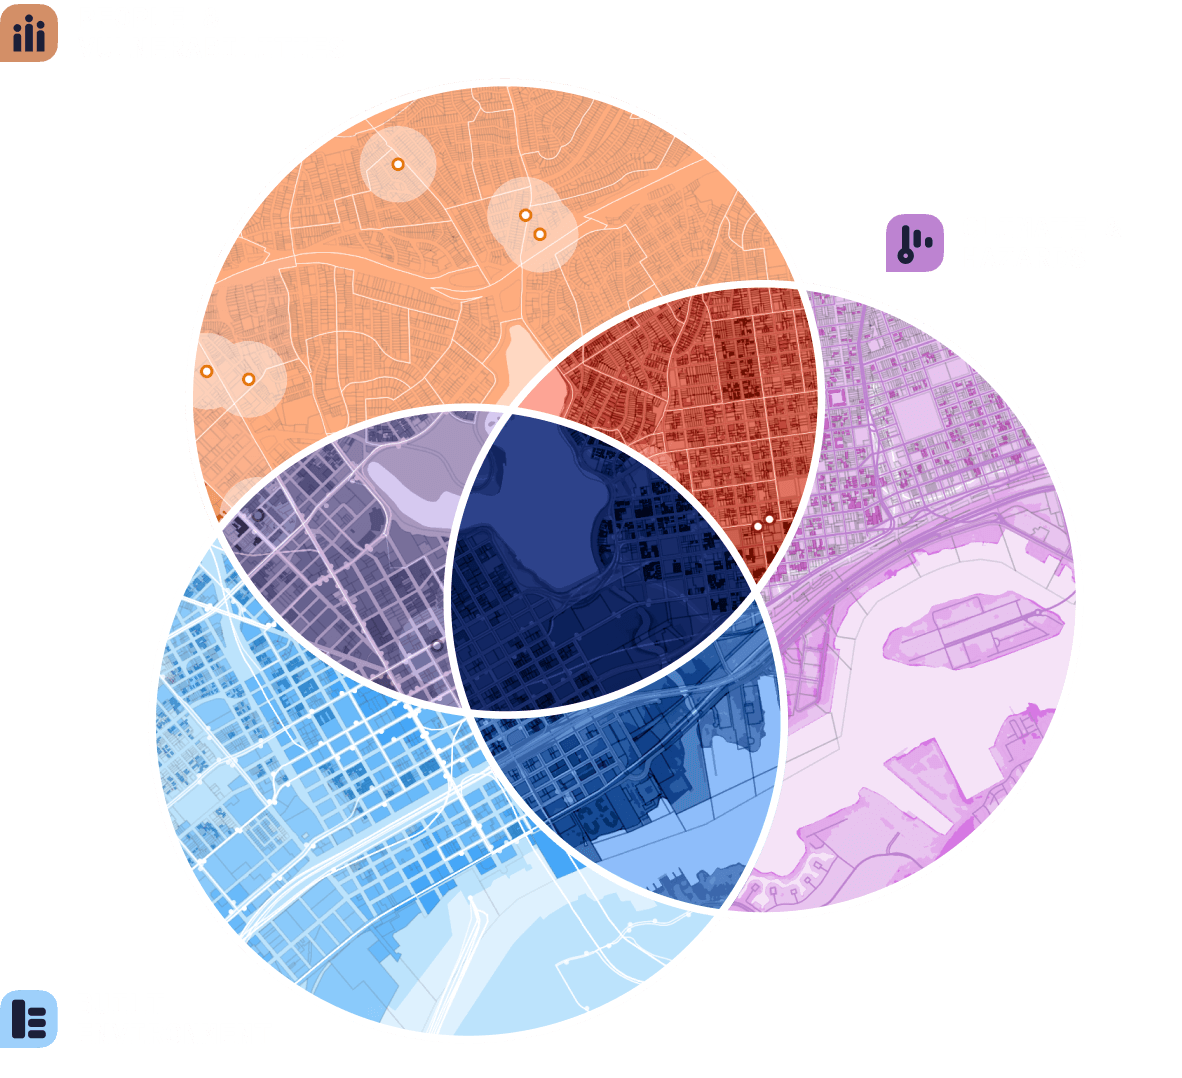
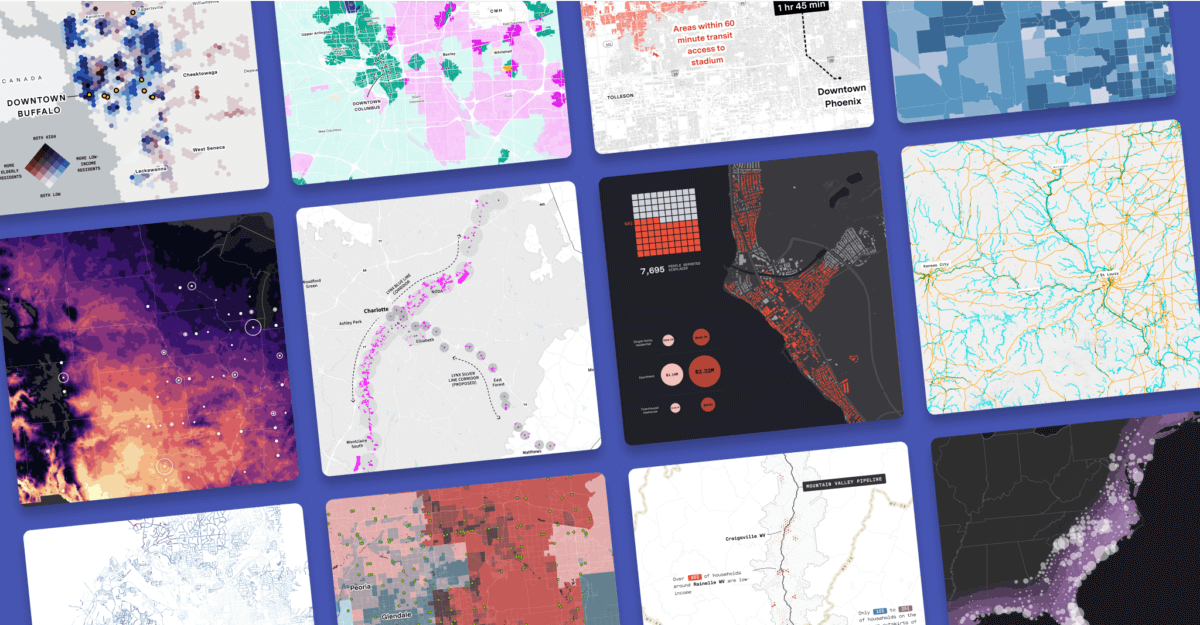
Craft beautiful maps using UrbanFootprint Analyst’s robust data catalog. Need to visualize the impacts of sea level rise in Charleston, South Carolina? Simply load the Base Canvas parcel map, and add Federal Sea Level Rise data from the in-app library. Quickly customize the map symbology to highlight your findings.
Quick Data Analysis
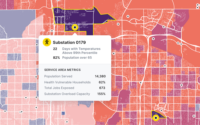
Map existing conditions in record time. Get quick answers to complex questions with easy-to-use data filter and query features. Looking to identify vacant parcels within a half-mile radius of high-quality transit stops in Lexington, Kentucky? With a few clicks of a button, Analyst delivers the data you need to map opportunities for infill housing.
Where does the data come from?
The Data Library in UrbanFootprint Analyst is supported by a variety of commercial and public data sources.
Can I add my own data to the UrbanFootprint library?
Yes! Users may upload their own datasets as shapefiles for use in their Analyst projects.
What data is included in the Base Canvas?
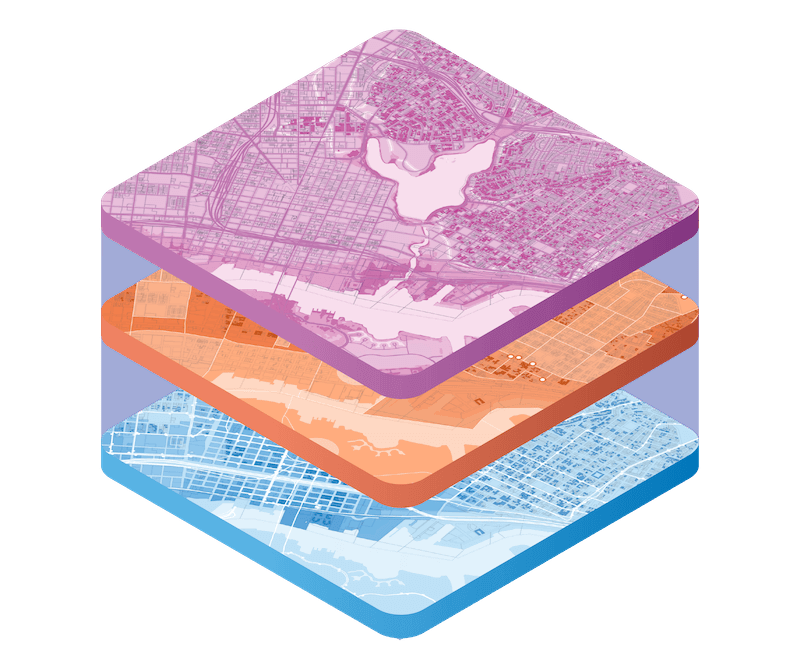
The Base Canvas in Analyst includes parcel-level coverage for nearly all U.S. locations. The Base Canvas is comprised of both commercial and public data sources combined by proprietary algorithms and processes. Each parcel includes over 70 attributes including population, residential mix, employment mix, parcel area, building area, land use type, intersection density, irrigated area, and more.
Do you have zoning or land use data for my city?
UrbanFootprint includes parcel-level, local land use and zoning data for most U.S. cities. Book a demo with our team to see UrbanFootprint in action.
How often is the data updated?
Major data updates are scheduled every quarter. We also make targeted updates on a weekly basis.
Ready to learn more? Contact our team today to discover how to get quick locations insights with UrbanFootprint.
Already a customer? Log in
UrbanFootprint is cloud-based software, ready to go with just a computer and internet connection.
One license covers everyone at your firm, jurisdiction, or organization.
New platform features roll out to all users every season at no added cost.
We’re invested in your success. Our customer support team is here to help.