


As electric vehicles (EVs) roll onto the roads in large volumes across the U.S, there has been a corresponding demand for more robust charging infrastructure. Despite the appealing environmental and economic benefits of EVs, the convenience of charging stations heavily influences adoption. And there begins the problem. While electric vehicle use is growing rapidly in well-to-do, predominantly White communities, minority neighborhoods have largely been left behind to date.
The U.S. government has emphasized the importance of equity when planning infrastructure investments in bills like the Build Back Better plan, and has incentivized a large portion of EV infrastructure funding in programs like NEVI and policies that seek to ensure EV charging infrastructure is deployed equitably.
But how well are these policies performing?
Taking a granular approach to assess the current state of EV infrastructure
In an effort to understand the current state of equity in charger deployment, identify gaps that may exist, and add to the body of knowledge surrounding EV infrastructure deployment – we decided to leverage our vast data core, analytical expertise, and powerful software platform to conduct an analysis of Public EV Level 2 chargers in Columbus, Ohio.
In the sections below, we explore where access to EV chargers is most prevalent based on variables like population density, various socio-demographic statistics, and with different definitions of what constitutes a charging gap.
EV Charging Infrastructure Basics
For EVs to achieve broad adoption and utilization, drivers need easy access to charging infrastructure. While many EV owners charge at home, people with longer commutes or irregular driving habits are unlikely to see themselves in EV ownership without excellent access to public charging stations.
There are three levels of charging equipment, determined by charging speed.
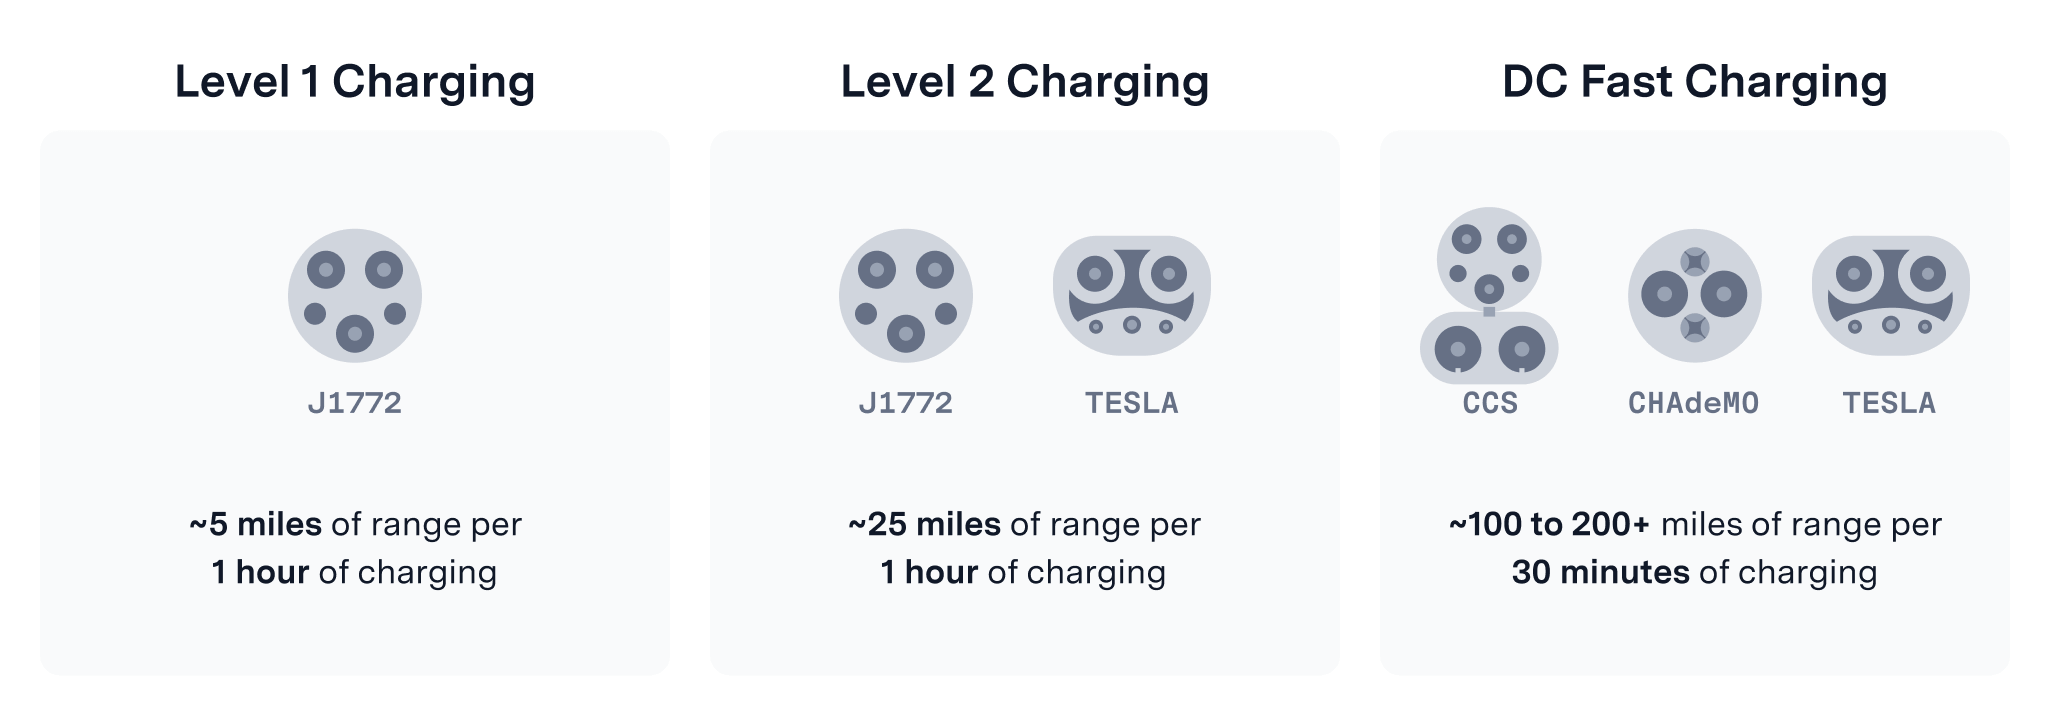
- Level 1 (L1) – less than 2% of public EV chargers in the U.S. are L1.
- Level 2 (L2) – the most common type of public EV chargers, accounting for more than 80% of public EV chargers in the U.S.
- Level 3 (L3) – more than 15% of public EV chargers in the U.S. are L3.
Due to the overwhelming preference for and majority of public charging stations being Level 2, we focused our analysis on L2 chargers.
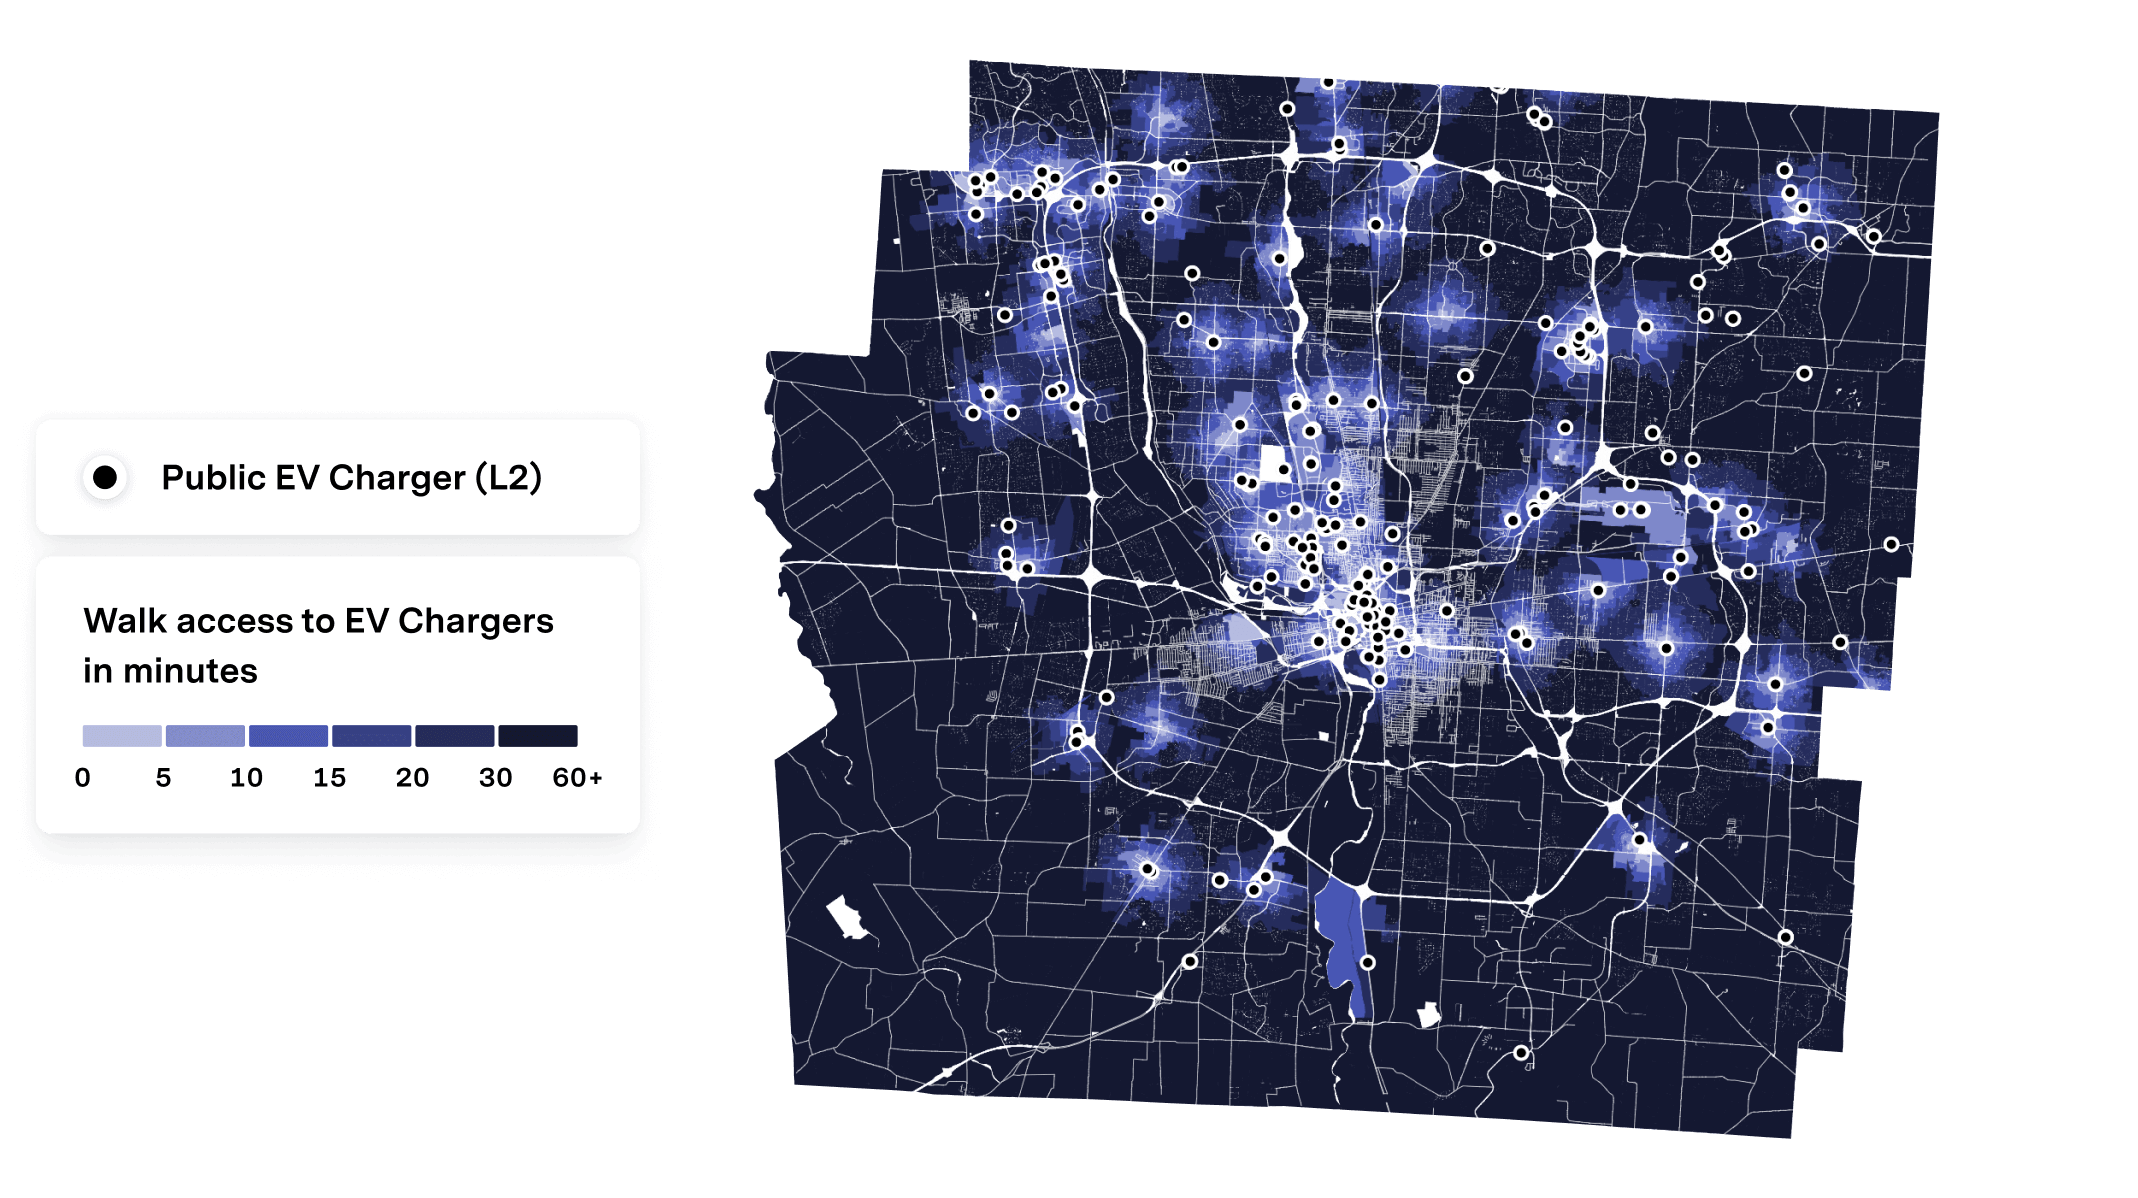
The Landscape of EV Charging Infrastructure in Columbus
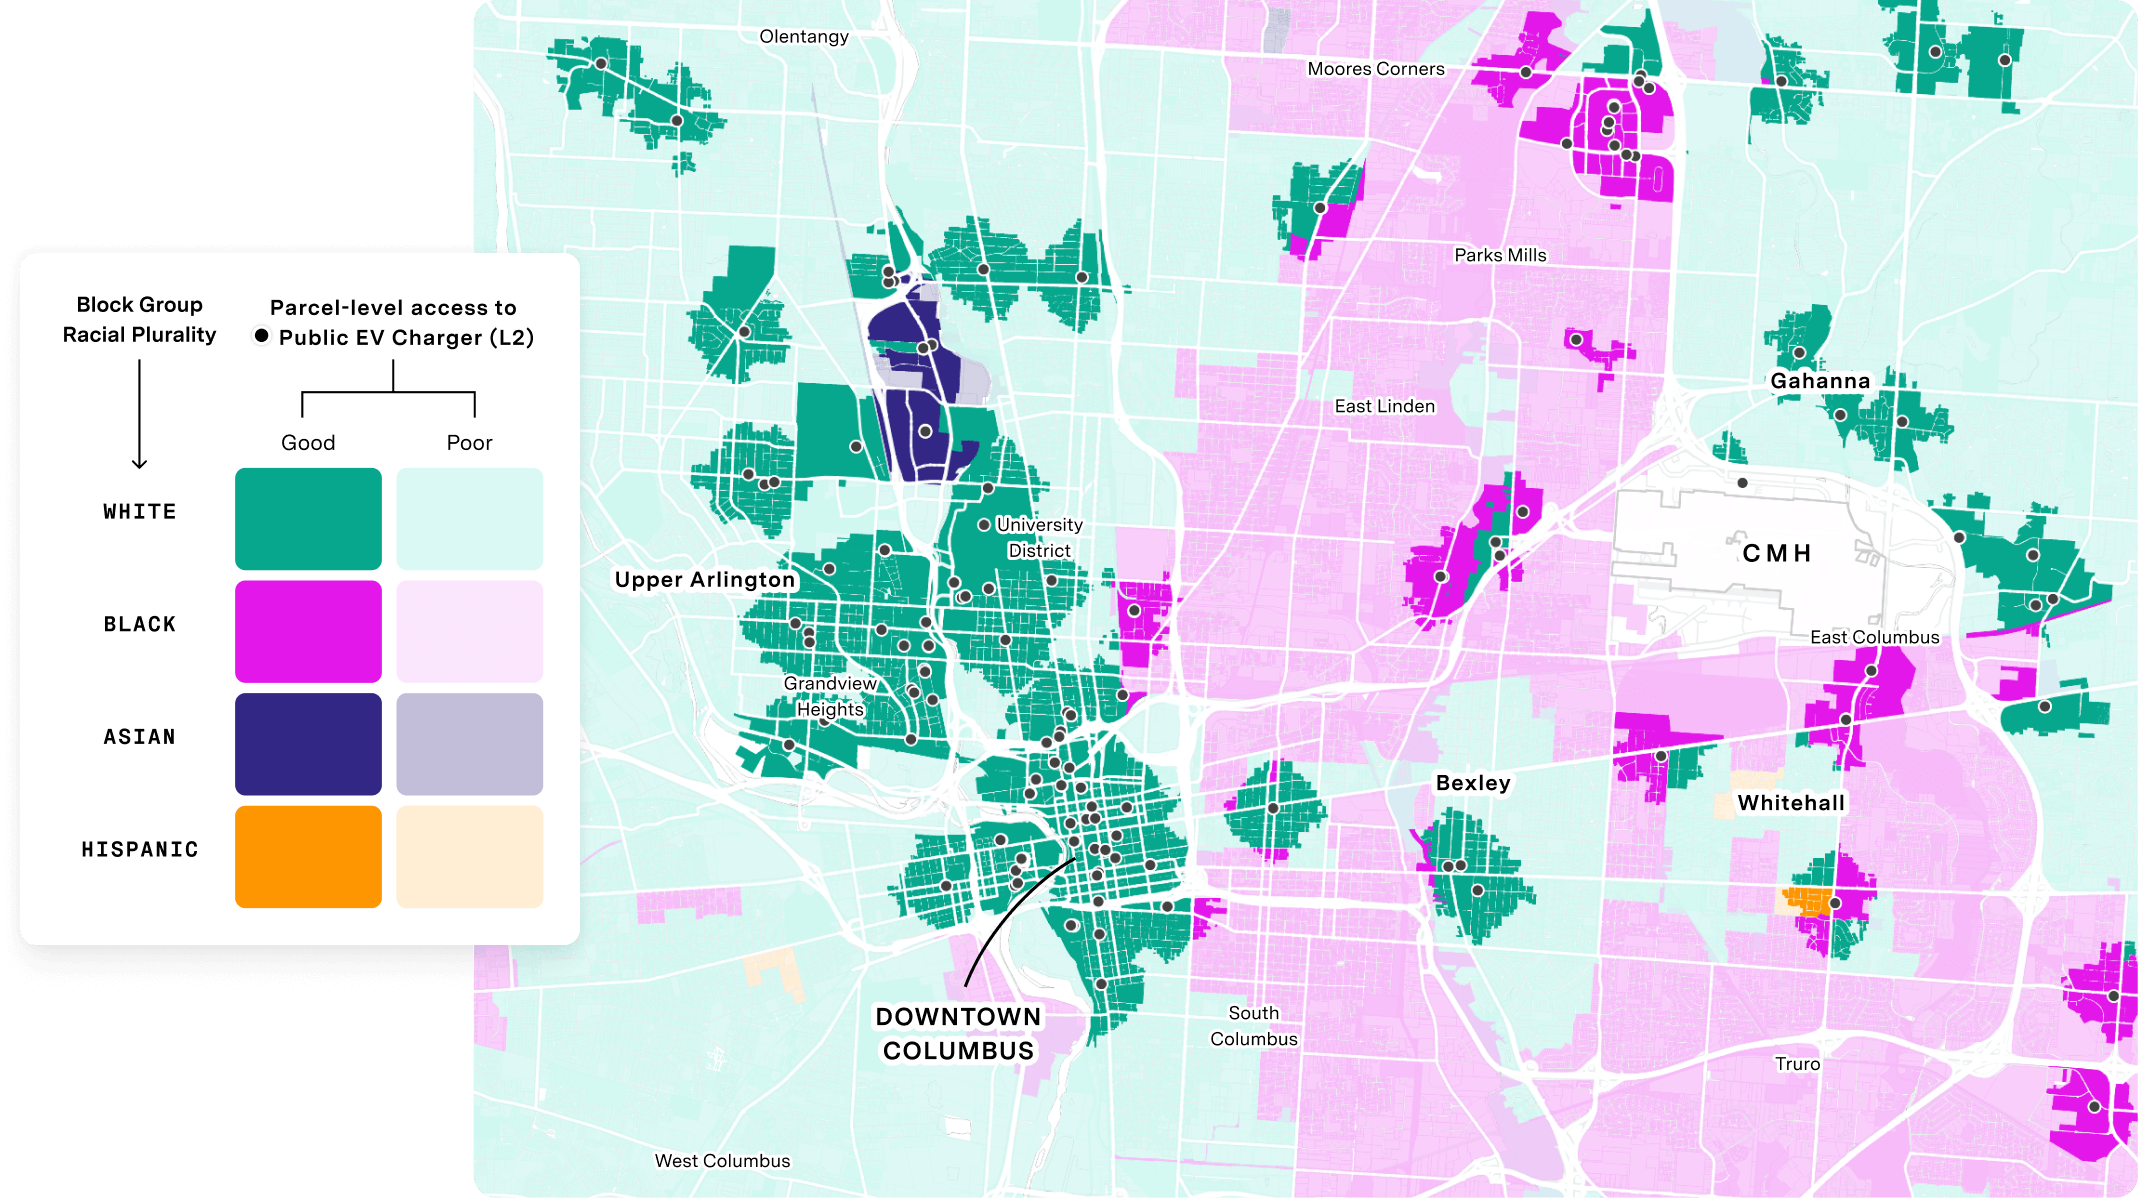
At first glance, you see that Columbus has Level 2 EV chargers spread across the city. A high concentration of chargers are located in the downtown area. So during our study, we took population density into consideration when drawing any conclusions regarding charger placement.
Racial Factors and public EV Charger Locations
Closer inspection of the distribution of public chargers in Columbus reveals disparities when comparing majority White areas to majority non-White areas. This is in line with other recent studies on public EV charging distribution. For example, Axios did an analysis of 35 U.S. cities and found that majority-White census tracts are 1.4 times as likely to have a charger.
Given UrbanFootprint’s unique ability to aggregate data across all census resolutions, we looked a level of granularity deeper, analyzing census block groups in Columbus using our Analyst application. It revealed that the EV charging locations in our study area are even more heavily skewed towards majority-White areas than what Axios had found in other cities around the country.
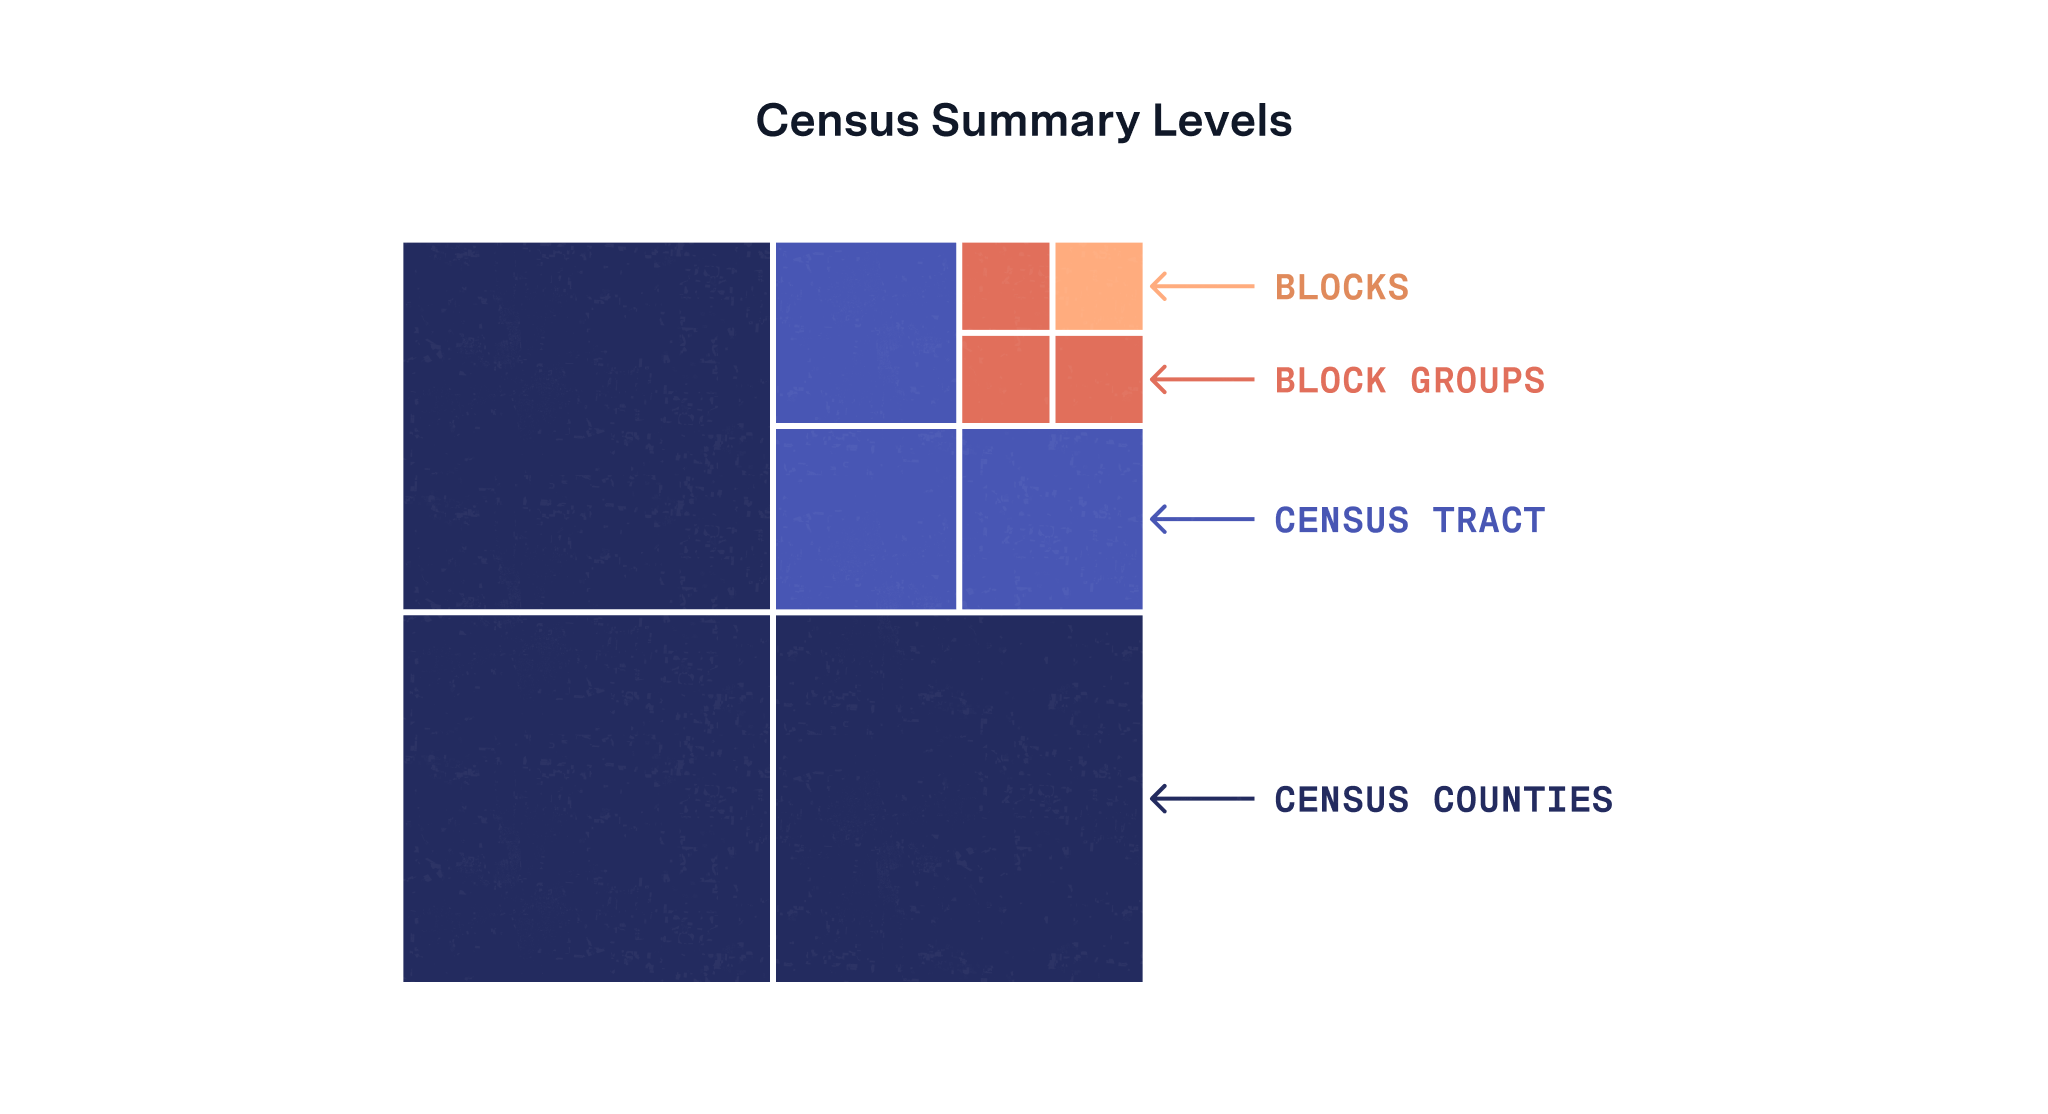
In Columbus, majority-White block groups are 2 times more likely to have a charger, and 2.3 times more likely to have at least three chargers.
But we knew there were likely other factors that may be more strongly correlated with the prevalence of charging stations than race and ethnicity.
Relationship between EV Charger Presence and Educational Level
Our study found an even stronger correlation between high education levels and the presence of EV chargers. It was immediately apparent from looking at the map that the median US educational attainment level (36% with at least a bachelor’s degree) was a tipping point for whether a block group would likely contain an L2 charger.
To be specific, around 80% of L2 chargers in our study were located in block groups with above the US median for bachelor’s degree attainment – and those block groups were 3.55 times as likely to contain a charger than those below the median.
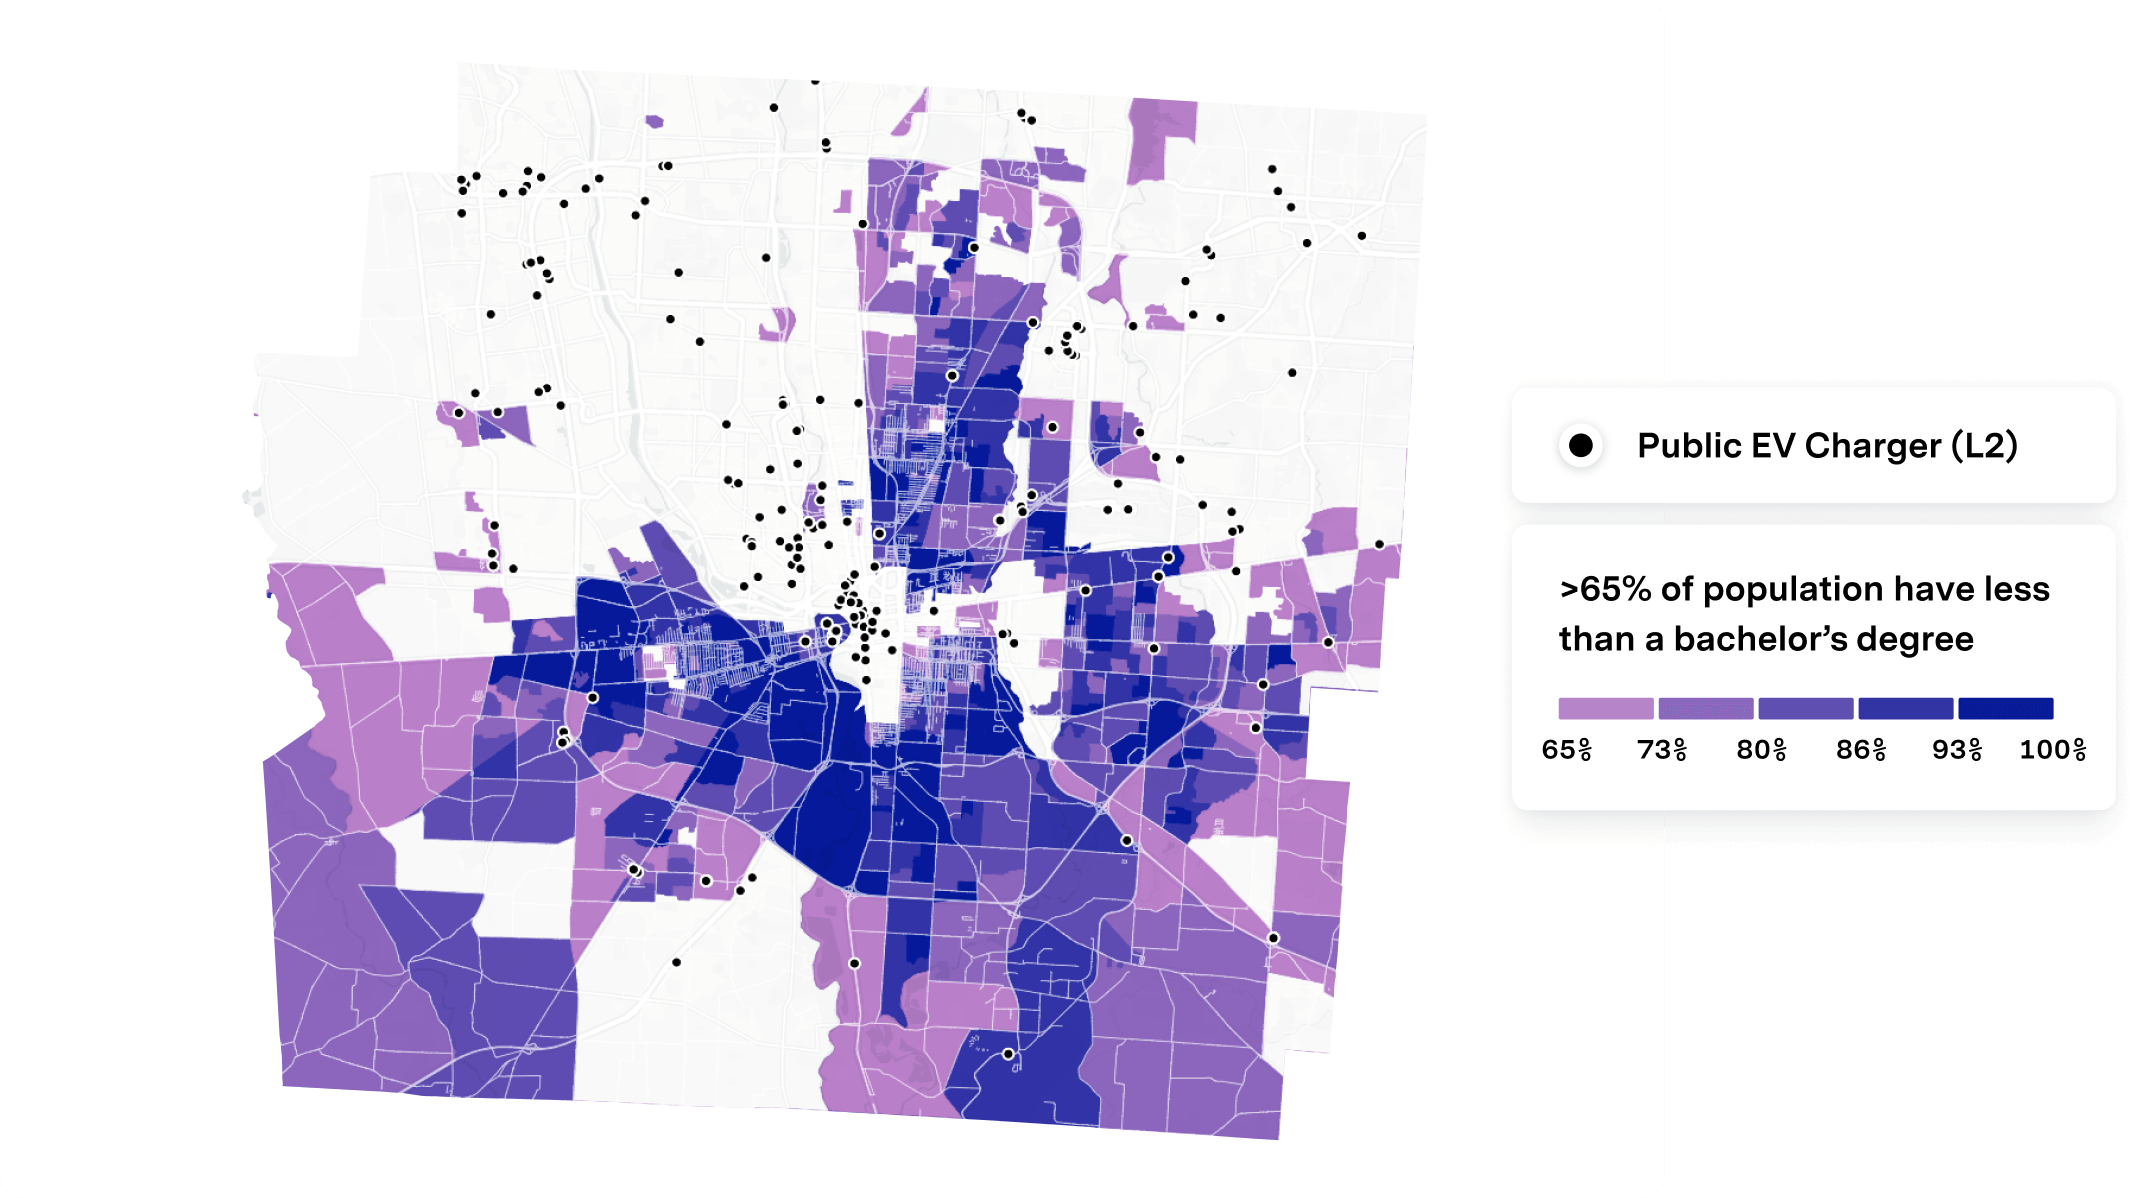
The really shocking piece of this statistic is that these same block groups accounted for only 51% of population and only 40% of area.
Median Income and its Impact on EV Charger Distribution
Median income also appears to play a significant role in charger presence. Within our study area, block groups with chargers had median incomes 1.1 times higher than those without. Moreover, block groups with average incomes above the US median for household income ($68,703) were 2.24 times as likely to have a charger.
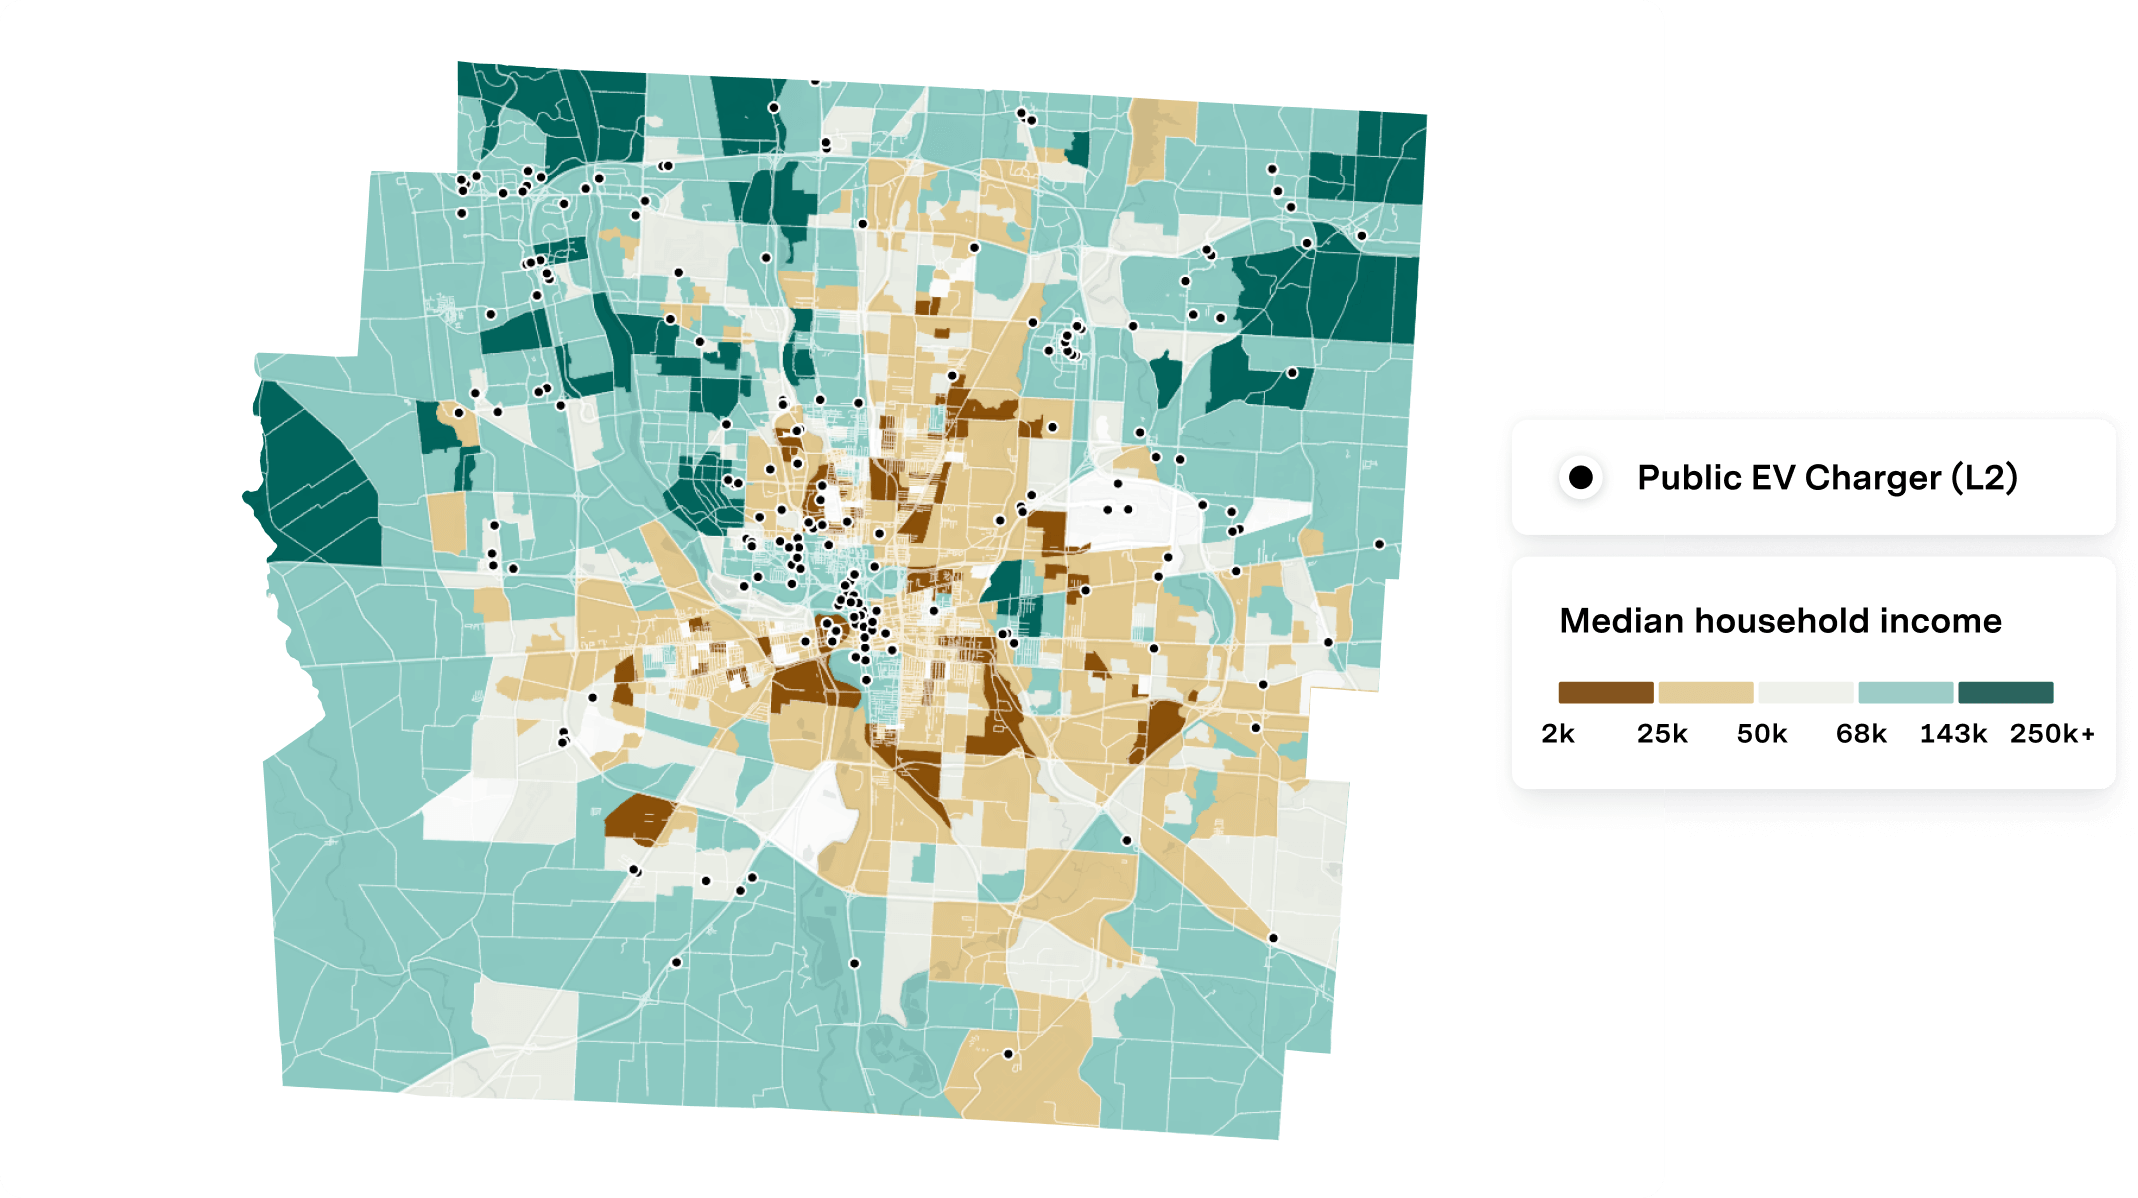
This finding supports the argument that historically, charger placement has favored higher income areas, and raises concerns for how access to EV infrastructure will lead to income-based disparities in future EV usage.
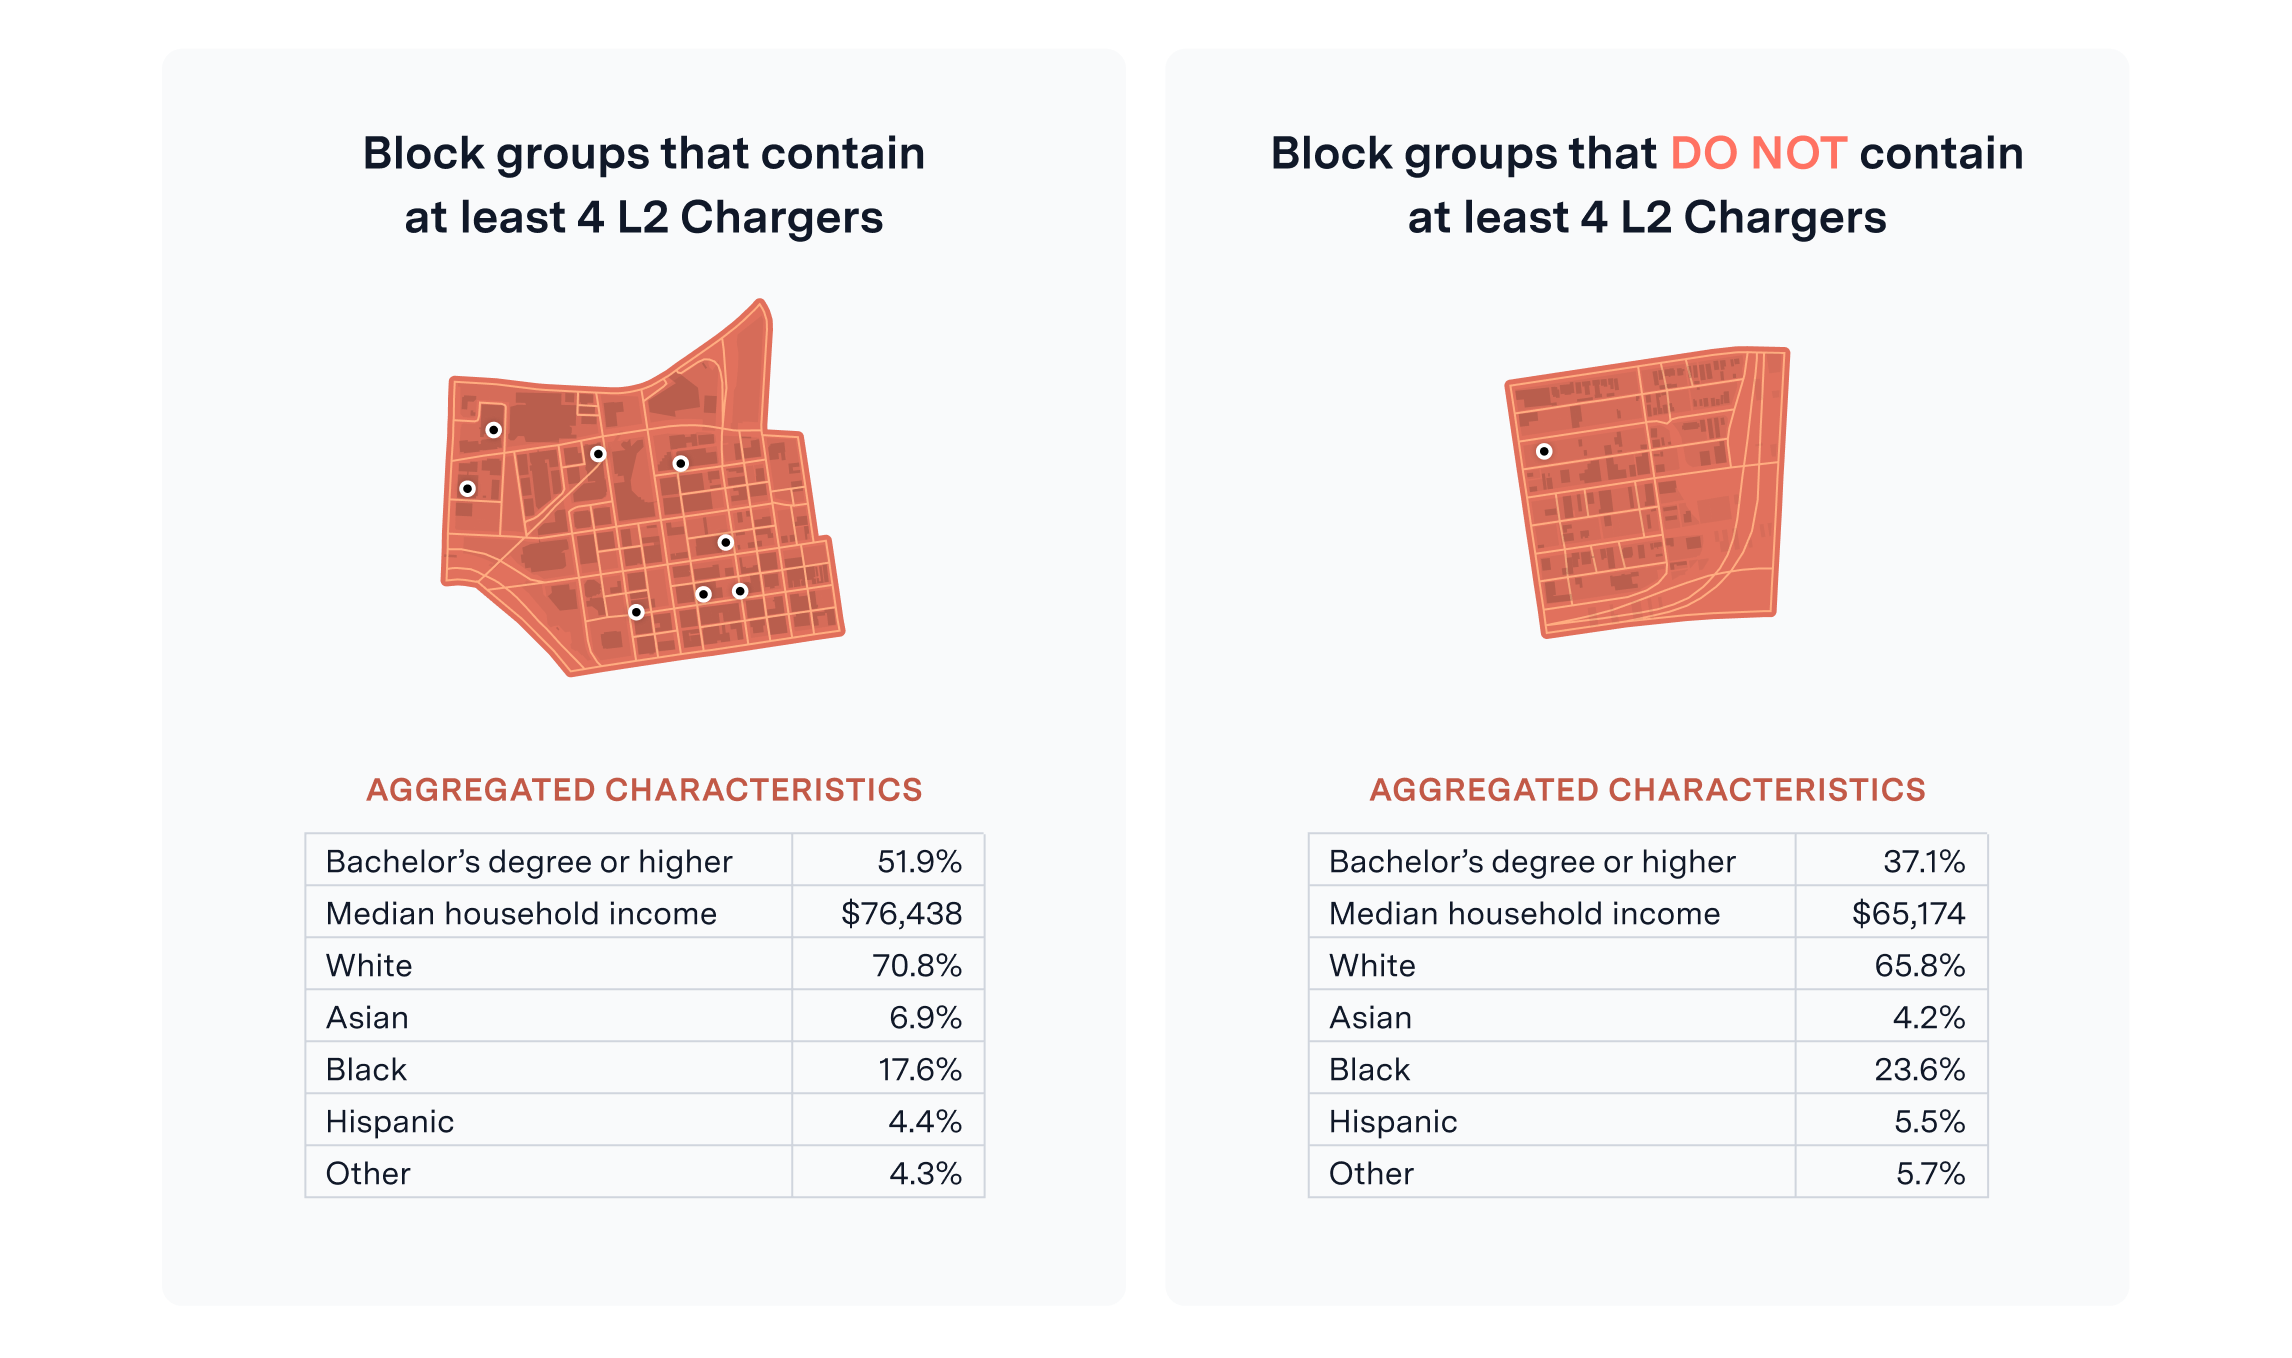
Equitable Access to EV Chargers
The end goal of public EV charging infrastructure is to serve the public. That is, having enough chargers in a given block group to satisfy demand. We wanted to get an overall picture of who is being “served” versus “unserved” in Columbus. We chose 4 L2 chargers as a threshold for which to consider a block group “served.”
When we looked at the data through this lens, all three ‘metrics’ (education level, median income, and racial composition) showed equity-related differences.
Conclusions and Recommendations
Overall, our findings indicate that education level and median income are the most closely related metrics to the distribution of EV chargers in Columbus, Ohio. While racial factors are not quite as strong, there is still a trend for chargers to be more present in predominantly White block groups – in line with studies of other major cities across the country.
Additionally, the results were progressively more compelling as we peeled back all of the layers of data. For example, when limiting the analysis to the areas of the city with the highest population density, and increasing the threshold of what counts as a charging gap, the trends are magnified significantly.
Policymakers, local governments, utilities, and private companies should consider these findings when incentivizing, funding, planning, and placing future EV infrastructure. By focusing on ensuring equitable access to chargers, they can support the wider adoption of EVs. This includes prioritizing charger installation in diverse neighborhoods and areas with lower educational attainment and income levels.
By leveraging the right data at the intersections of climate, community, and the built environment, we can surface the actionable insights that will ensure a more equitable distribution of EV chargers – that will ultimately contribute significantly to higher EV adoption rates, pushing us closer towards a more resilient, sustainable, and inclusive future. Resilience Insights, when paired with our comprehensive Analyst application for data visualization, provide answers to many complex questions related to Infrastructure & Mobility for any location in the United States. Contact us if you want to learn more!
