UrbanFootprint’s Walk/Bike and Transit Accessibility modules make it easier than ever to map and measure access to jobs, schools, parks, and businesses—giving you the clarity you need to quickly and confidently pinpoint gaps, prioritize investments, and guide smarter mobility improvements.
Say goodbye to cumbersome workflows. UrbanFootprint delivers precise, dynamic maps and metrics in minutes, empowering you to focus on designing solutions and achieving results.
Walk and Bike Accessibility Analysis
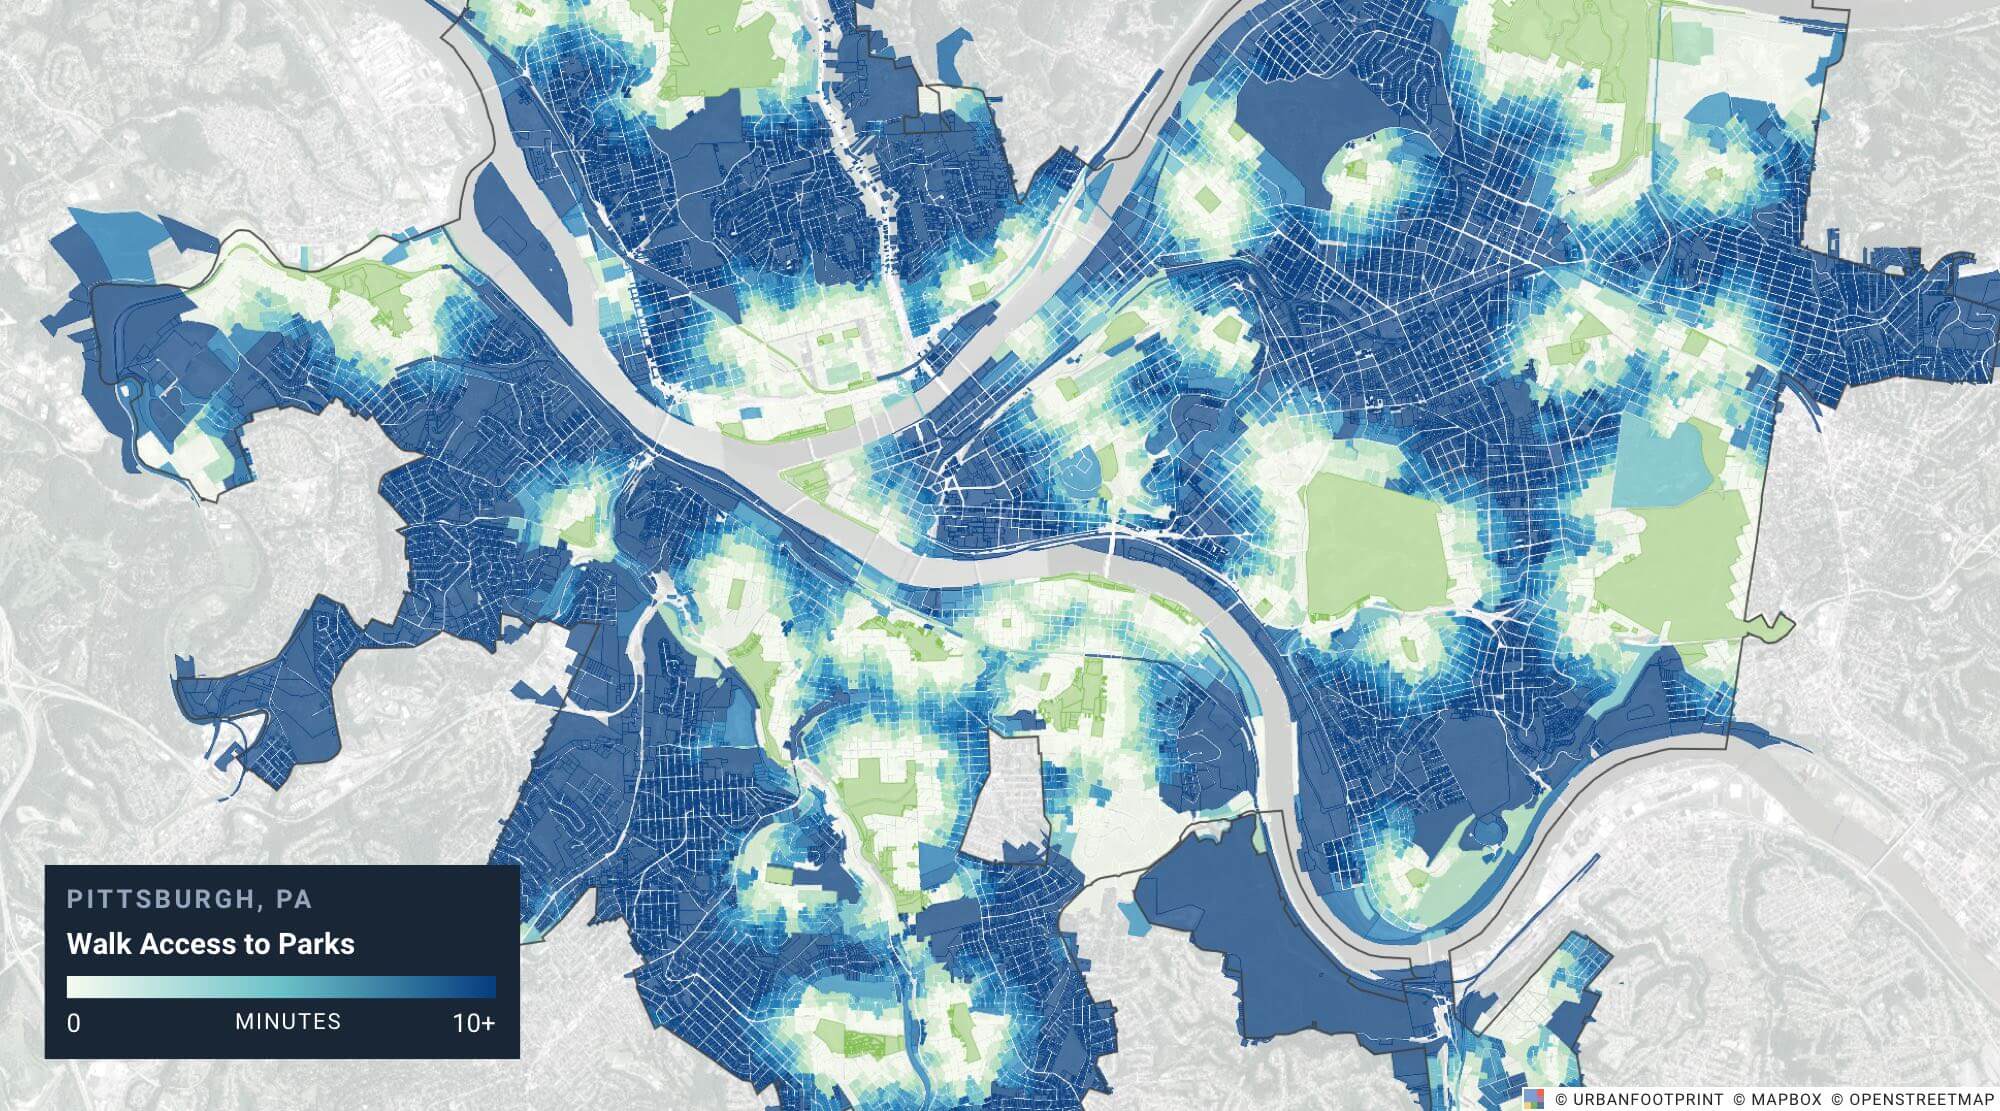
With UrbanFootprint’s Walk and Bike Accessibility module, planners can map and evaluate walk and bike access with a simple click of the mouse. The module provides the tools planners need to map and measure connectivity in minutes, including:
- Network-based analysis: Simple ‘crow-fly’ buffers don’t tell the whole story. UrbanFootprint performs network analysis on up-to-date roads and walk paths to provide more accurate and actionable assessments of walk and bike accessibility.
- Custom points of interest: Tailor your analysis to specific locations like grocery stores, parks, schools, cooling or evacuation centers, or unique community amenities.
- Clear visuals: Generate intuitive, presentation-ready maps to inform stakeholders and guide planning efforts.
- Flexible application for different travel modes: Set different travel speeds to analyze walking, biking, or other travel modes to suit your project’s needs.
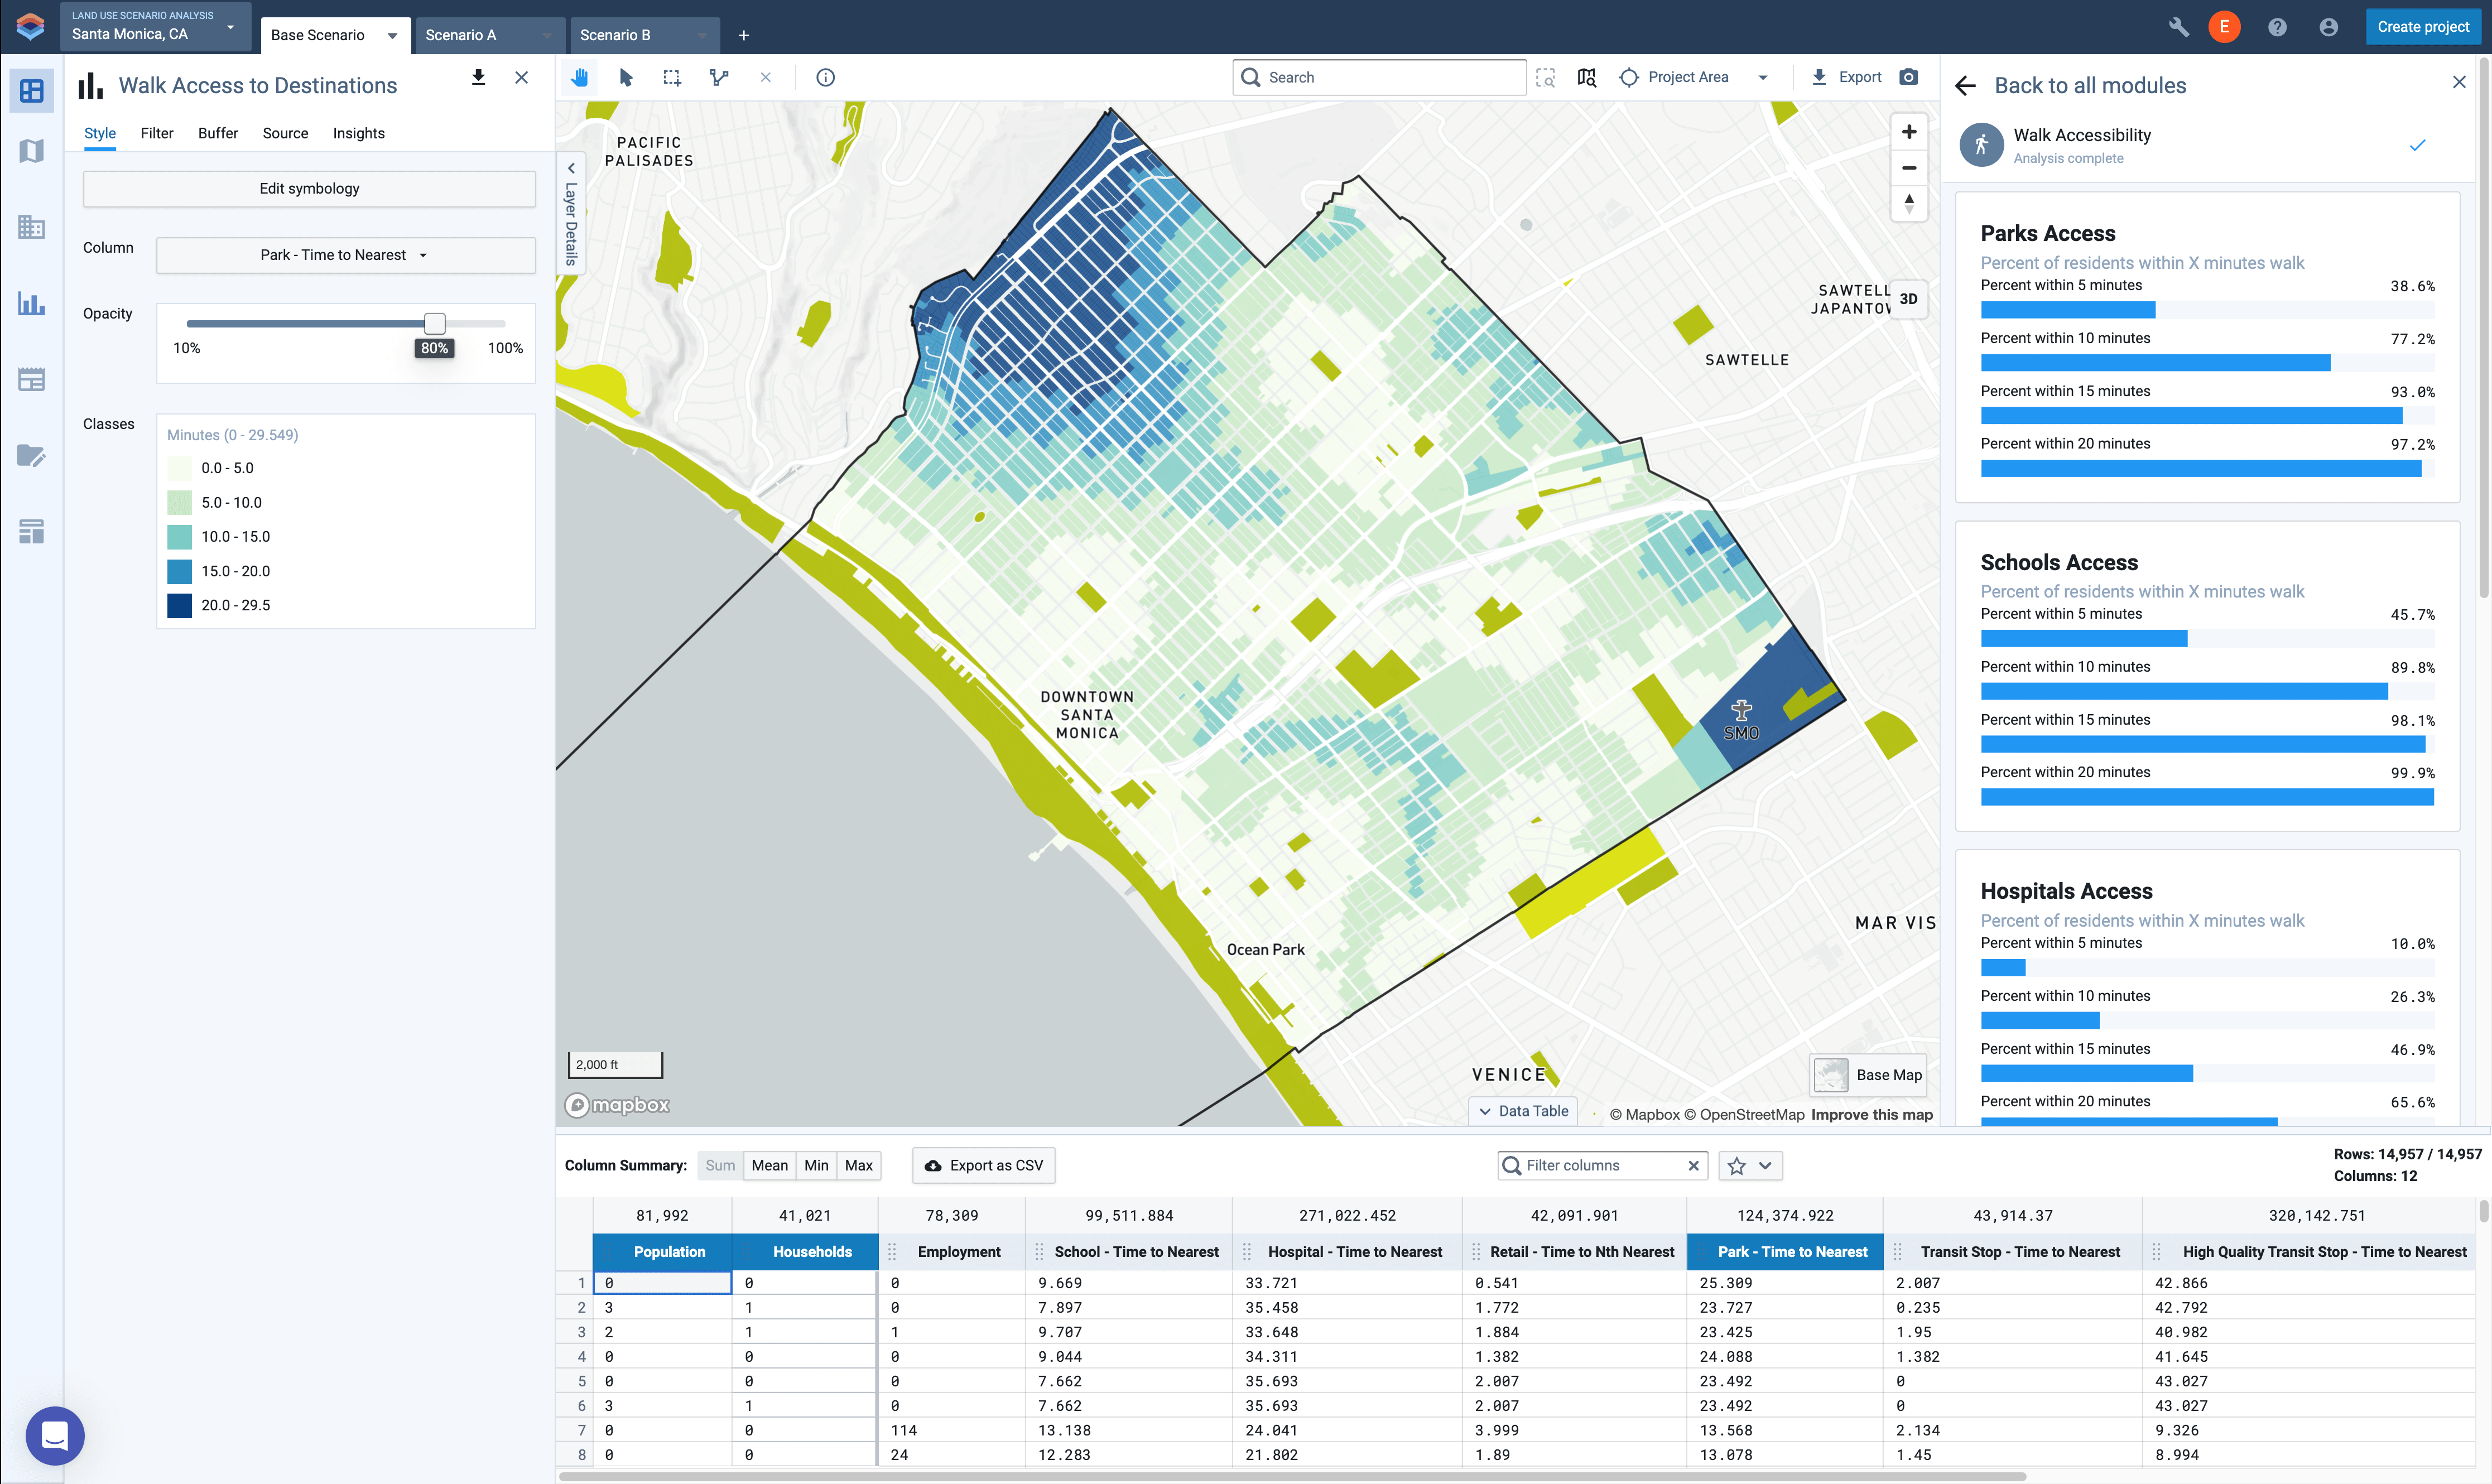
Meet accessibility goals
Evaluate conditions relative to district or city-wide goals for walk and bike access to parks, schools, and other destinations. Target and test interventions to close accessibility gaps and drive attainment.
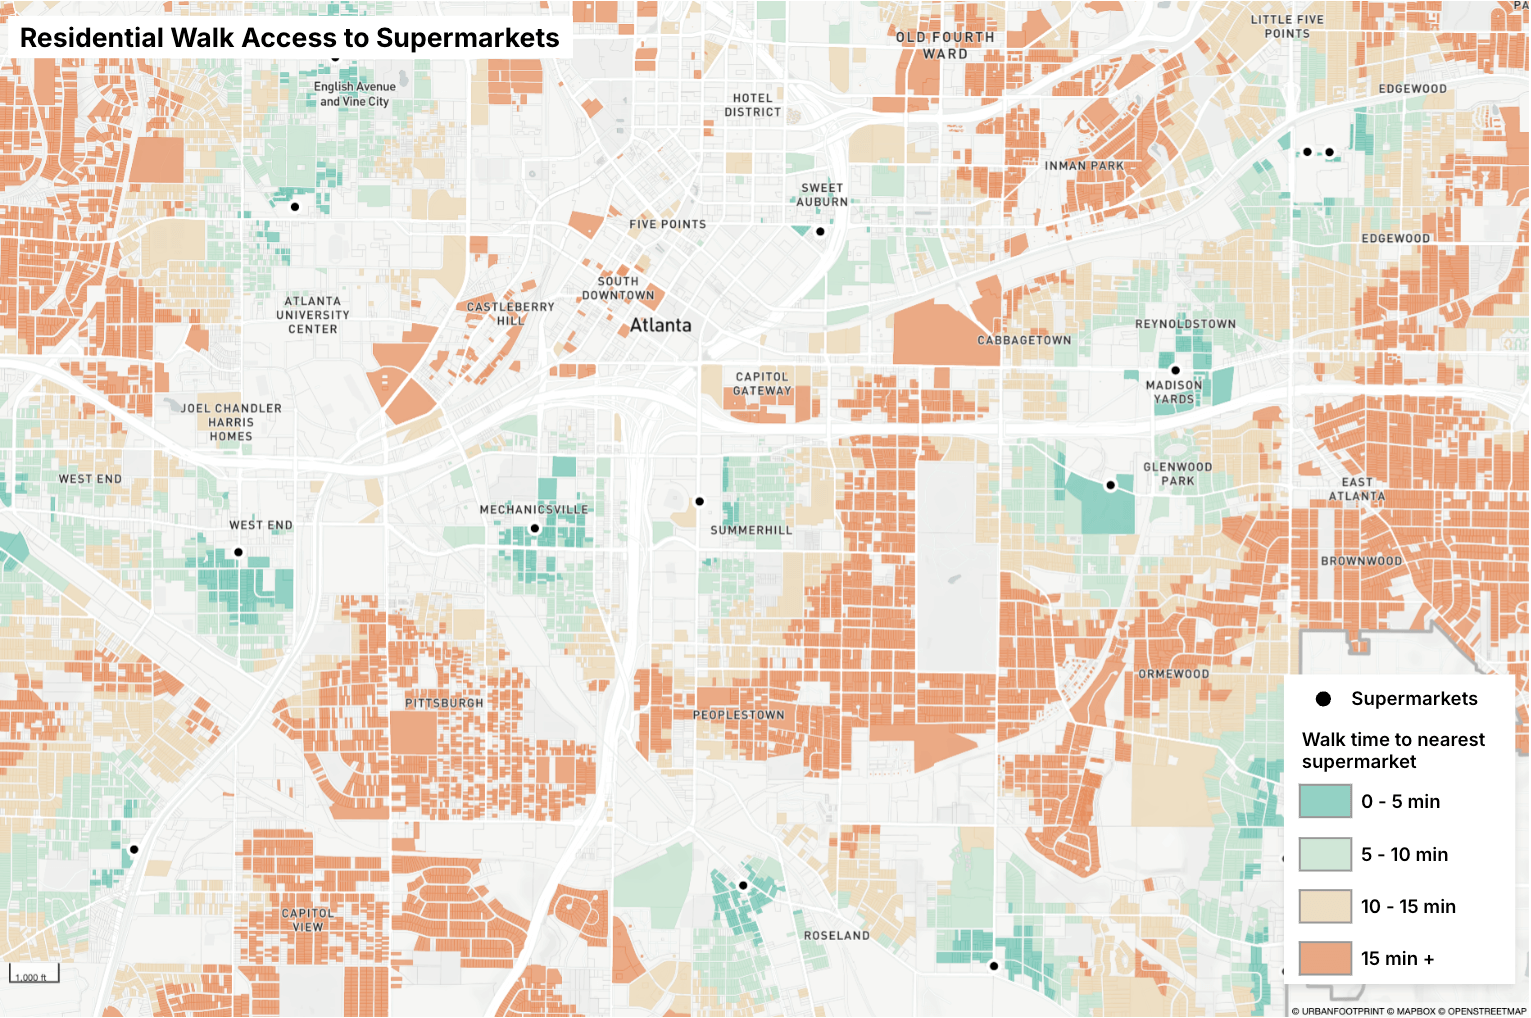
Spot connectivity gaps
Easily identify areas with limited walk access to key destinations like schools, parks, and local businesses such as grocery stores. Choose from hundreds of built in datasets or evaluate accessibility to your own custom locations.
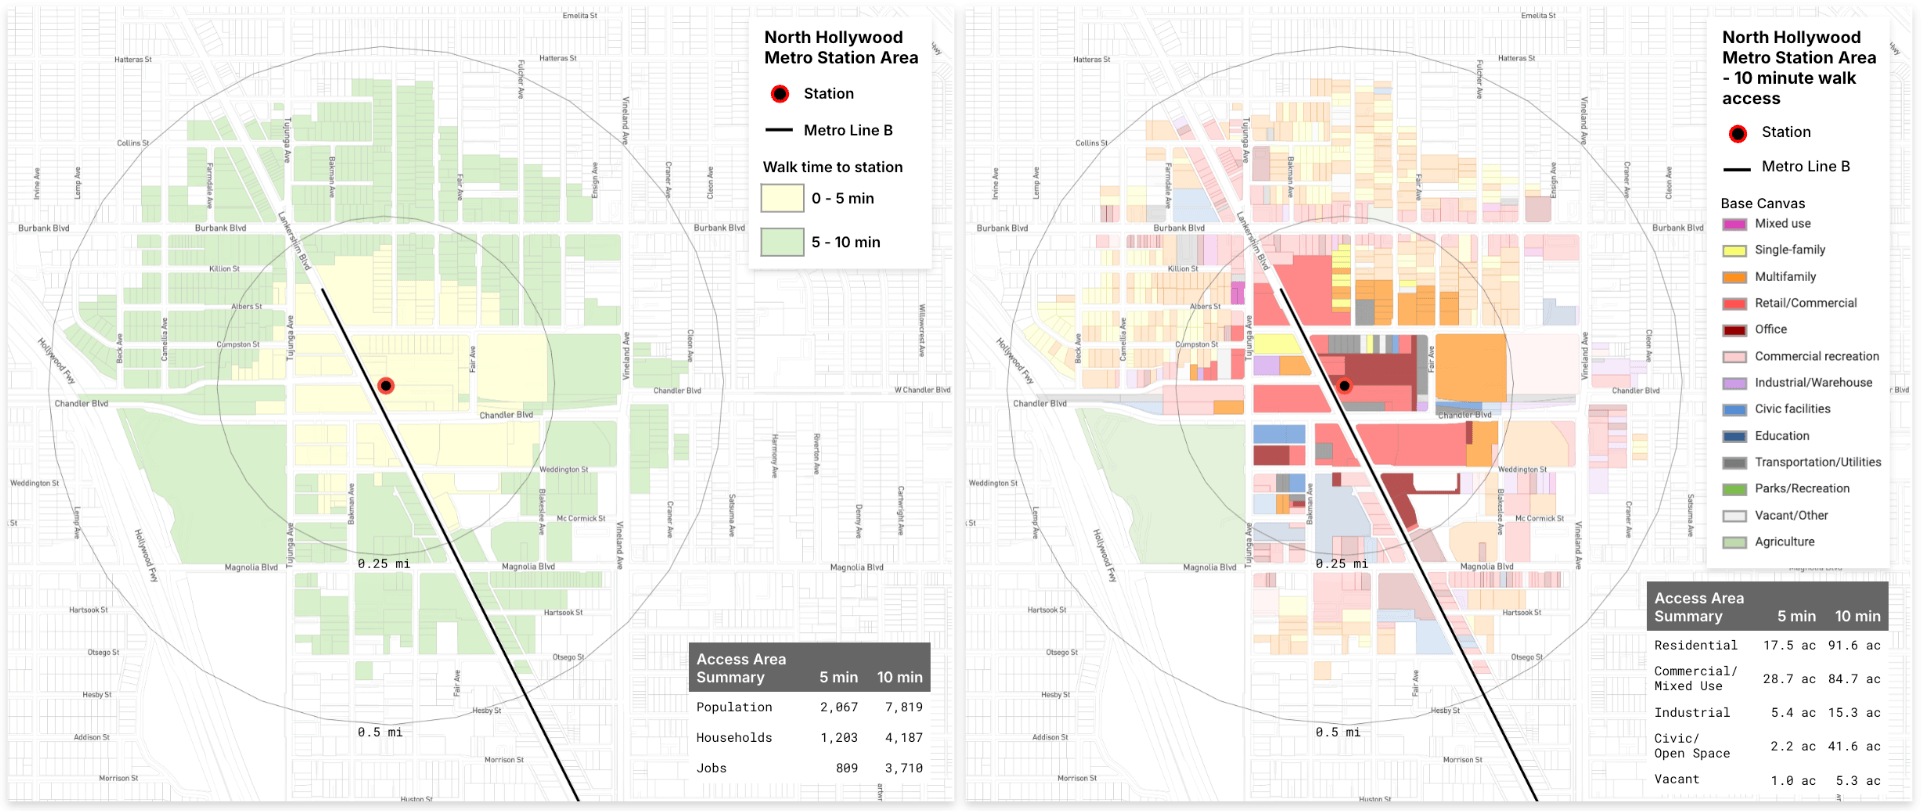
Advance TOD objectives
Analyze walk and/or bike access to public transit stops to assess how well existing or planned development aligns with transit access or ridership goals. Quickly map walksheds around transit stops to guide transit-oriented development (TOD) and evaluate alternative development options.
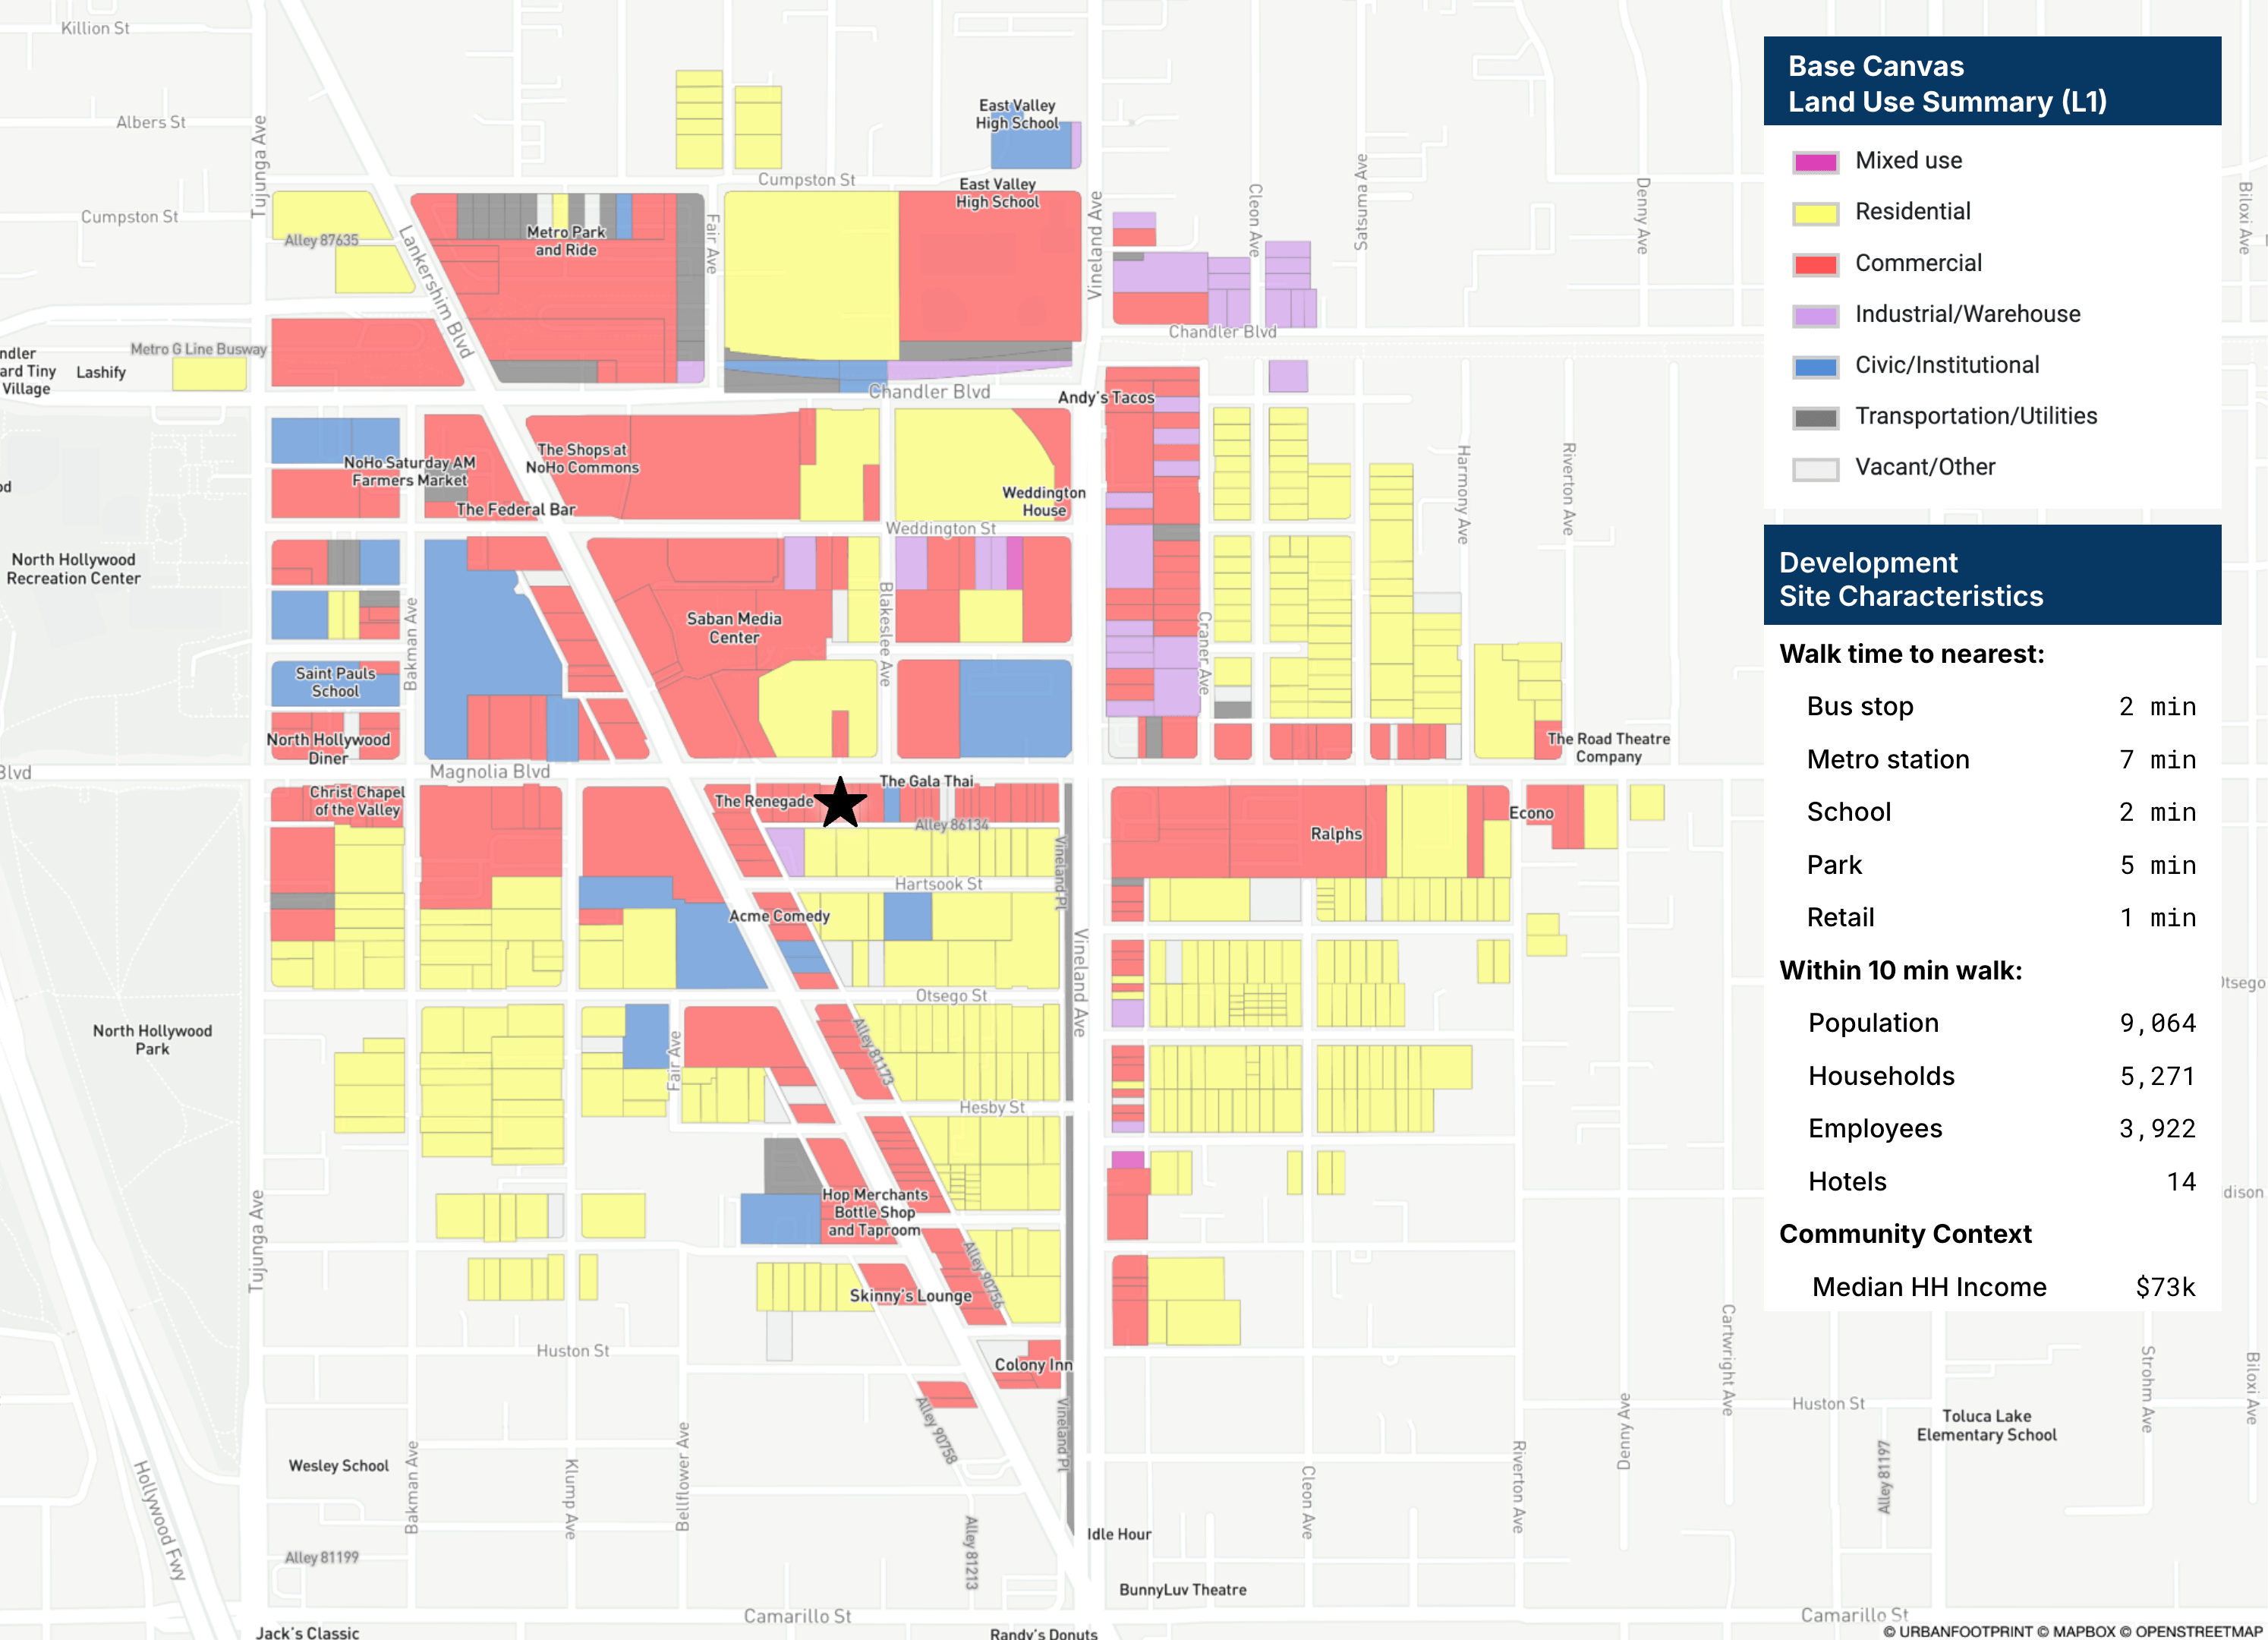
Compare development opportunities
Pinpoint sites with superior walk access to guide investments and compare alternative interventions and investment opportunities.
Transit Accessibility Analysis
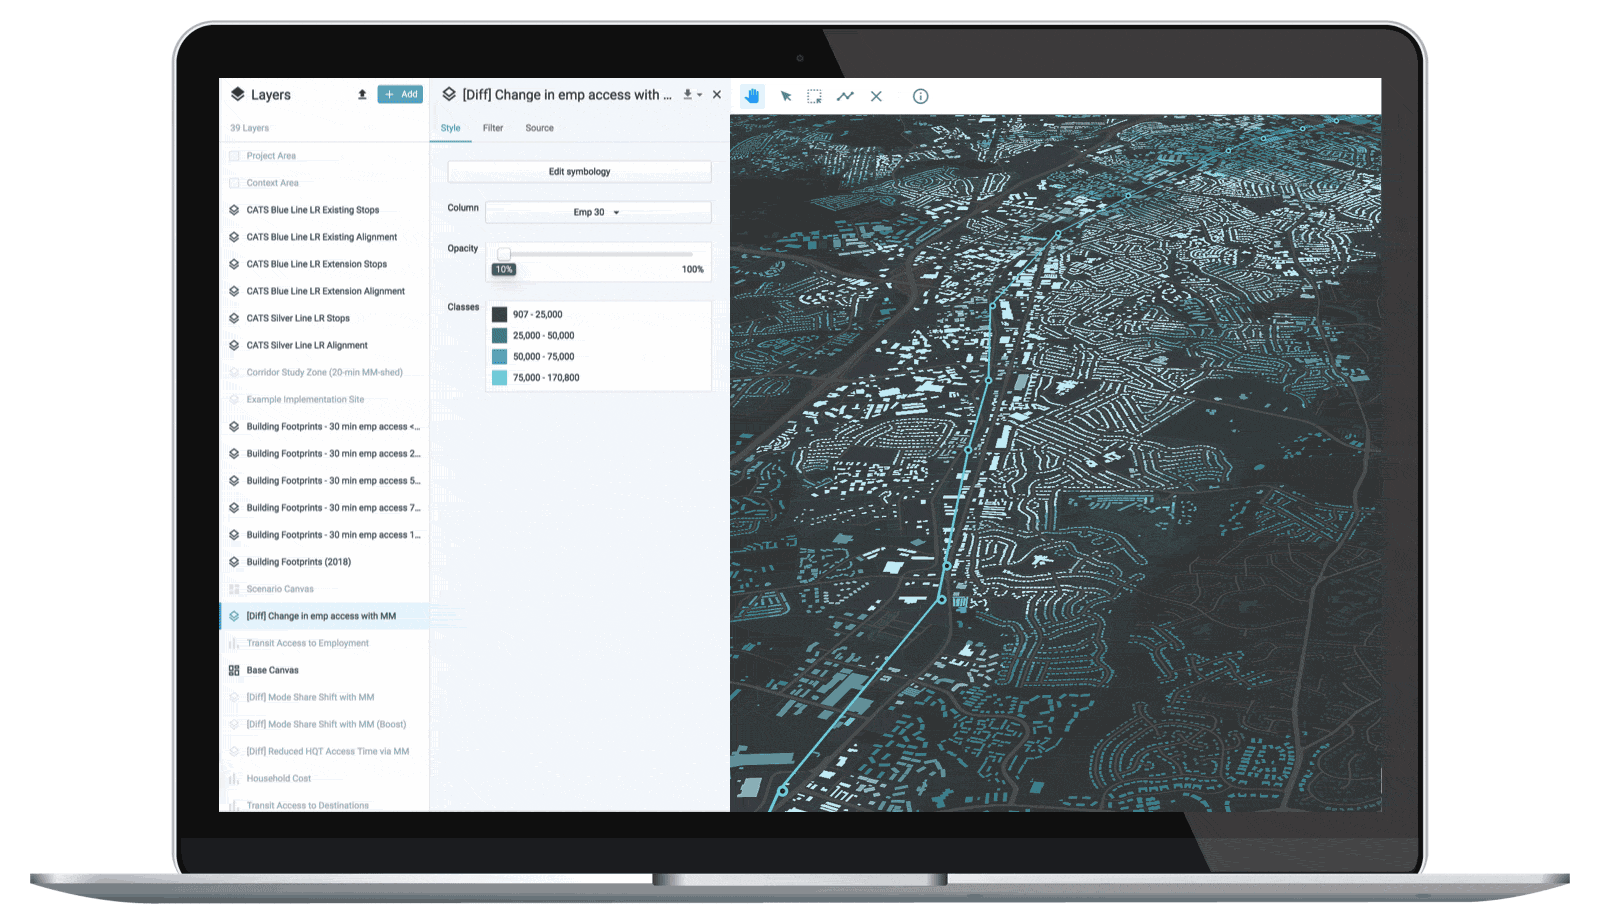
UrbanFootprint gives planners push-button access to powerful transit accessibility analysis based on current public transit data feeds. Using state-of-the-practice, peer-reviewed methods, the Transit Accessibility module quickly measures transit accessibility and travel times to employment and other key destinations such as schools, hospitals, and parks. The module can be applied to assess baseline conditions as well as future land use scenarios and transit network alternatives. The Transit Accessibility module features:
- Quick, clear outputs: Readily visualize transit connectivity and key metrics, identifying opportunities and gaps.
- Up-to-date data: Run analysis based on the latest transit lines and stops data from agencies across the U.S. (GTFS), or evaluate future transit options.
- Custom points of interest: Tailor your analysis to specific locations, from essential destinations or amenities to proposed development sites.
Assess existing conditions
Quickly and cost-effectively evaluate baseline transit networks and access to jobs and key destinations. Produce effective maps and metrics for existing conditions reports, stakeholder engagement, and streamlined plan development.
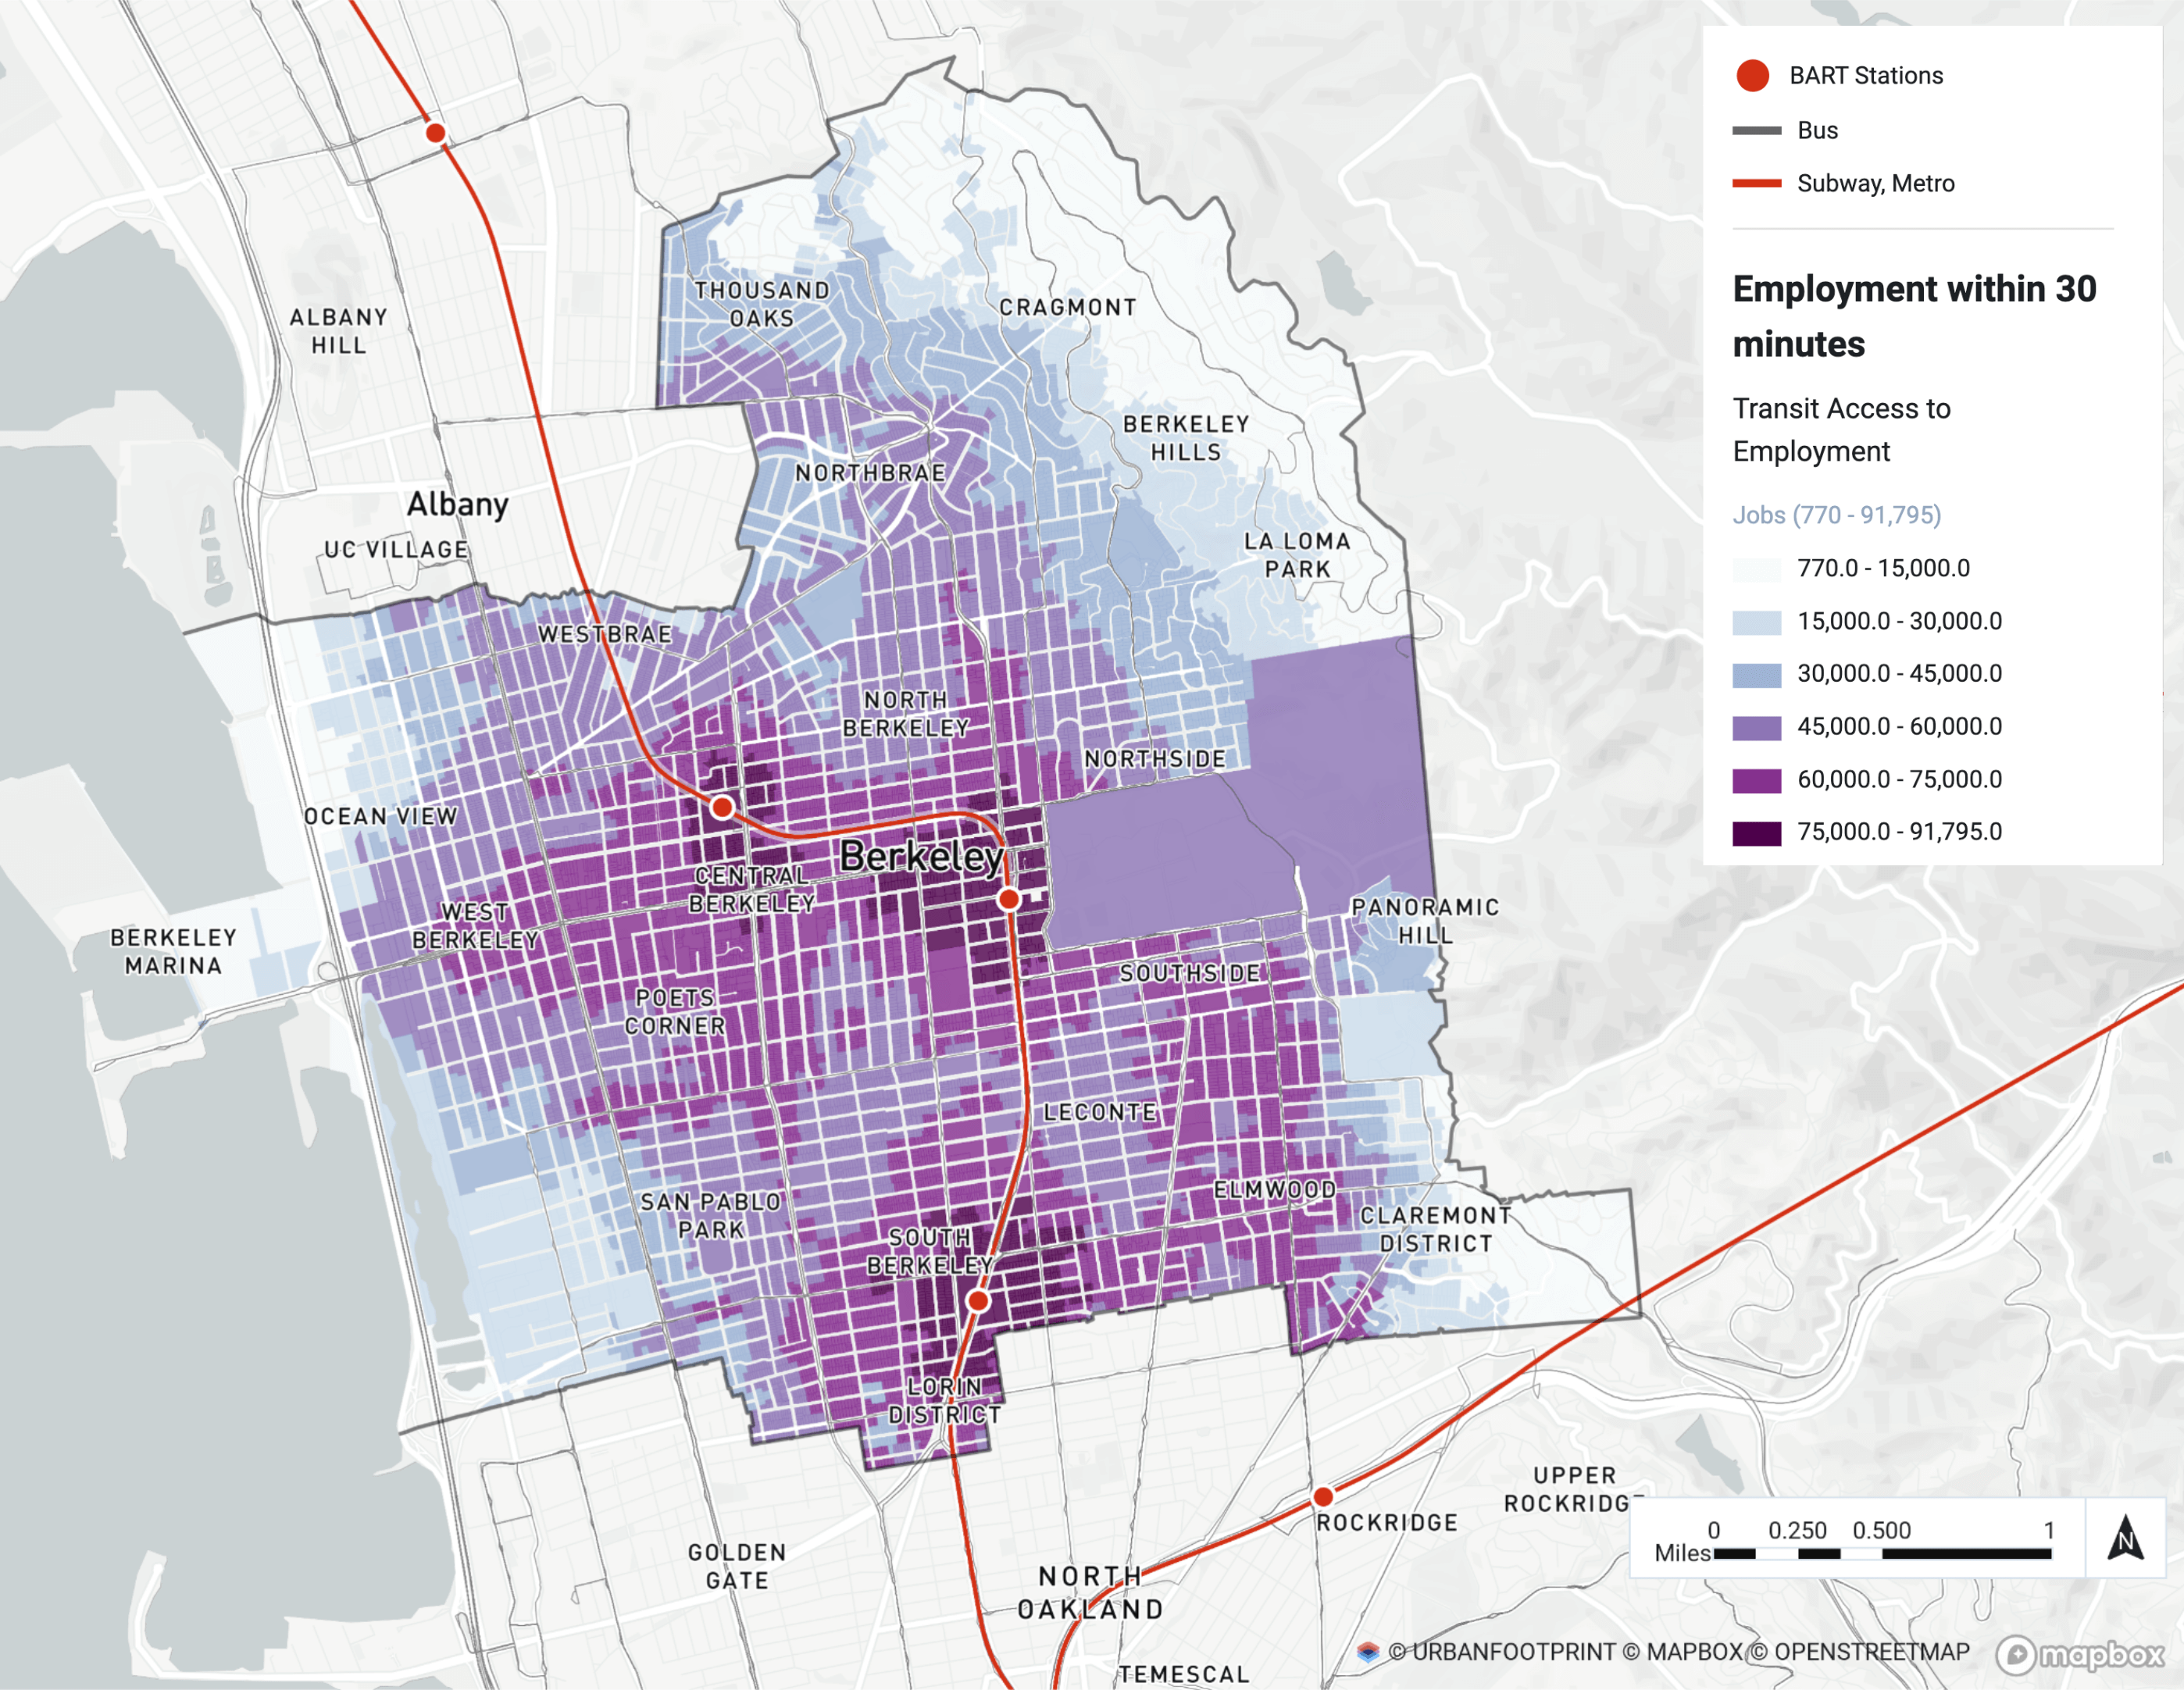
Identify transit-poor zones
Highlight areas with limited transit access to guide planning and policy development.
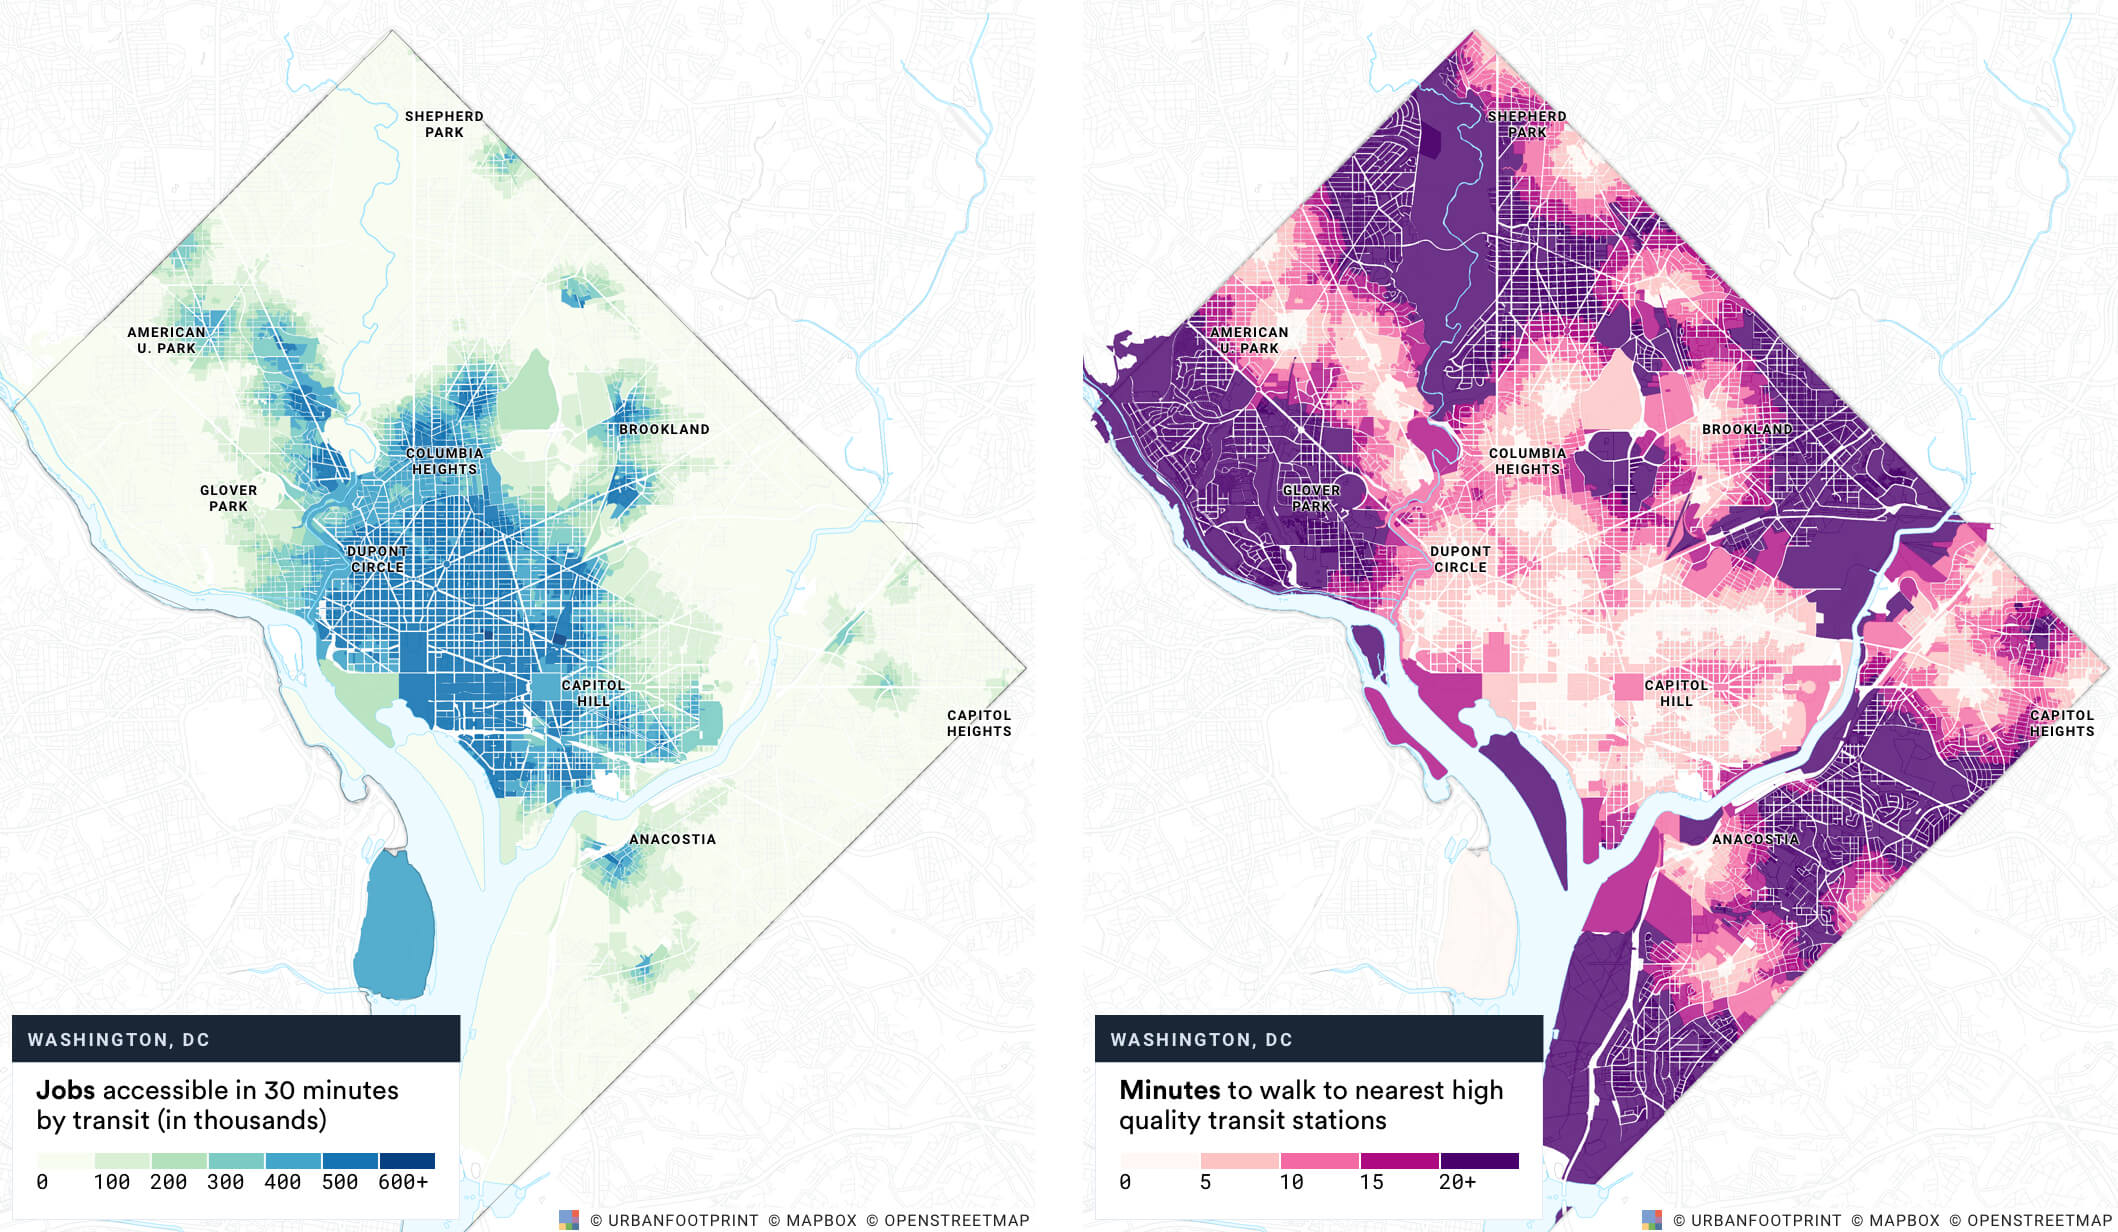
Shape Regional Transportation Plans
Analyze transit accessibility under varying land use and transit network alternatives to assess outcomes relative to local and regional goals.
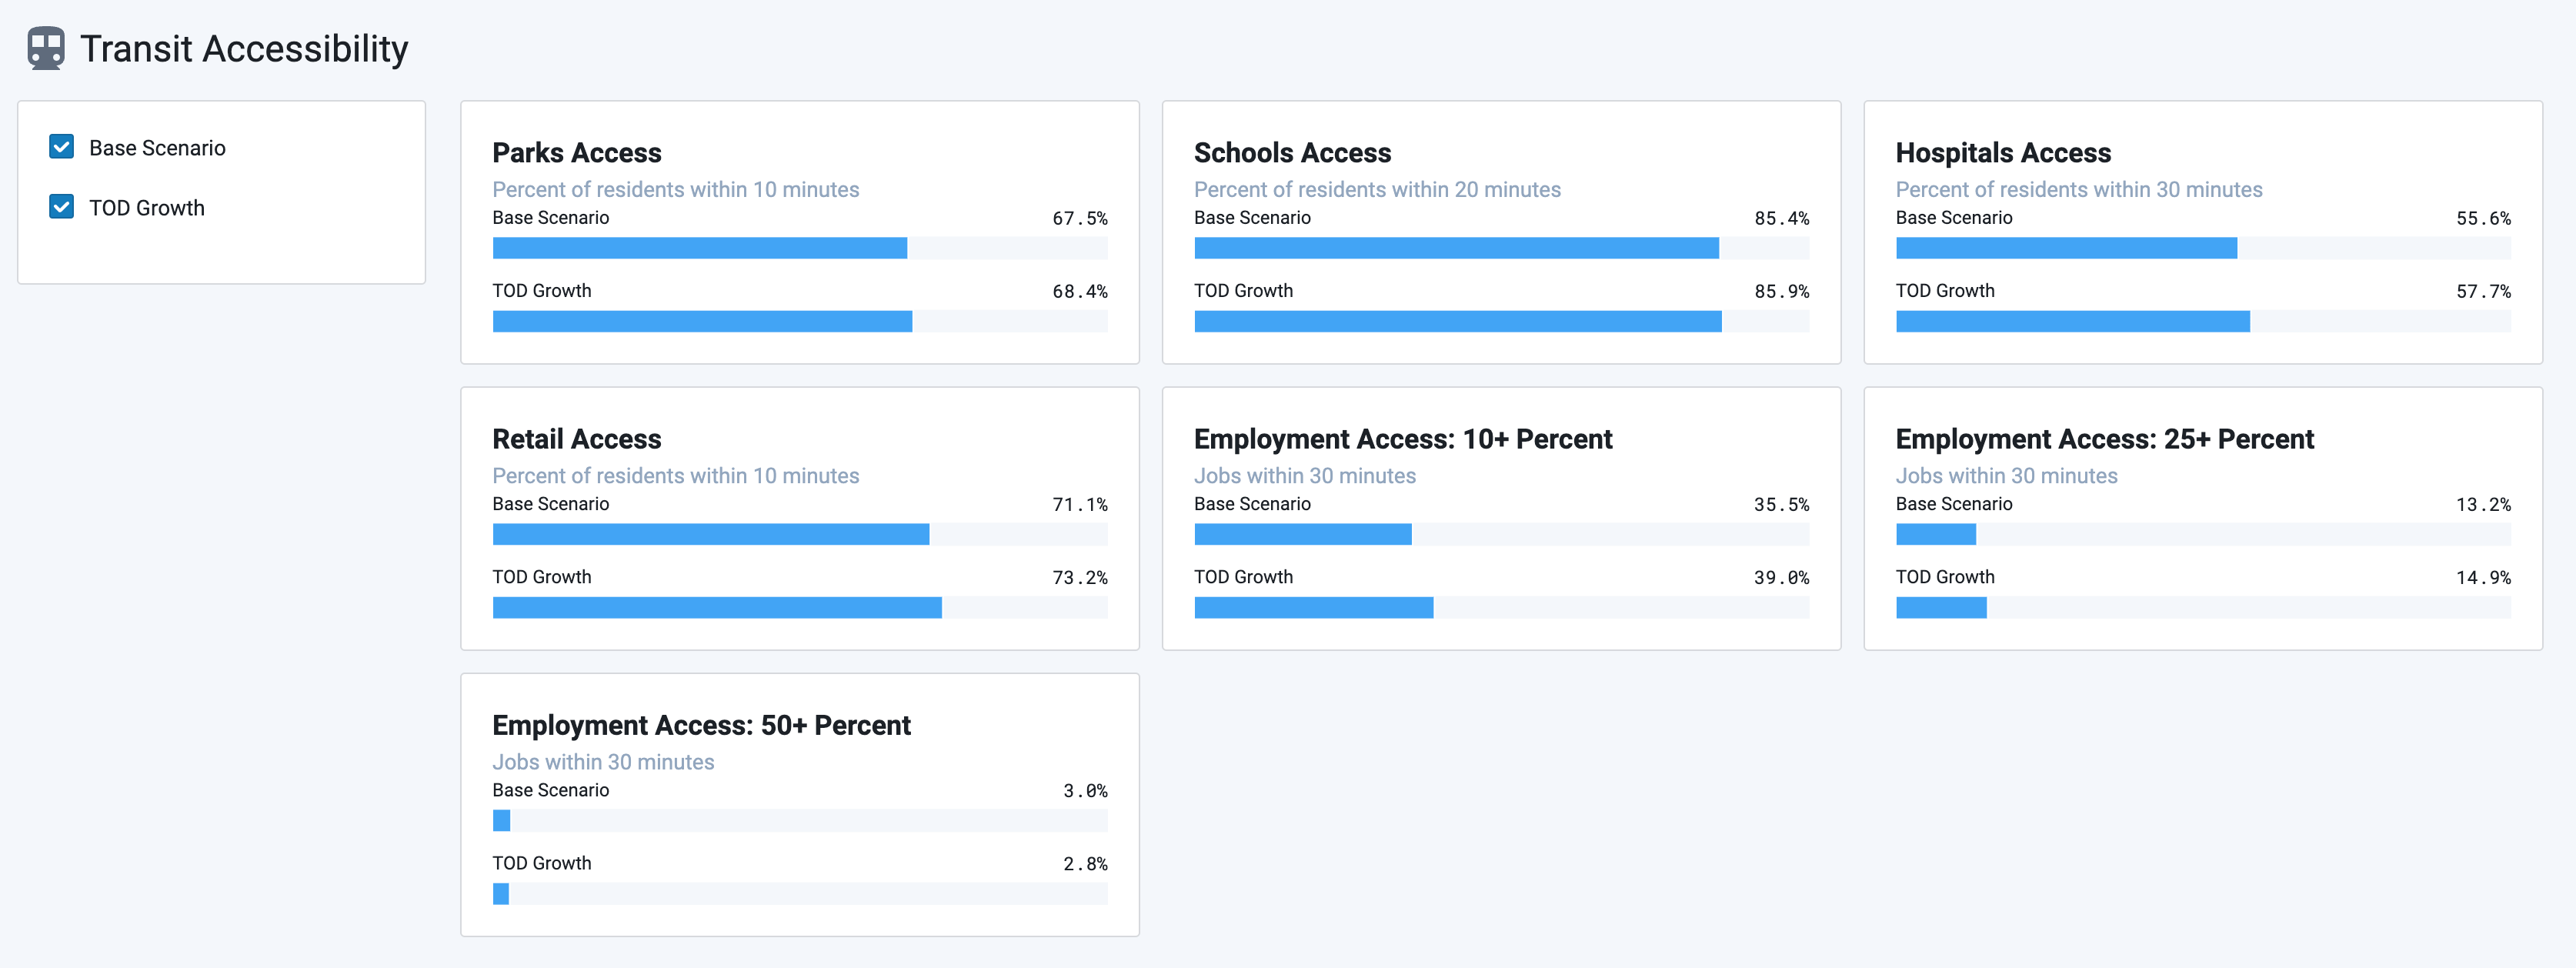
Discover the Power of Advanced Accessibility Analytics
With UrbanFootprint’s Accessibility modules, you can:
- Deliver better outcomes: Use data and maps to inform plans, policy, and investments that improve non-auto access and mobility.
- Save time and resources: Assess existing conditions faster and identify effective interventions and investments without the need for additional high-cost analysis or subconsultants.
- Empower smarter decisions: Equip your team with powerful tools to tackle connectivity challenges and achieve project goals faster.
Ready to up your planning game? Schedule a demo or training session with UrbanFootprint today.
