


Written in collaboration with Nikitas Magel
Residents of low-income communities throughout the U.S. have a long history of suffering from exposure to toxic chemicals and poor quality air, leading to disproportionately high rates of asthma, birth defects, cancer, and more. To a large degree, this is the direct result of generations of exclusionary and discriminatory land-use practices that have situated industrial sites and pollution emitters in close proximity to homes, schools, playgrounds, and other public facilities within these communities.
In California, as a step toward addressing historical and ongoing environmental injustices, Senate Bill 1000 (“The Planning for Healthy Communities Act”) was signed in 2016, making it the first state in the nation to put these considerations into law, defining environmental justice as “the fair treatment and meaningful involvement of people of all races, cultures, incomes, and national origins, with respect to the development, adoption, implementation, and enforcement of environmental laws, regulations, and policies.”
How does SB 1000 define environmental justice for California General Plans?
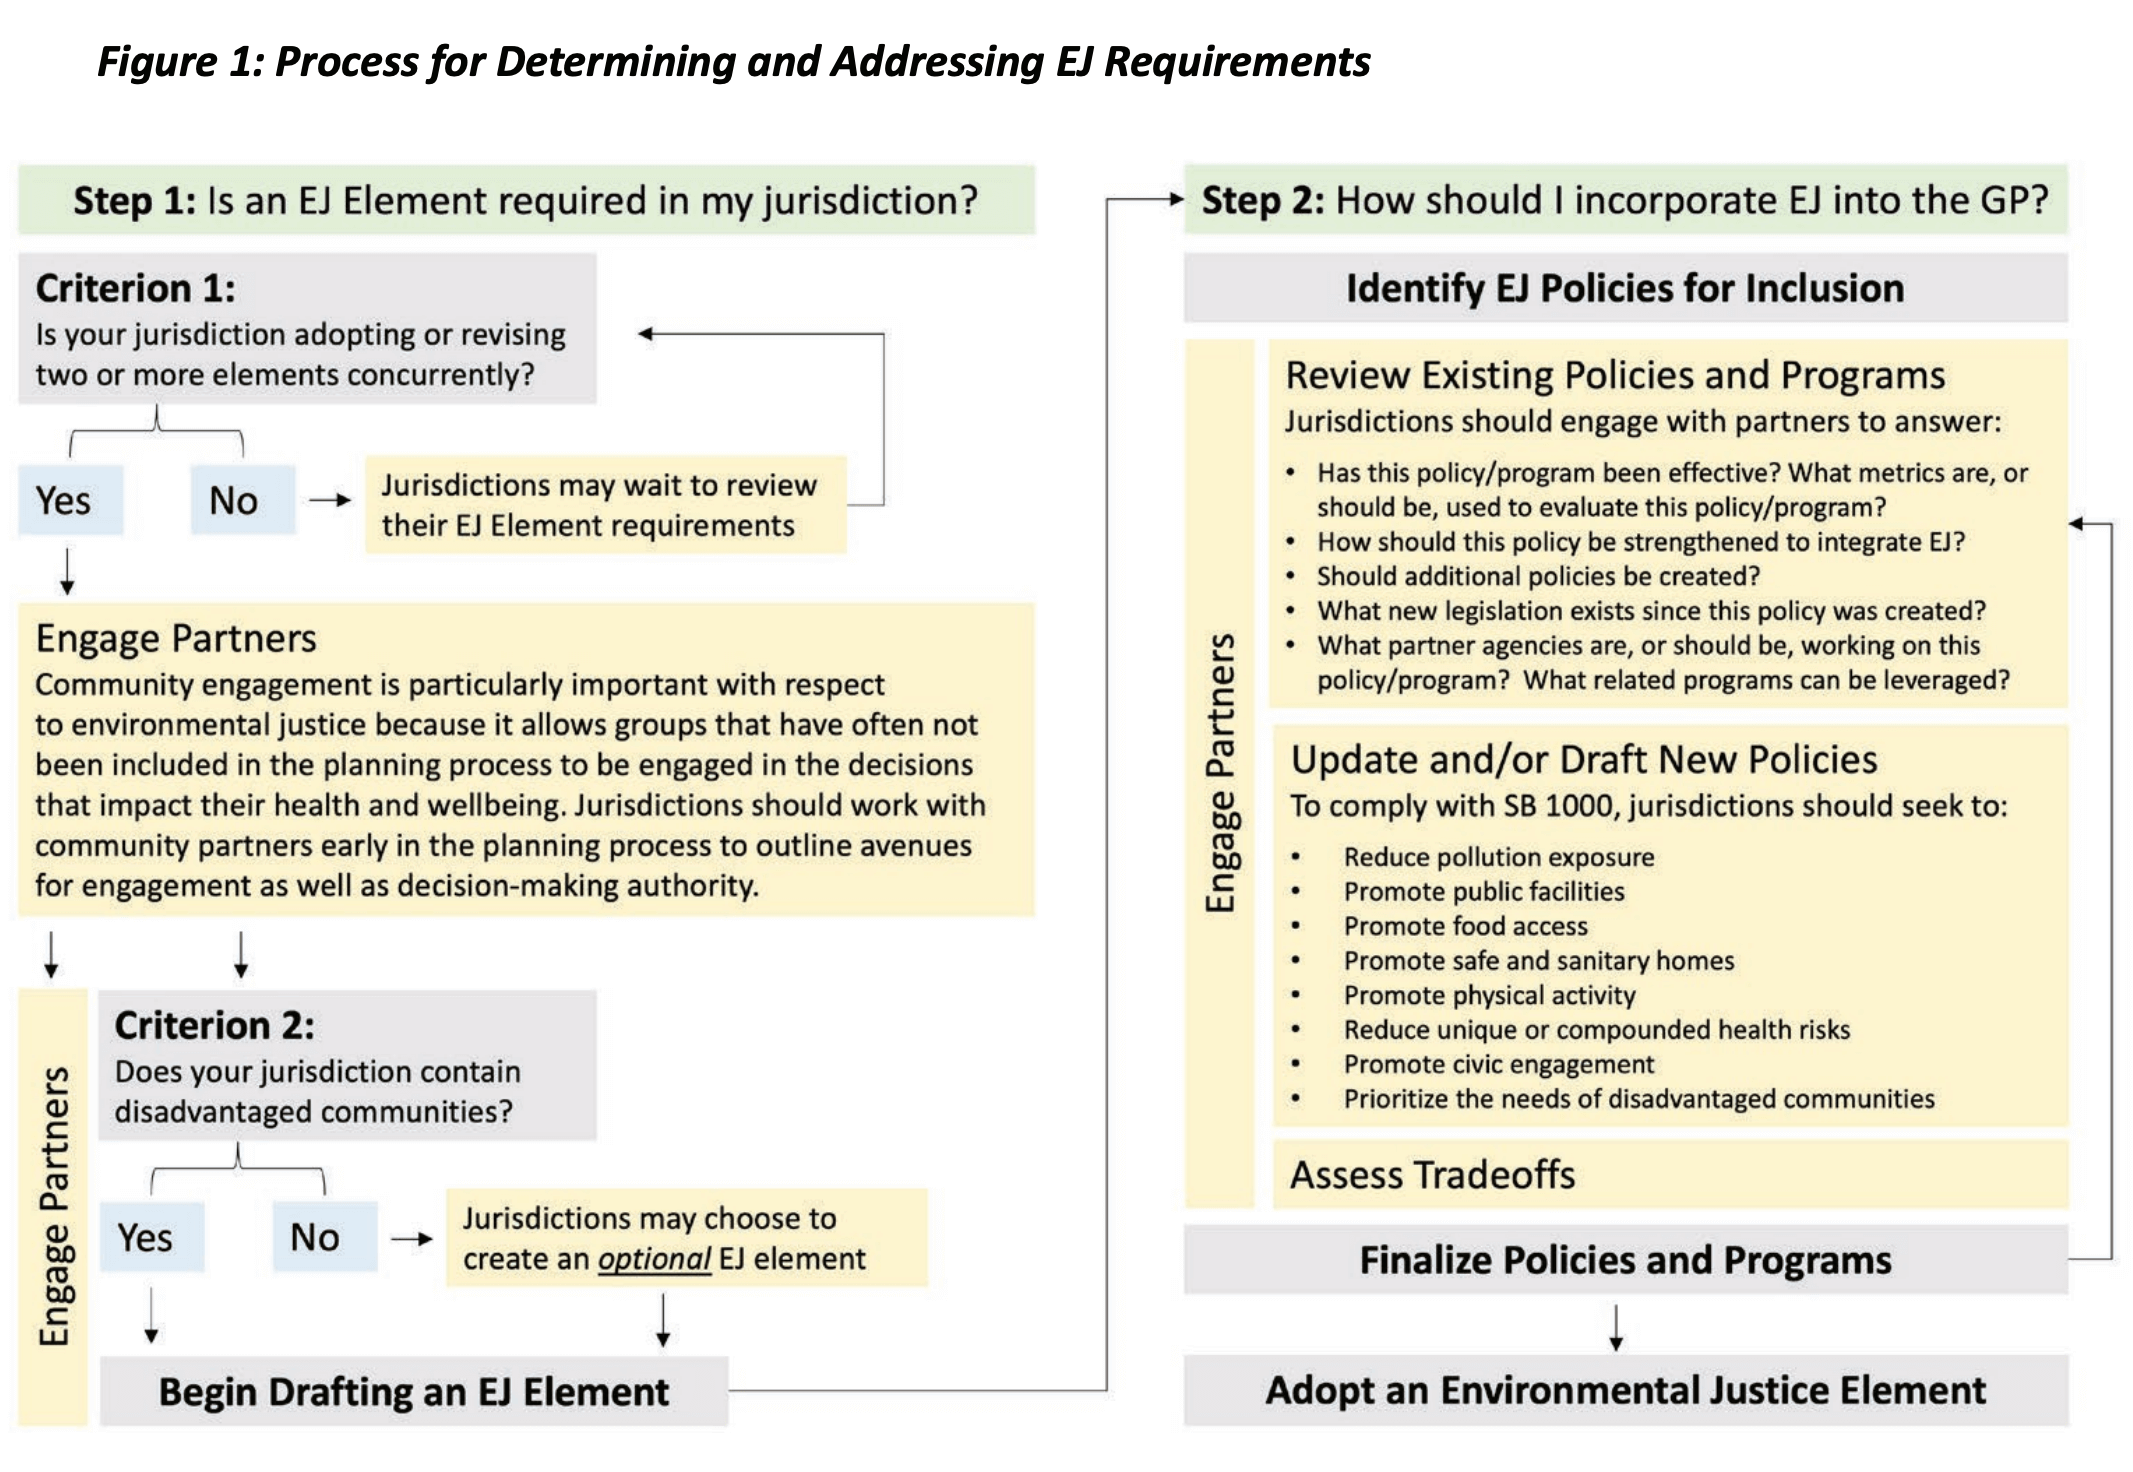
As guidance from the California Office of Planning & Research (OPR) notes, under SB 1000, cities and counties in California with “disadvantaged communities” are required to adopt an environmental justice element into their general plan that seeks to:
- Reduce pollution exposure
- Promote public facilities
- Promote food access
- Promote safe and sanitary homes
- Promote physical activity
- Reduce unique or compounded health risks
- Promote civic engagement
- Prioritize the needs of disadvantaged communities
As we can see in a snapshot from OPR’s General Plan Guidelines below, a key initial step for planners in the process of incorporating environmental justice and equity considerations for disadvantaged communities is identifying if and where those communities exist in the planning area, and what particular issues they face.
In this post, we’ll share how UrbanFootprint’s new “Environmental Justice Disadvantaged Communities Analysis” data layer can help planners with this foundational step in bringing environmental justice and equity to the planning process.
What methodology does SB 1000 suggest for identifying disadvantaged communities?
As shared in its General Plan Guidelines, the Office of Policy & Research (OPR) recommends evaluating the following criteria to identify disadvantaged communities:
- CalEnviroScreen: Examine if any part of the general plan catchment planning area has a CalEnviroScreen Score that falls in the top 25th percentile (most disadvantaged) of all tracts across California.
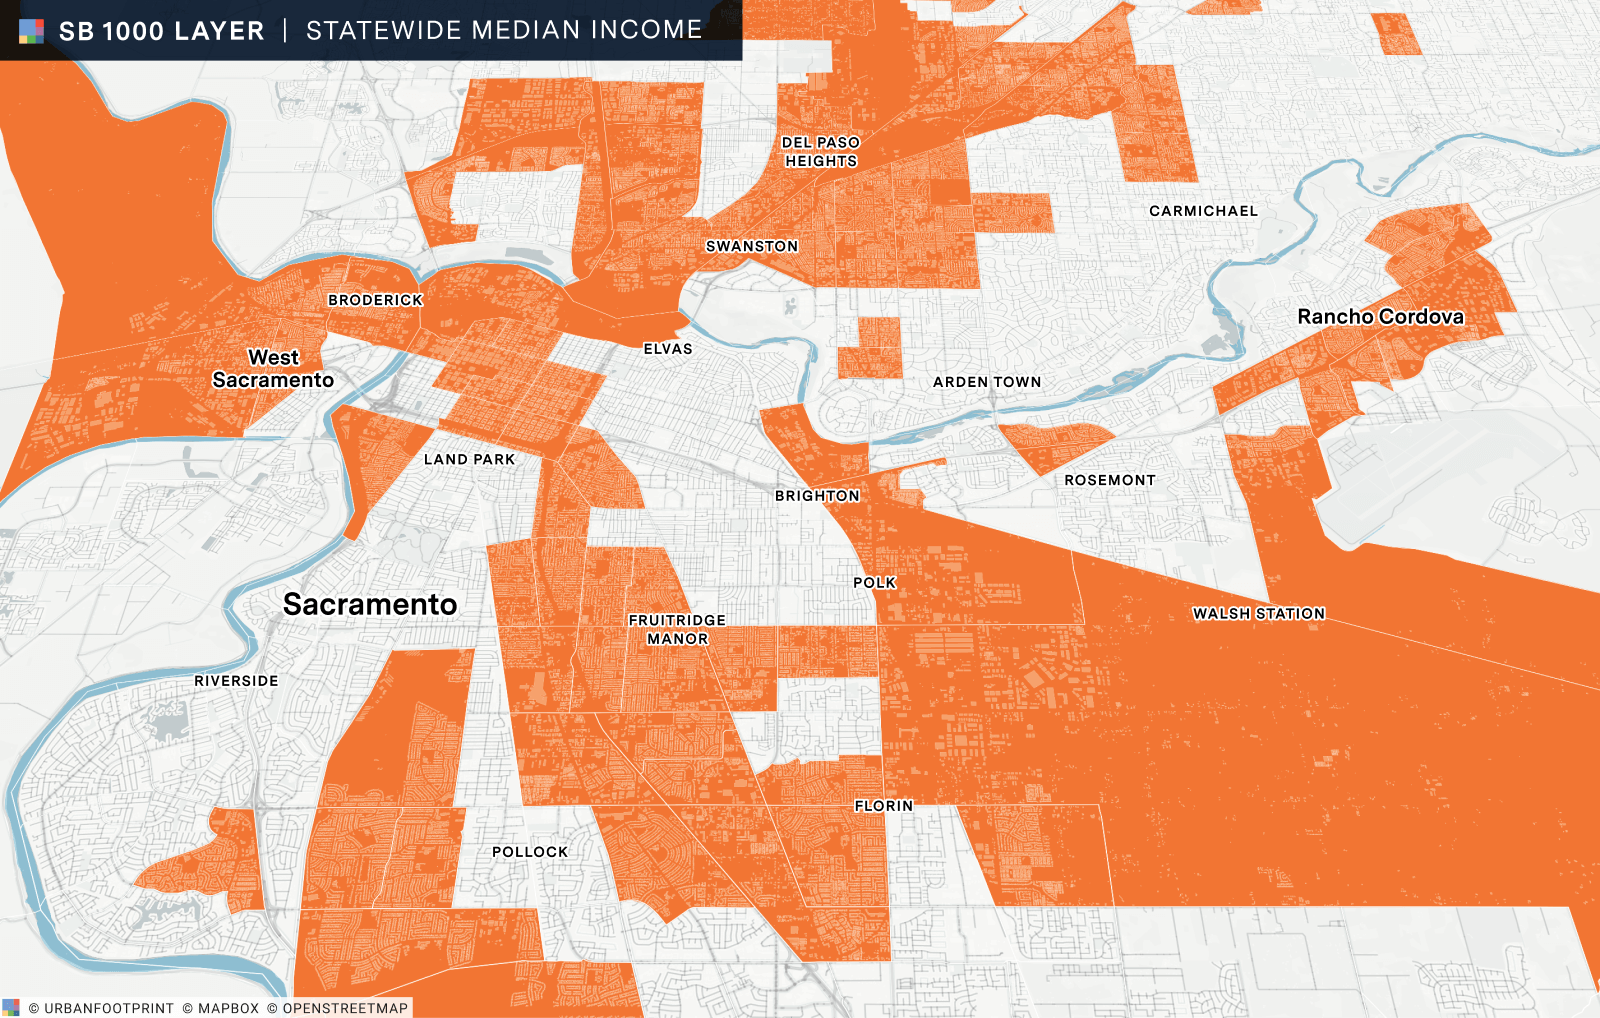
- Statewide Median Income: Map household median income by census tract at or below 80% of the statewide median income in the planning area and examine for disproportionate pollution burden.
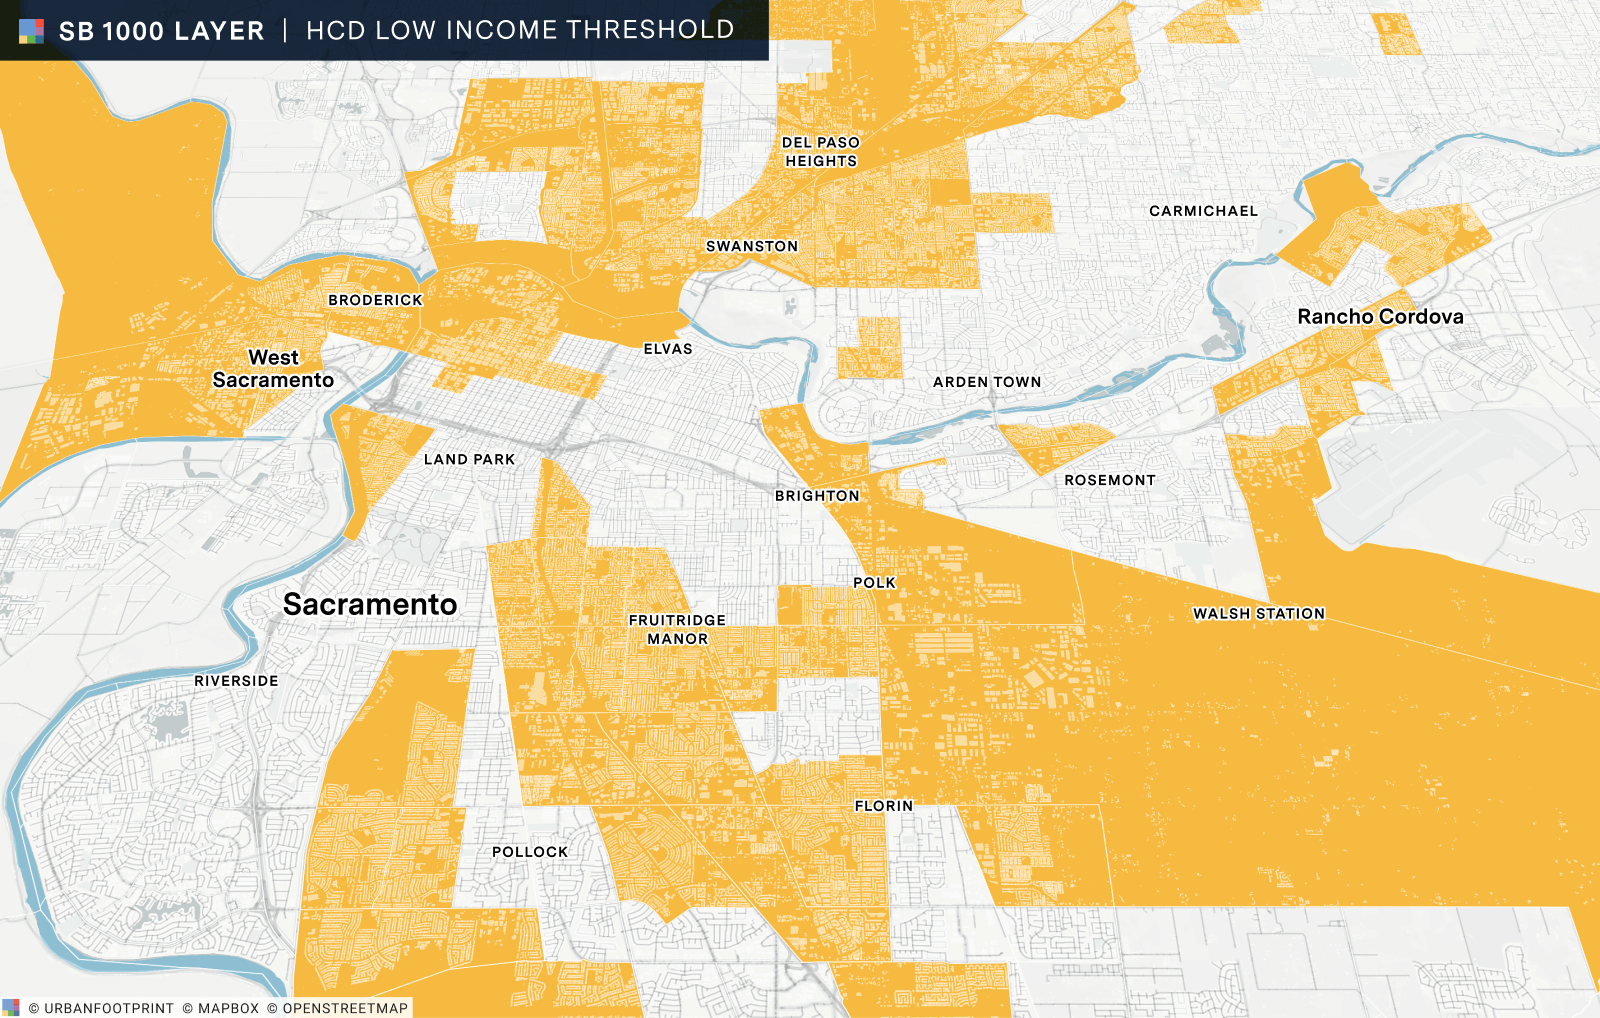
- HCD Low Income Threshold: Map household median income by census tract at or below the Department of Housing and Community Development’s (HCD) low income threshold for each tract in the planning area and examine for disproportionate pollution burden.
The OPR guidance notes that cities are given the discretion as to which definition of disadvantaged community to use for their general plan process. That said, they recommend evaluating all three definitions and checking with other local and regional agencies to ensure no communities are omitted. They also encourage cities to use more refined local data where available to enhance the process.
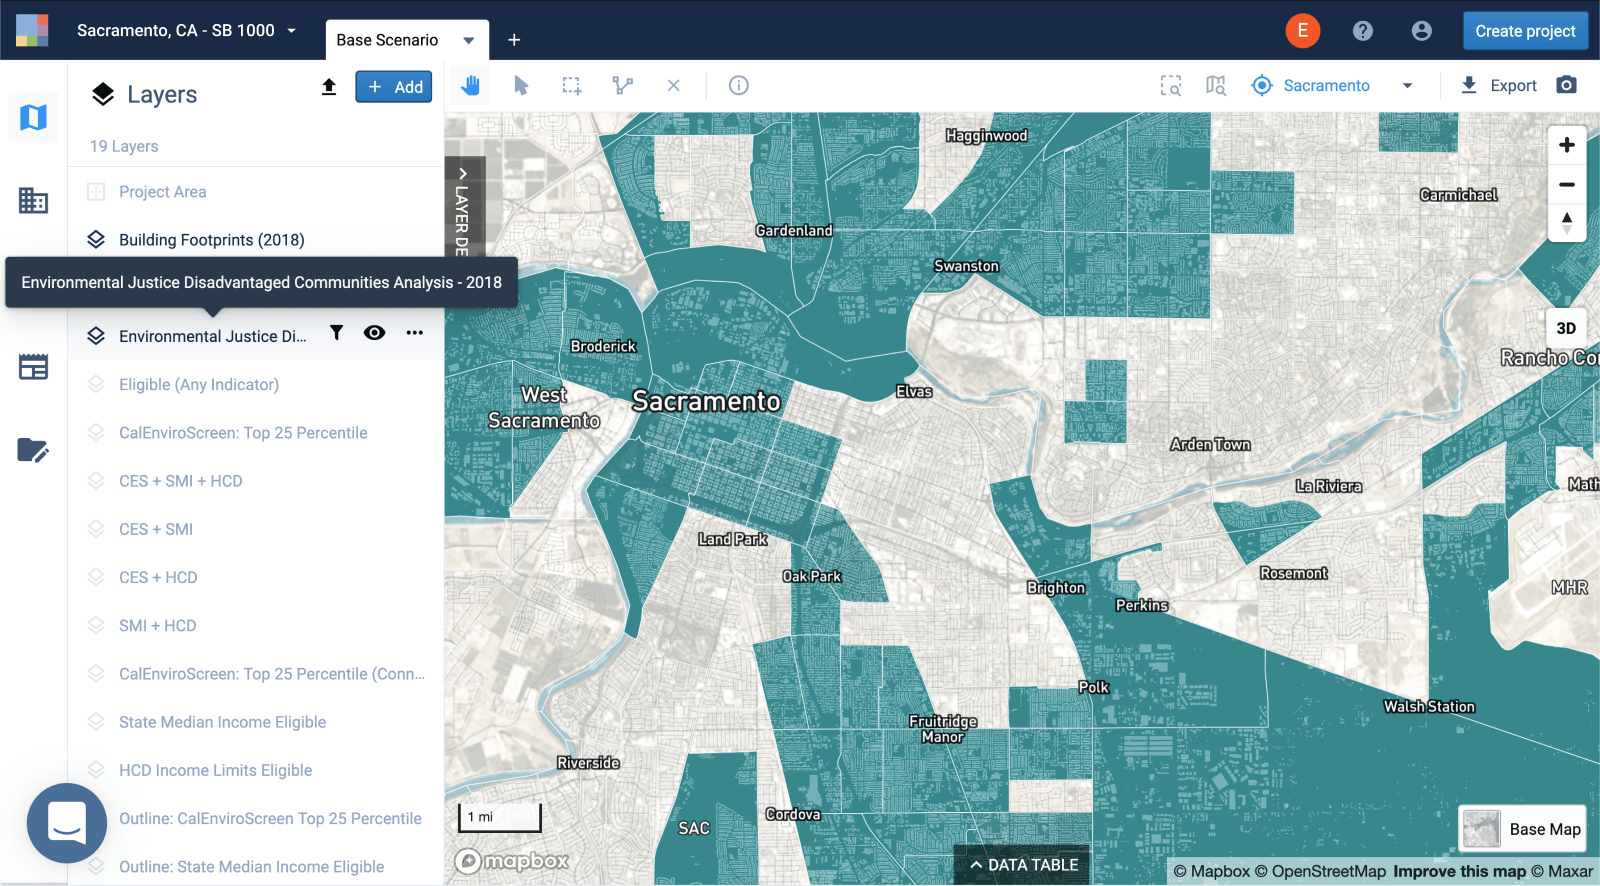
Here’s how planners can map the first step of SB 1000 compliance with UrbanFootprint’s “Environmental Justice Disadvantaged Communities Analysis” data layer.
To facilitate this preliminary screening process, UrbanFootprint’s Data Science Team developed a spatial dataset, “Environmental Justice Disadvantaged Communities Analysis,” that identifies tracts across the state where communities are identified as disadvantaged given the above three criteria. This new UrbanFootprint layer assesses data for the year 2018, the most recent year for which datasets for all required inputs are available.
This screening process relies on three different data sources, all of which share the same vintage of data (to ensure appropriate comparisons in any analysis):
- Census American Community Survey (ACS) 2014–2018 5-year Estimates
- CalEnviroScreen 3.0, last updated in June of 2018
- California State Income Limits (2018)
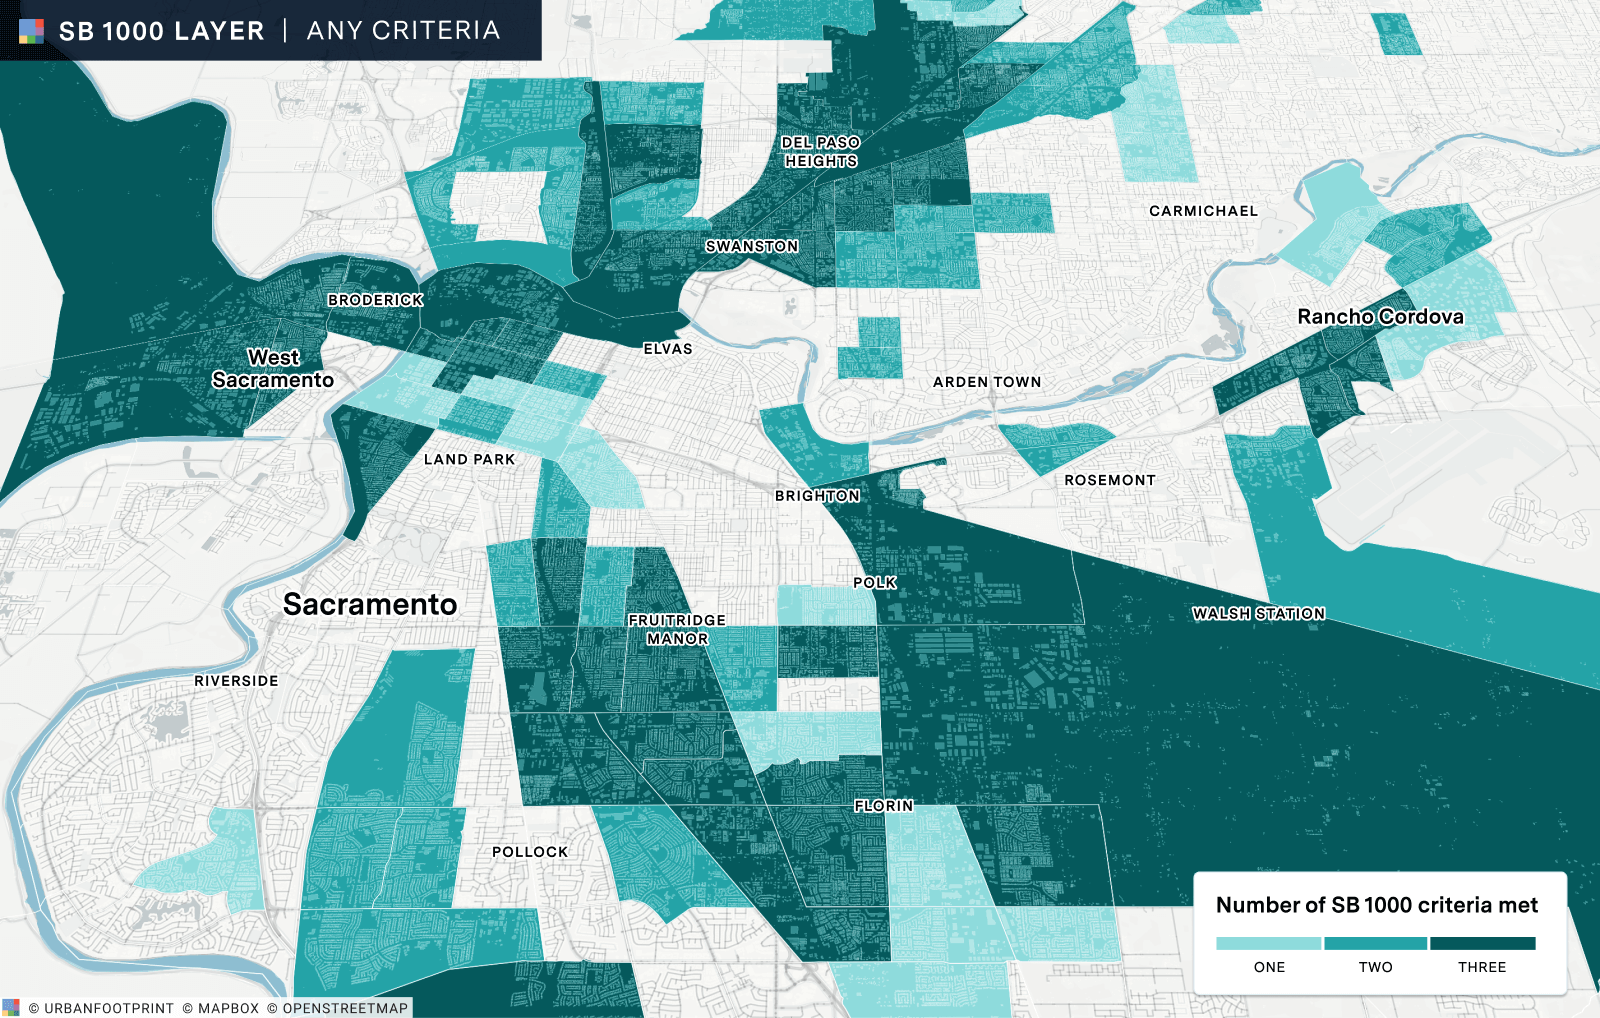
As OPR’s guidance recommends evaluating the three criteria mentioned above, UrbanFootprint provides the result of each disadvantaged community definition as a separate mappable column to make it easy to see variation across the different definitions. The output layer also includes an ‘Any Indicator’ column that denotes census tracts that are identified as disadvantaged based on any of the three definitions. These outputs are displayed alongside all input variables used as a part of this process for transparency.
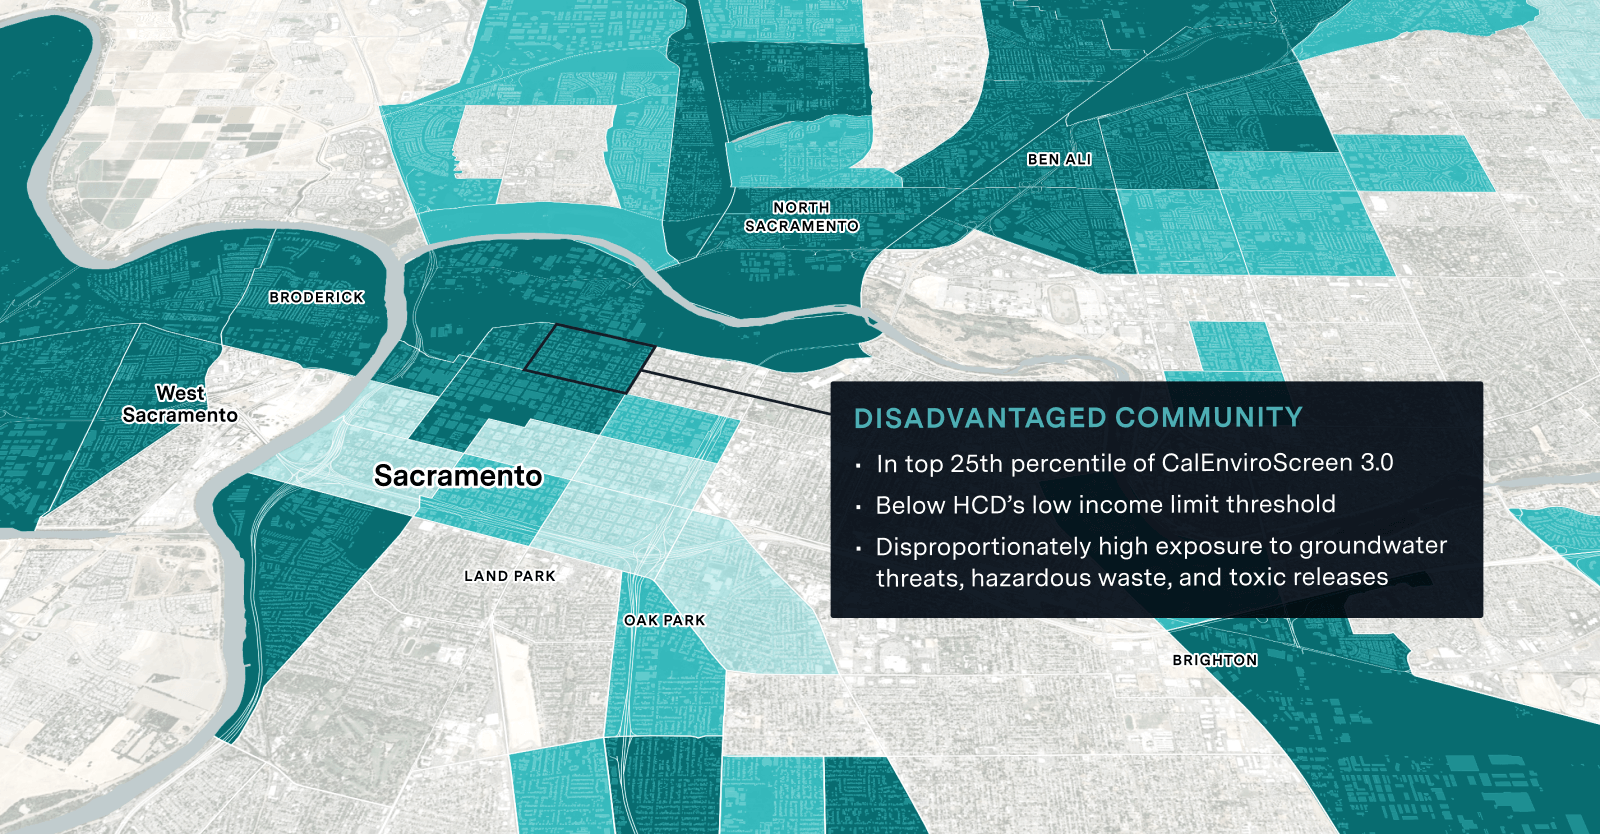
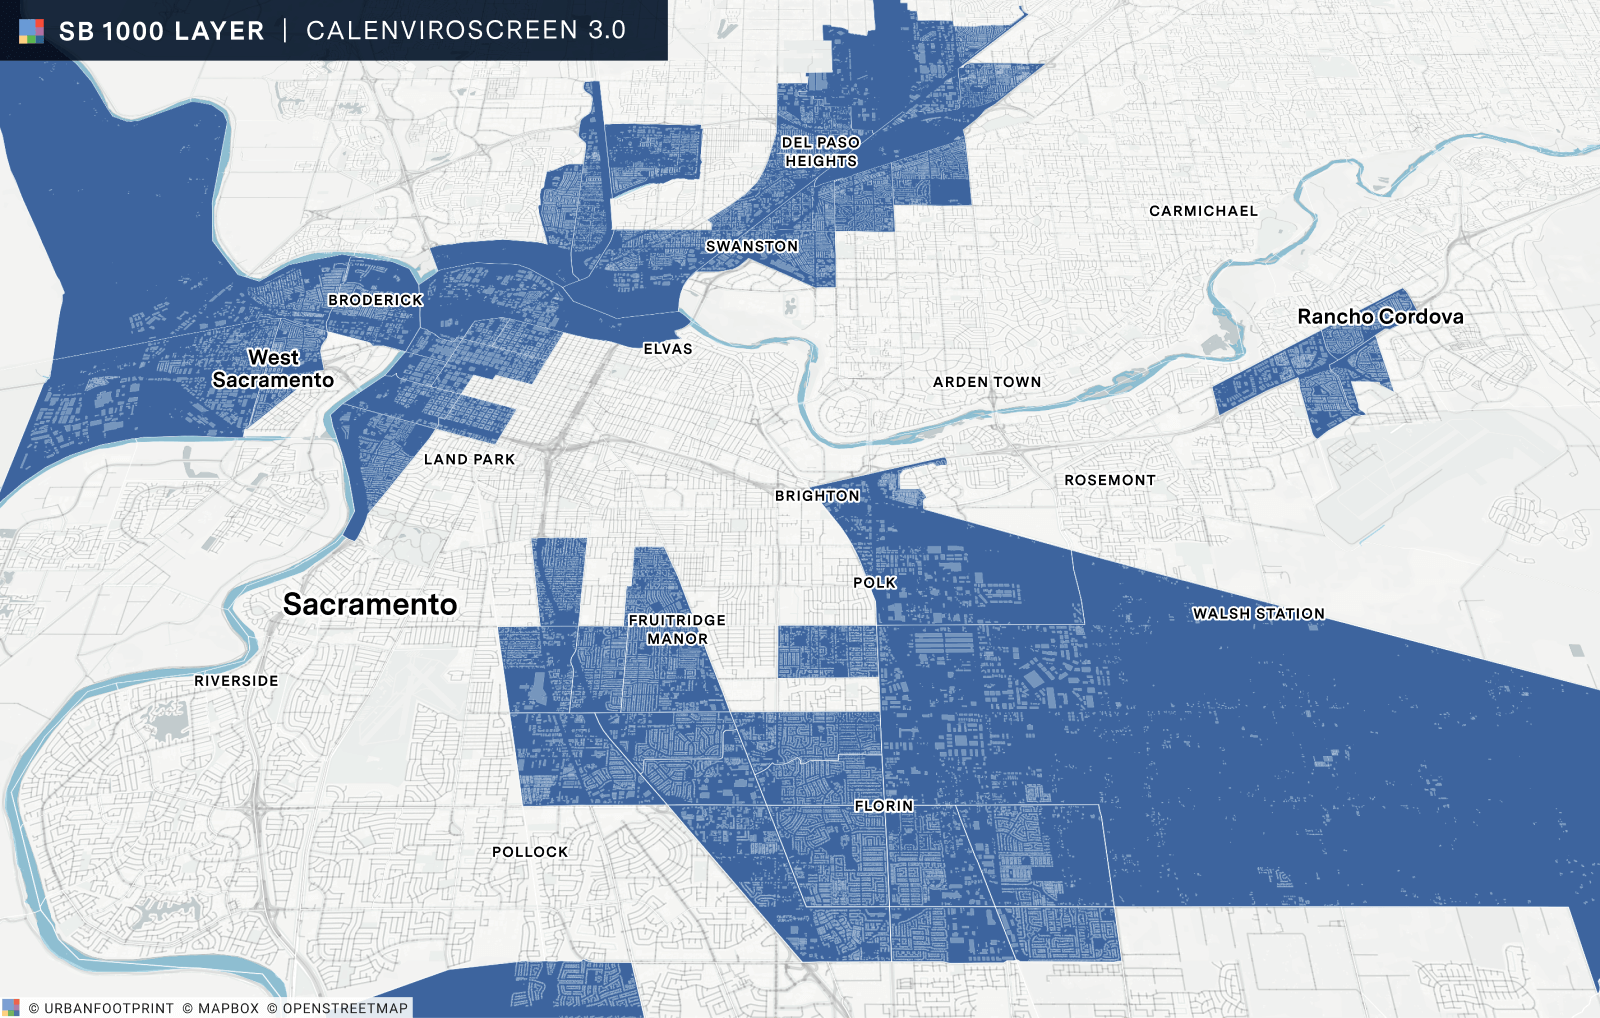
Here are a few examples of the “Environmental Justice Disadvantaged Communities Analysis” layer mapped in Sacramento, California.
Filtering CalEnviroScreen to census tracts in the highest 25th percentile
Mapping household median income by census tract at or below 80% of the statewide median income
Mapping household median income by census tract at or below the Department of Housing and Community Development’s (HCD) low income threshold
Mapping areas that meet any of OPR’s three criteria for defining disadvantaged communities

Our new, preloaded layer in UrbanFootprint provides California planners with the data foundation they need to map and assess disadvantaged communities—an important first step toward incorporating and prioritizing environmental justice and equity considerations in the general plan process.
Have a question? Let us know how we can help. We’d love to hear from you.
