


By now we are painfully aware that the US is well behind other advanced nations in stemming the spread of COVID-19. With response relegated to states, and the resulting patchwork of interventions and policies deployed across the country, the ability to understand where this disease is going to spike next is critical to limiting transmission and protecting the most vulnerable. This is particularly important as schools reopen and as Americans spend more time indoors during the fall and winter.
By combining data about disease, economic activity and socio-demographics, we can track where COVID-19 is most likely to spread next and where the most vulnerable are located within these likely hotspots. What emerges is a “COVID-19 Watch List,” a highly dynamic view of COVID-19 susceptibility that can be used by governments, health agencies, and relief providers to better understand the spread of the virus in real time and help geotarget resources that reduce transmission risk, improve public health outcomes and protect the most vulnerable at the state, county and city level.
The ‘COVID Watch List’ combines 3 important elements:
- Fever and Case Data: Deploy Kinsa’s aggregate illness data from smart thermometers to identify where COVID-19 activity is likely to trend upward.
- Movement Data: Use movement data to identify areas that are at even higher risk of accelerated COVID-19 transmission over the next several weeks.
- Social Vulnerability, Economic Stress, Accessibility and Health Risk Data: Using a variety of risk factors, identify specific geographic areas that may be particularly vulnerable to COVID-19 and its associated economic and social impacts.
We urge government and health agencies to use these indicators to better prepare and respond to new outbreaks.
Tracking Fever and Case Data to Prepare for Surges
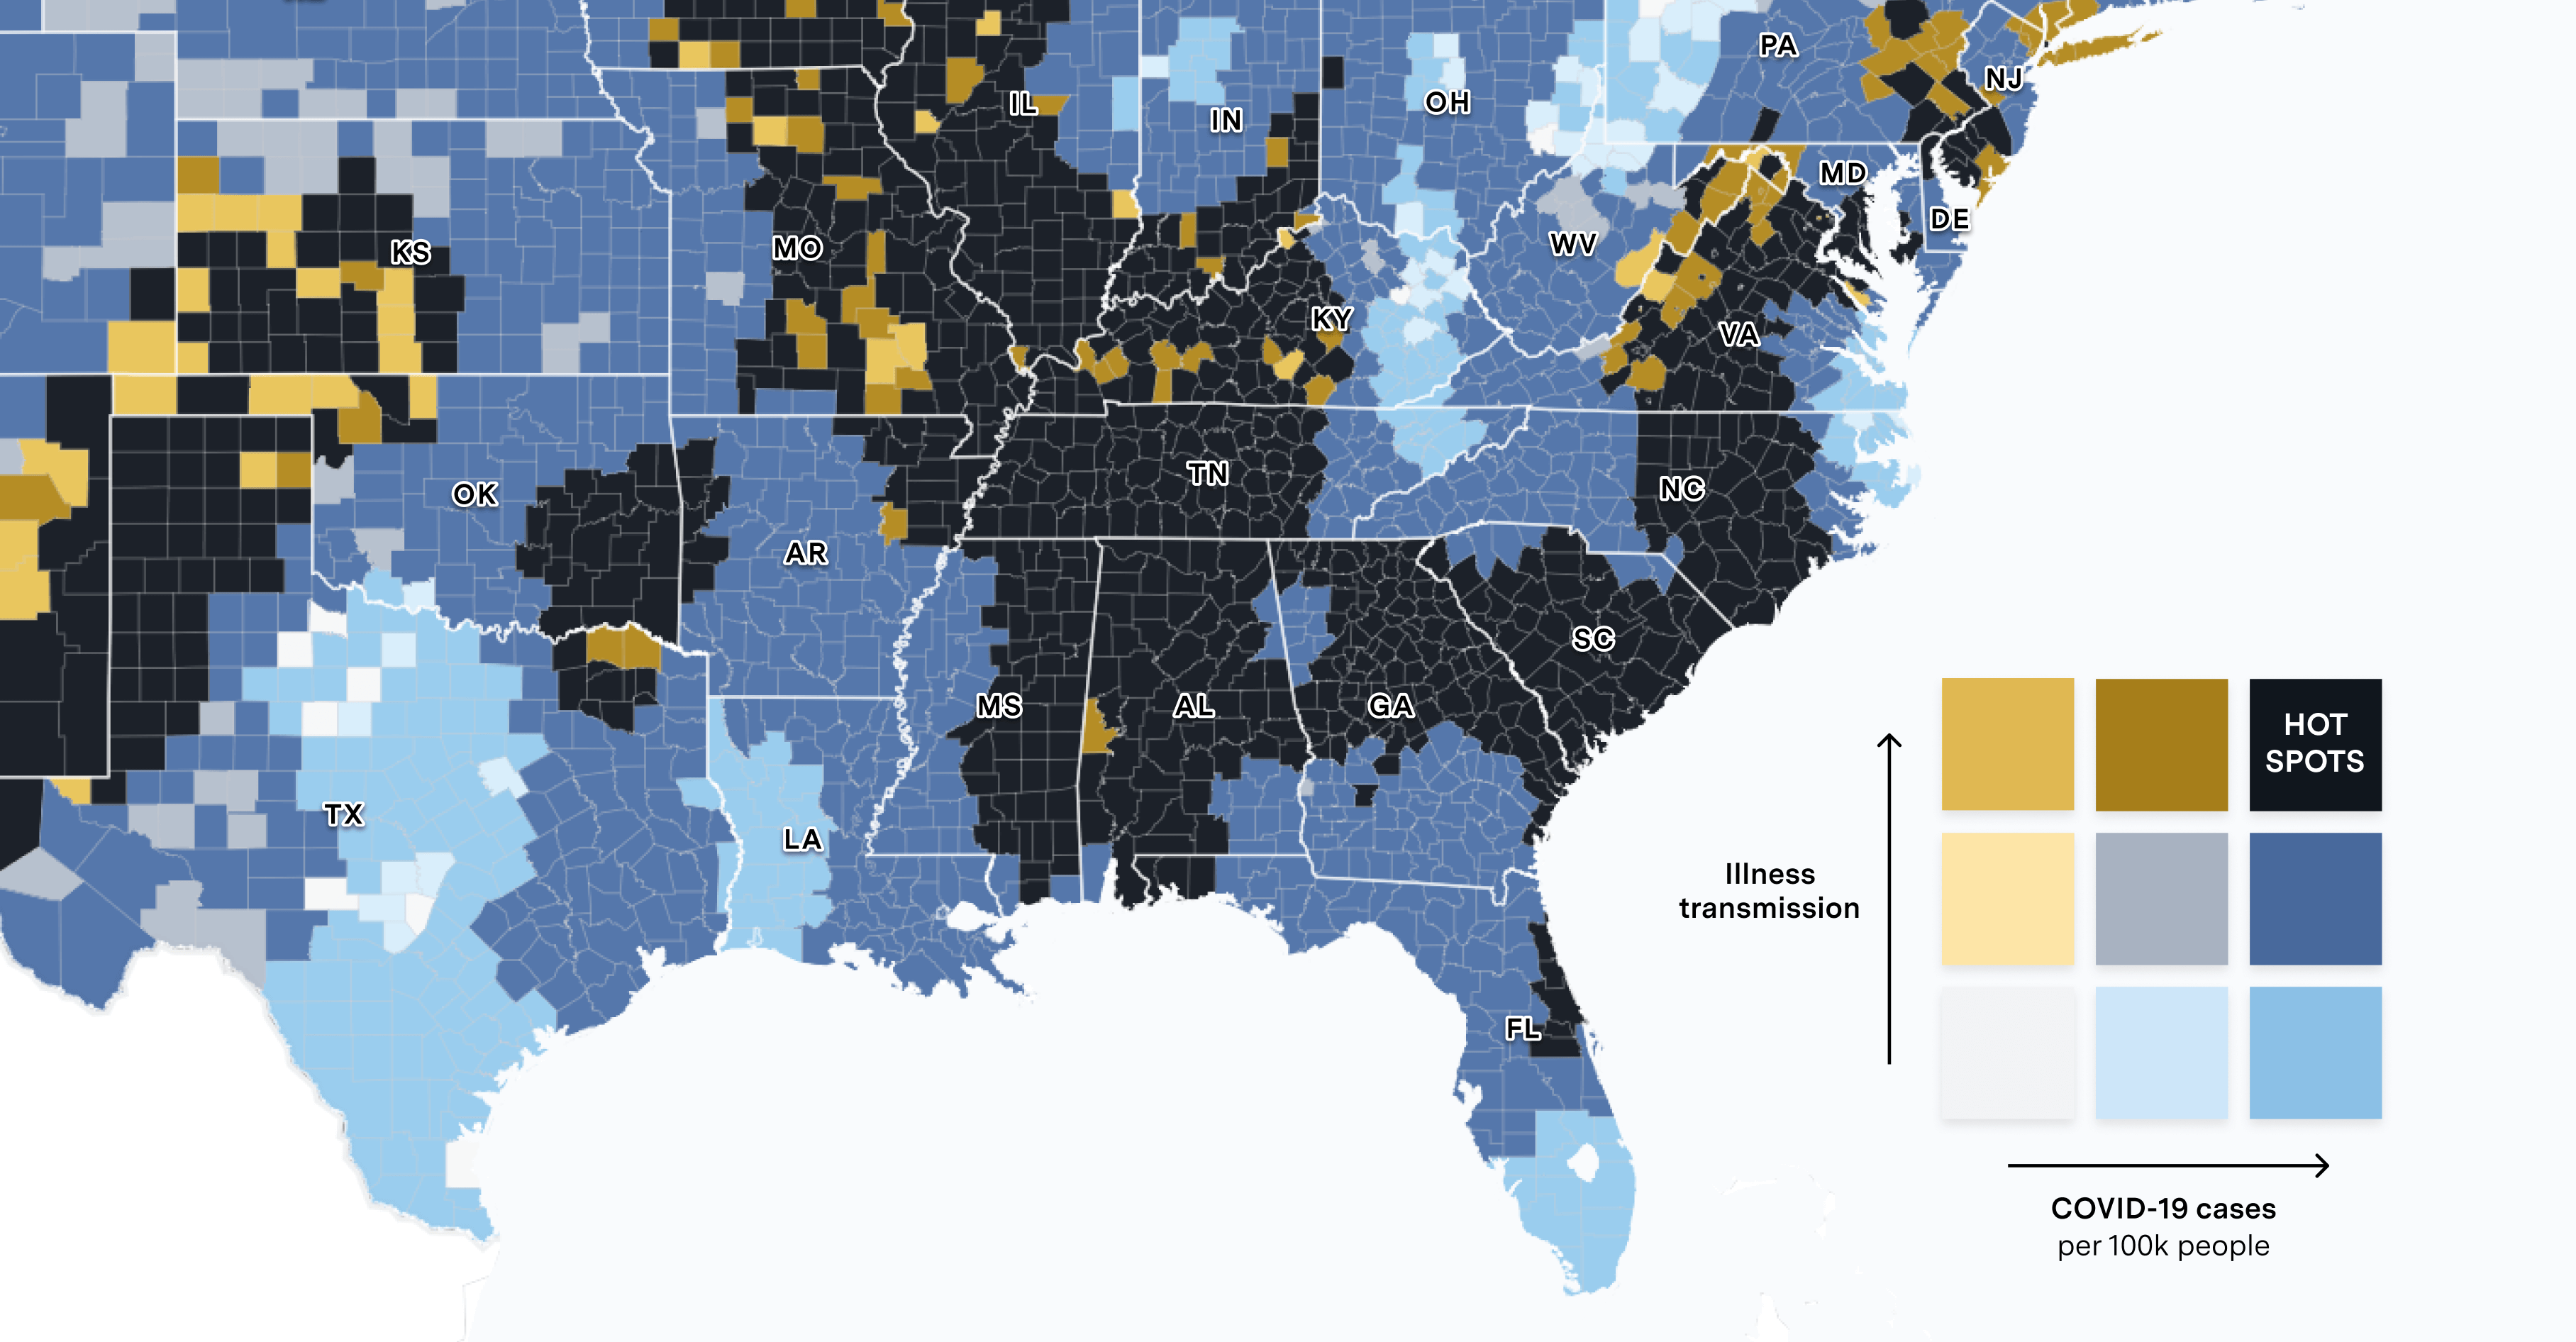
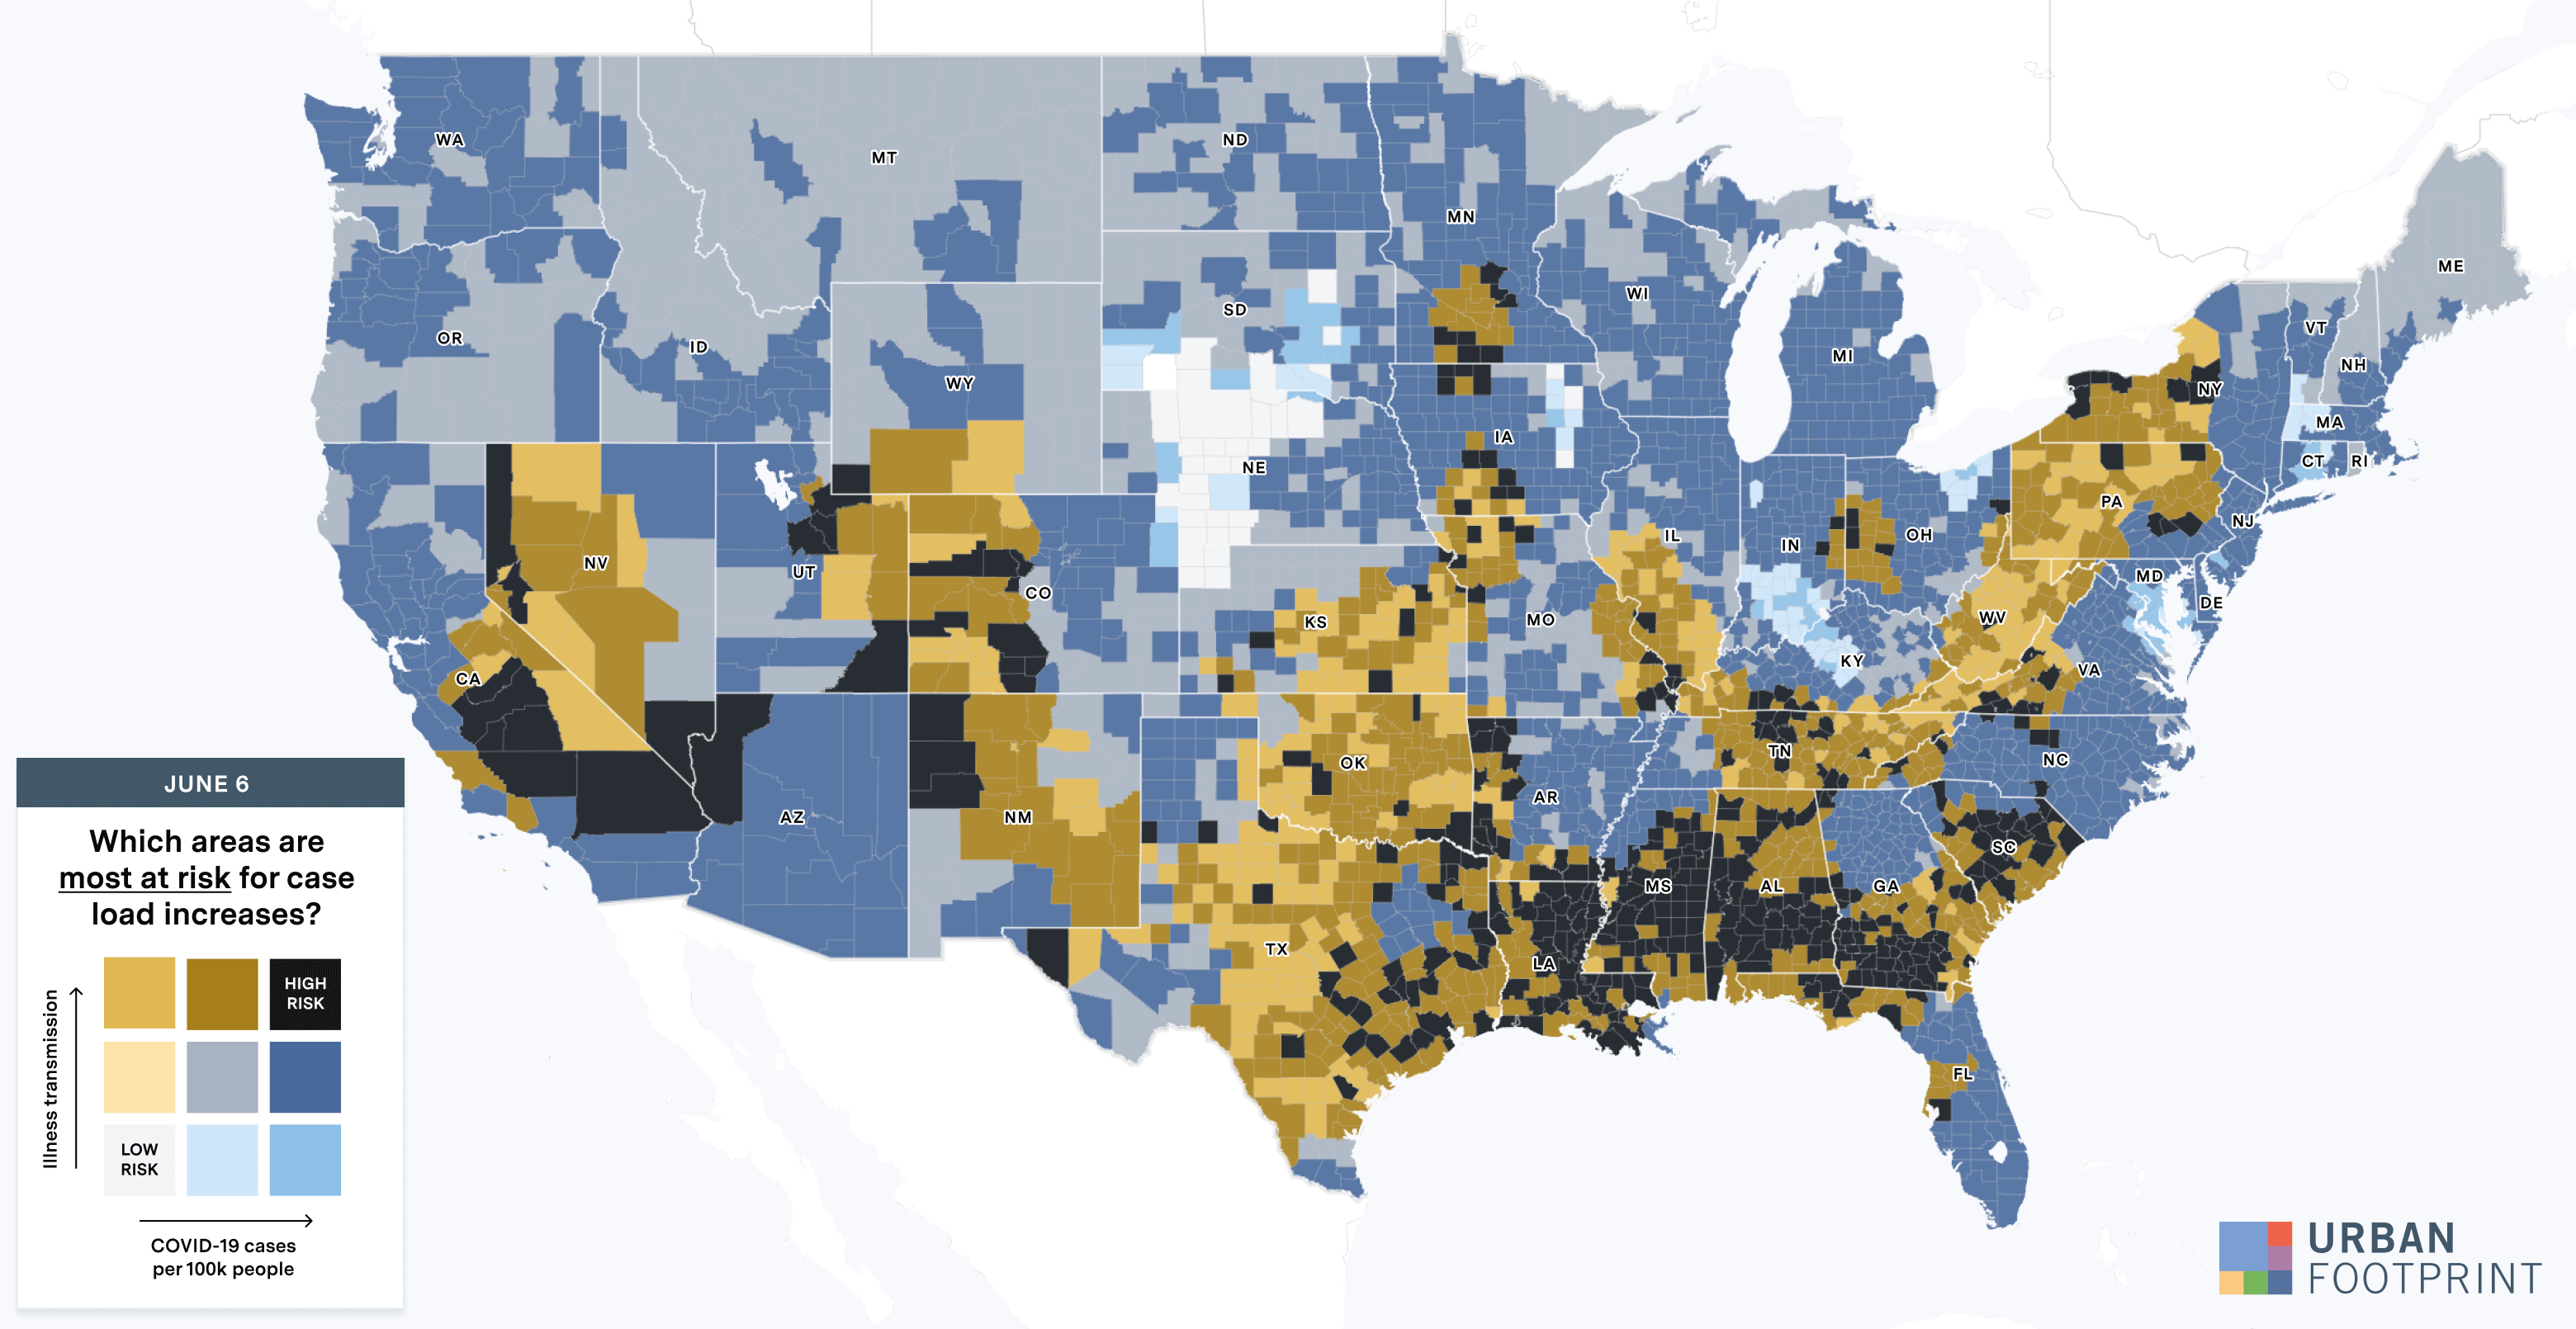
By evaluating fever and symptom trends, along with per capita case rates, we can assess which states are likely to see rises in case load and where within those states the risk may be highest. Using fever, symptom, and illness transmission data from smart thermometer maker Kinsa, we can see both where the rate of illness transmission has been highest over the past few weeks and the states that are most at risk of case load increases in the next two to three weeks.
Looking back, fever data and per capita case loads indicated that states in the South and West were at risk of increases—a reality we’ve seen play out since.
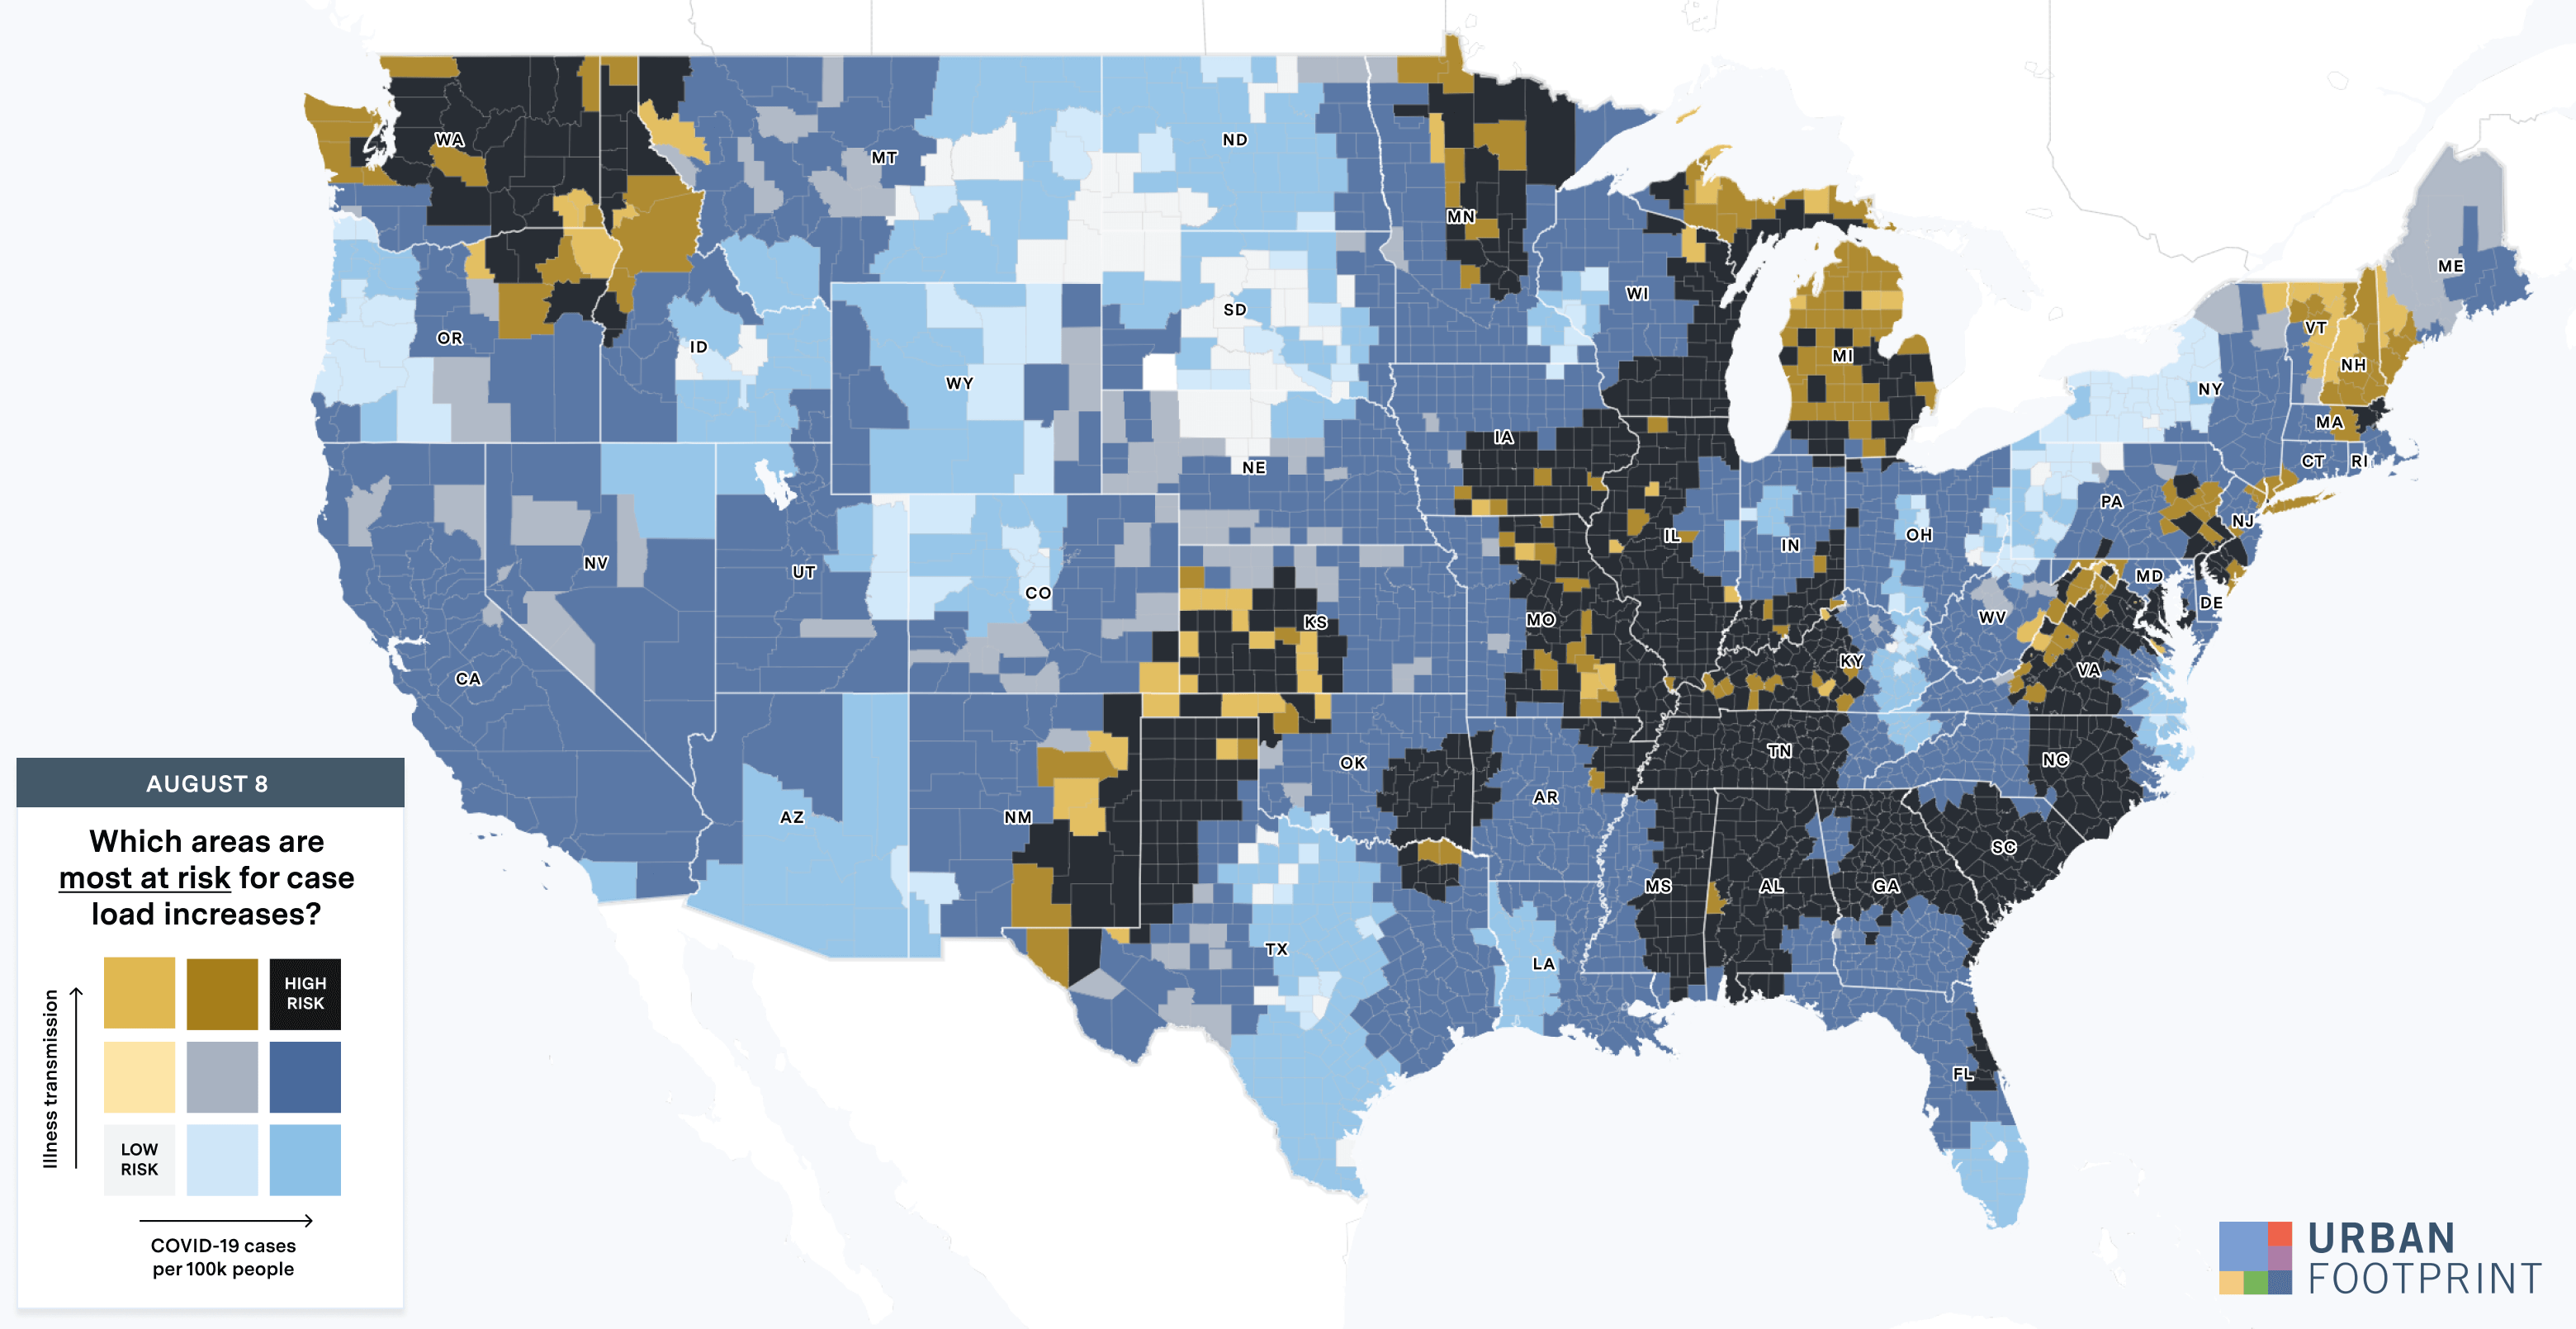
Looking ahead, Kinsa’s data indicate that public health measures are likely reducing risk in many hot spots, while Missouri, Washington, Illinois, Michigan, and parts of Texas are more likely to see case load increases. These states can prepare by deploying public health measures and evaluating medical and testing facilities to ensure there is enough capacity to handle demand.
Using Movement Data to Track Transmission Risk
Within states that are likely to see a rise in cases, movement data assembled from mobile devices can provide a more granular view of risk across counties and metropolitan areas. Higher and increasing levels of movement can accelerate risk by increasing the likelihood of person-to-person spread.
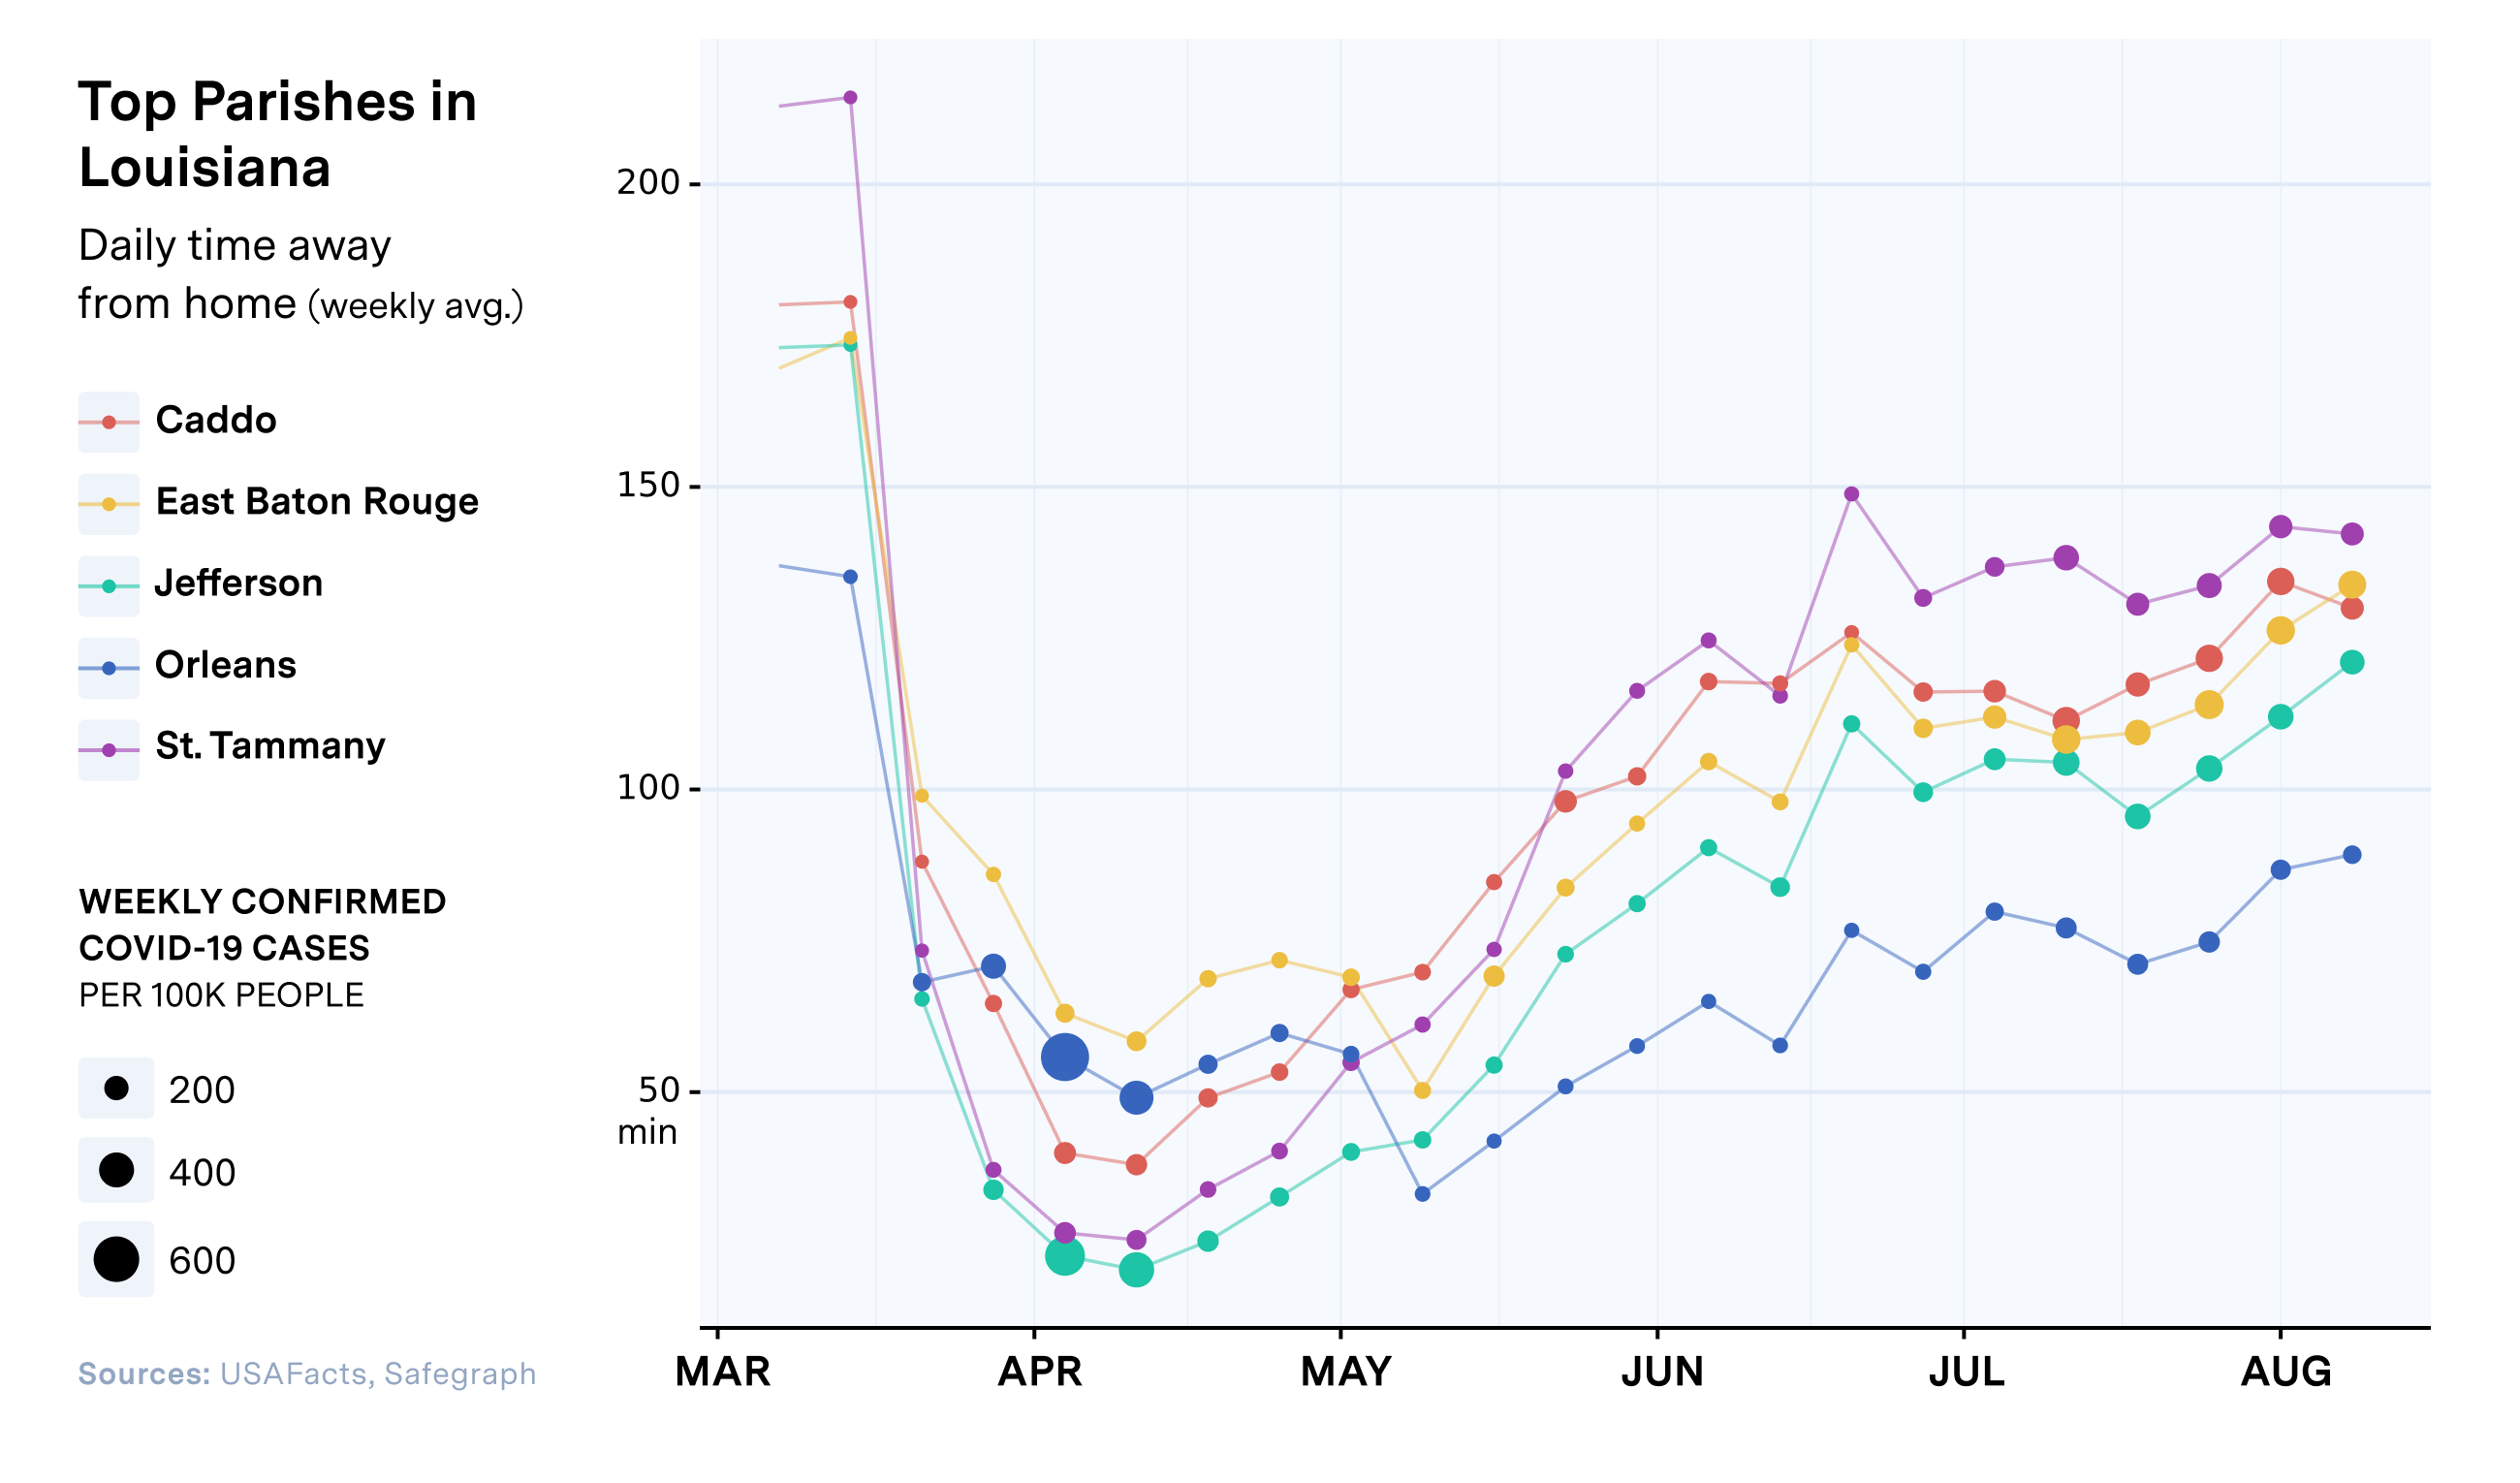
Digging into a sample of Southern states where caseloads rose substantially over the past several weeks—Louisiana, Georgia, South Carolina, and Tennessee—we can track the relationship between the time people spend outside of their homes and per capita COVID-19 infection rates.
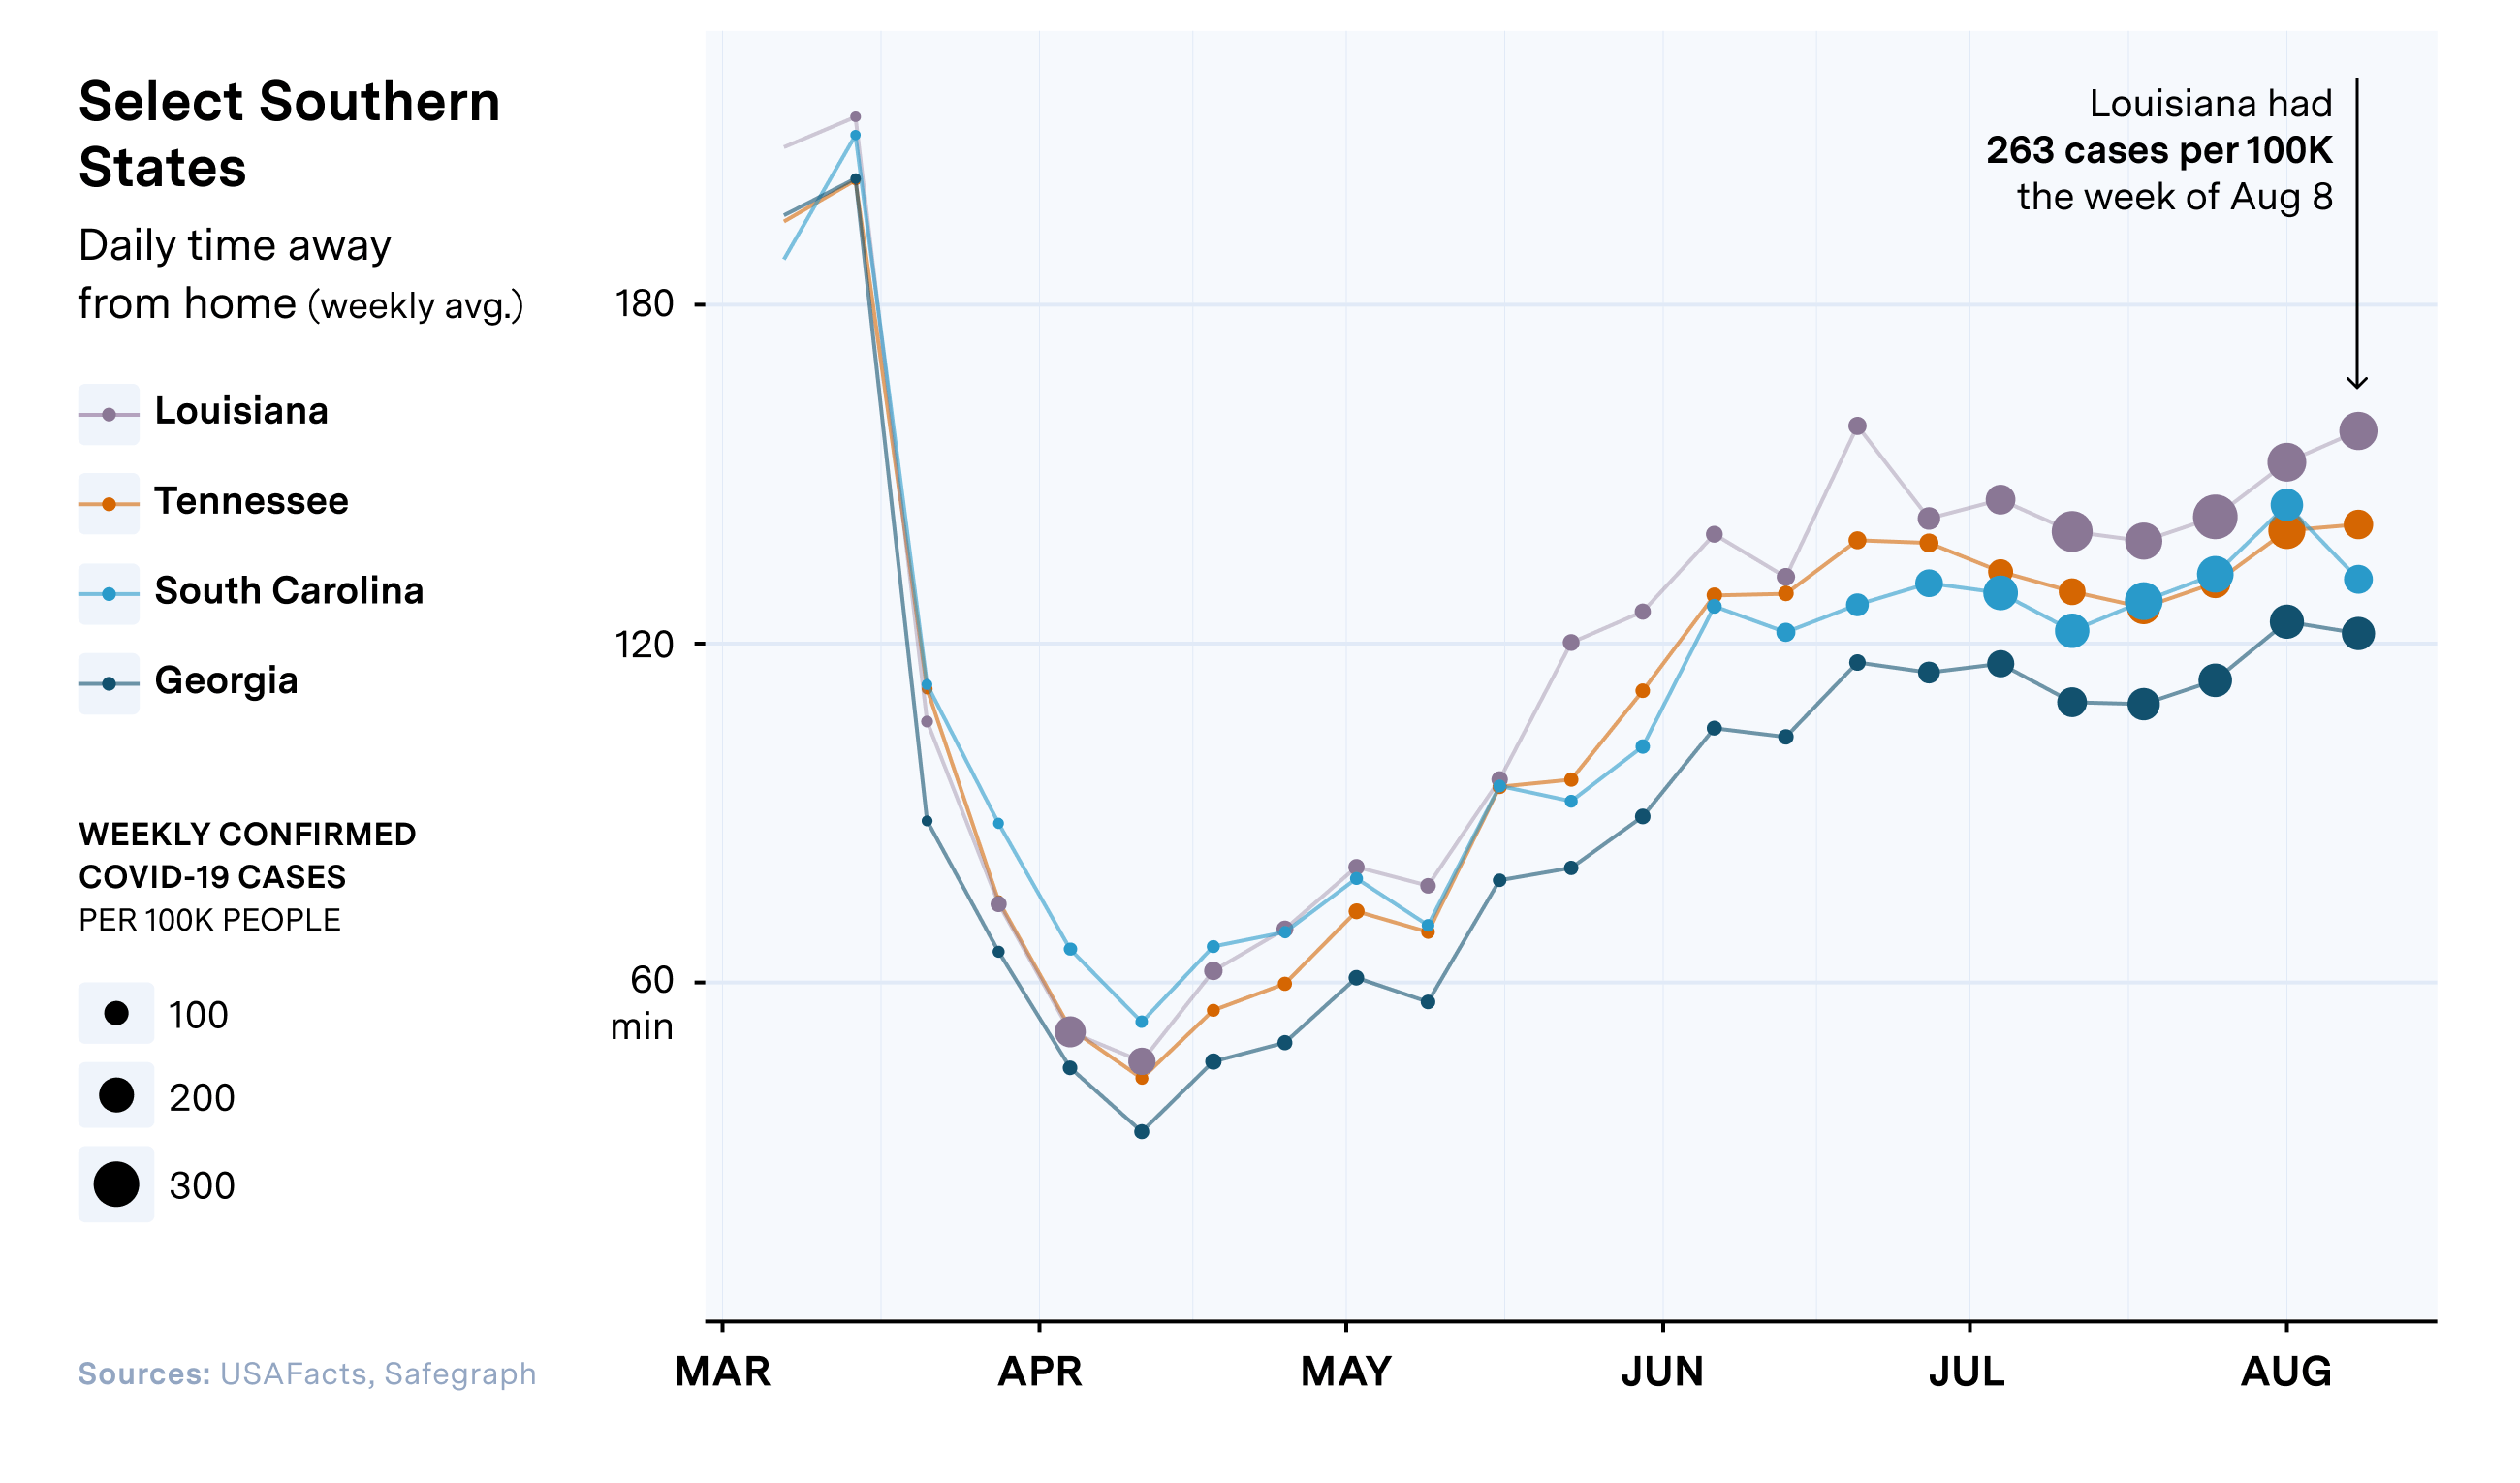
If we break down the data further, we can see the relationship across different counties and metro areas. New Orleans, which faced a very high case rate earlier in the pandemic, now has both lower levels of movement and lower case rates compared with other major metropolitan areas in Louisiana. This is likely due to more stringent public health measures and a population more likely to reduce activity and take precautionary measures.
Now, let’s evaluate transmission risk in states most at risk of caseload increases in the coming weeks: Missouri, Washington, Illinois, Michigan, and Texas.
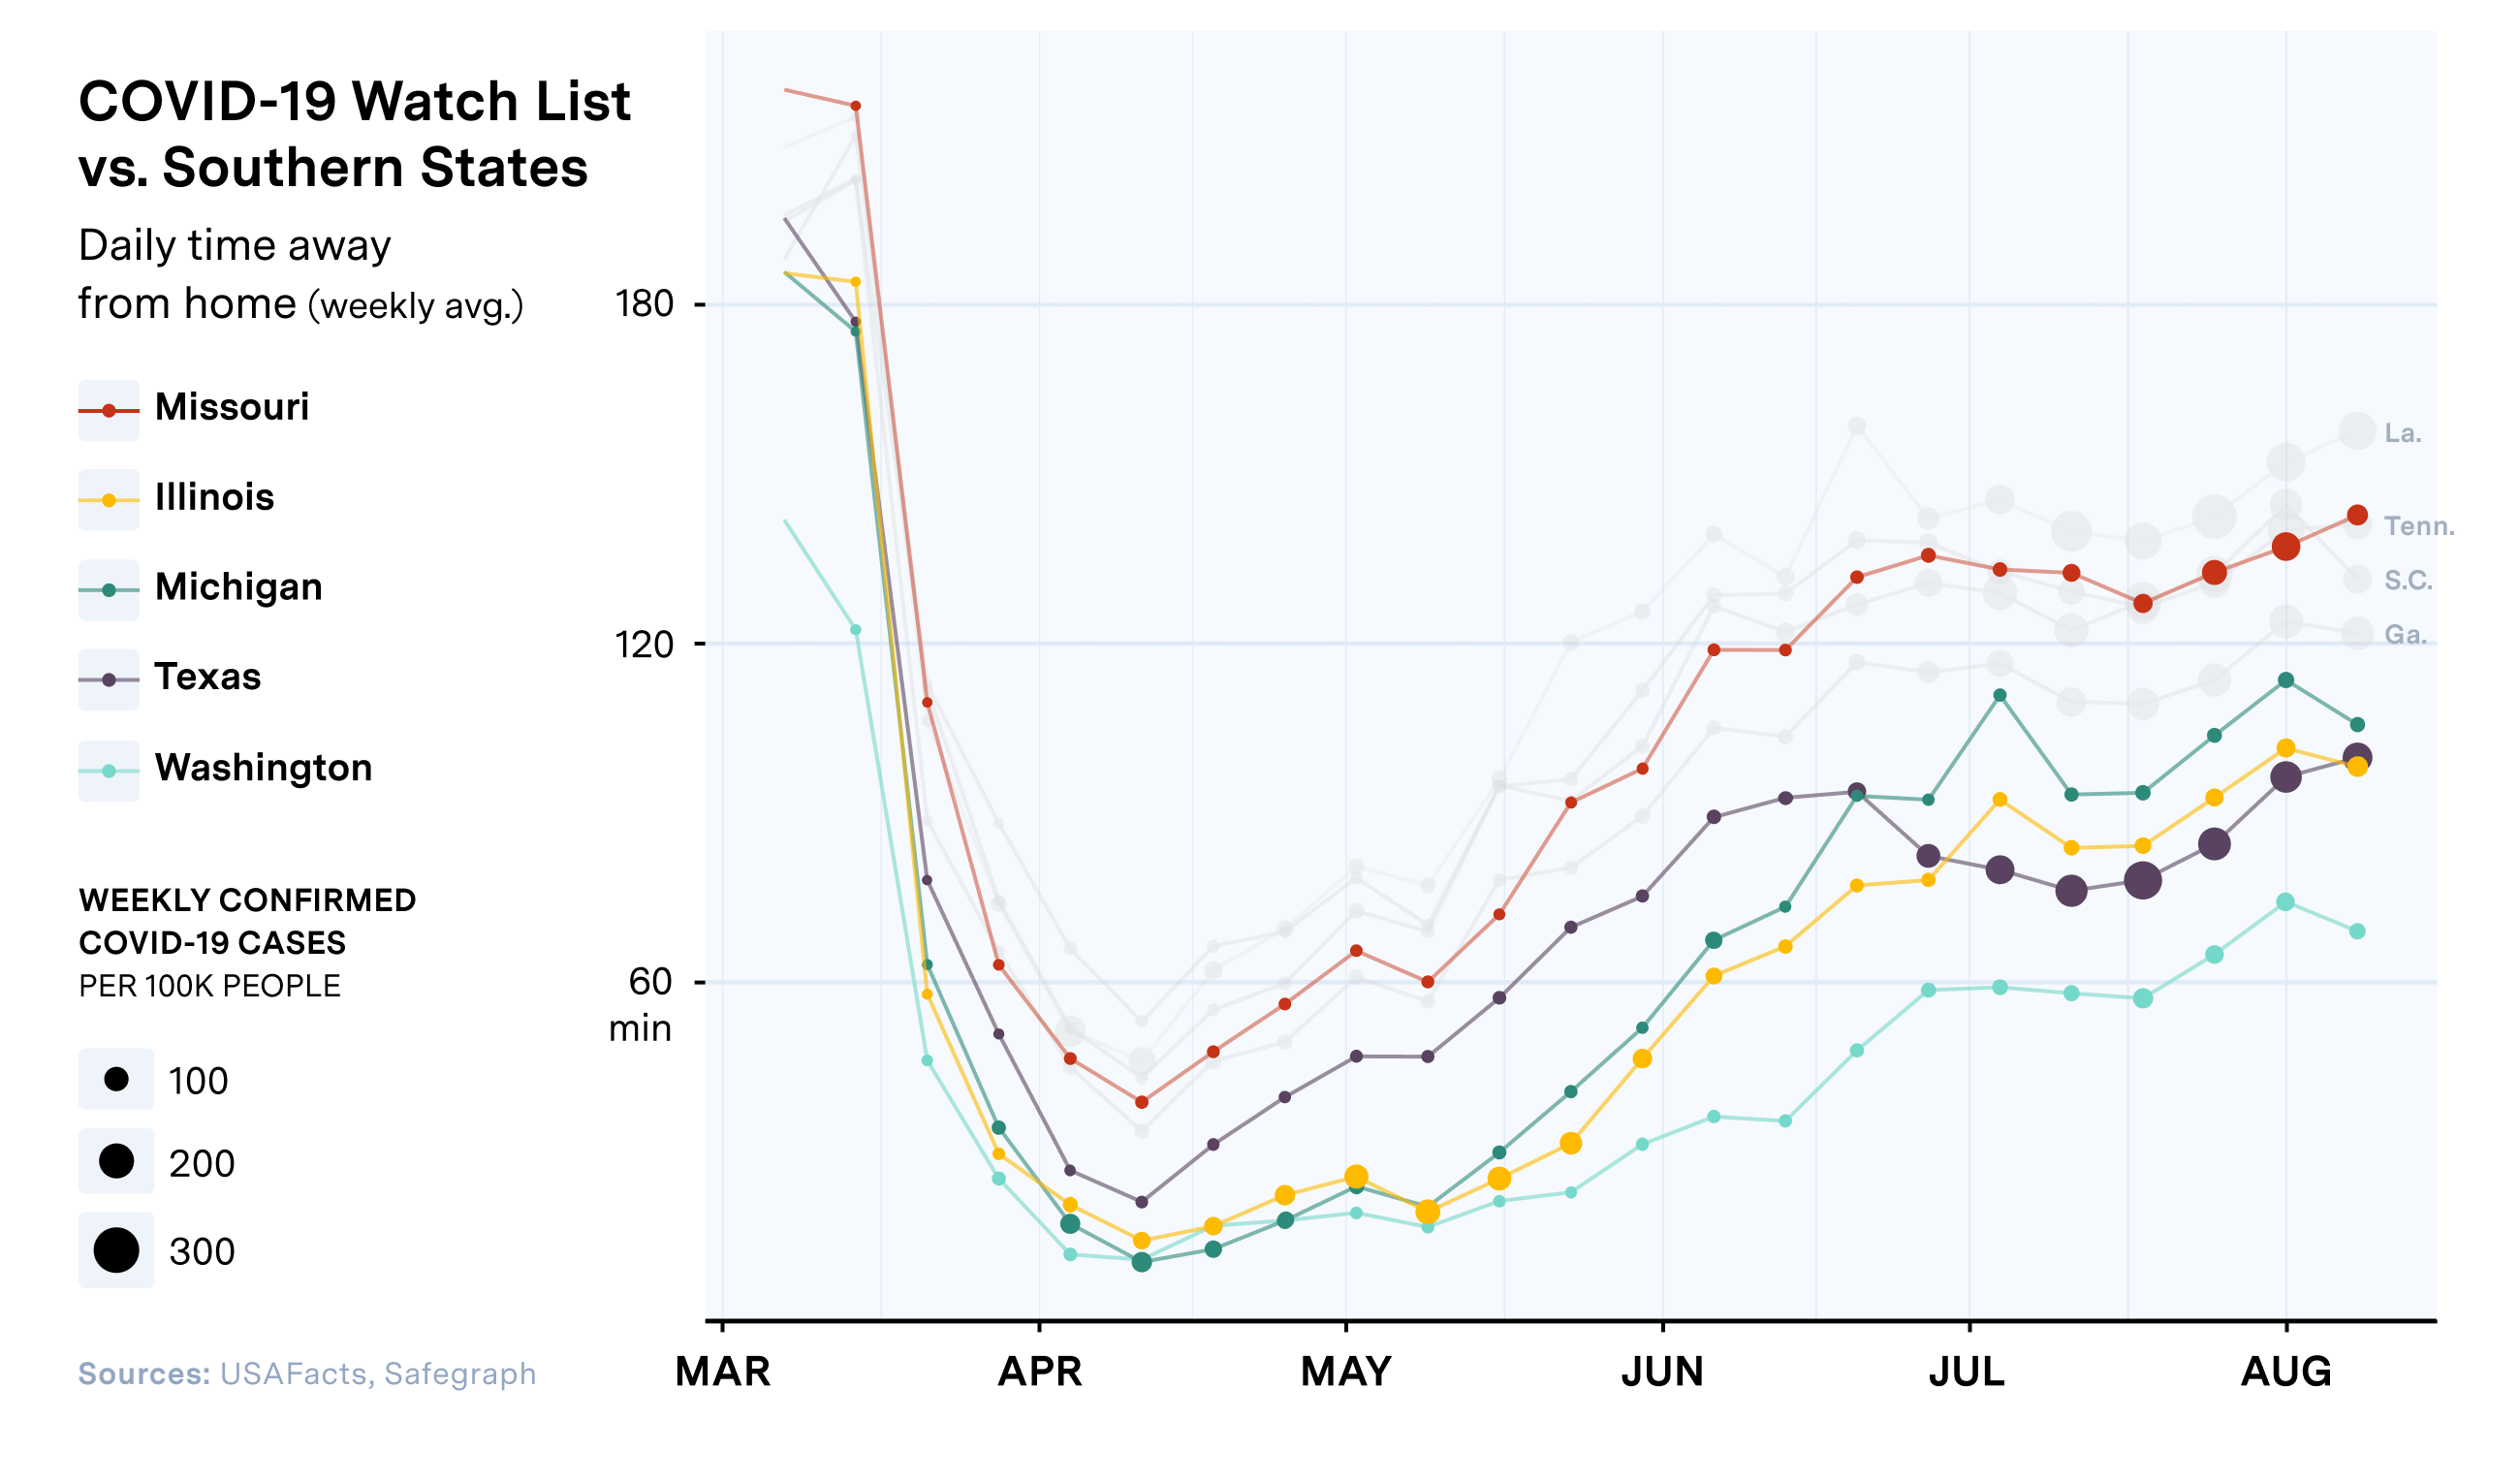
Missouri and Texas both stand out as states that have high COVID rates and increasing levels of movement, suggesting they are particularly at-risk for continued community transmission.
Further breaking down the most populated counties in at-risk states presents a more refined view and can serve to further assess transmission risk and plan interventions.
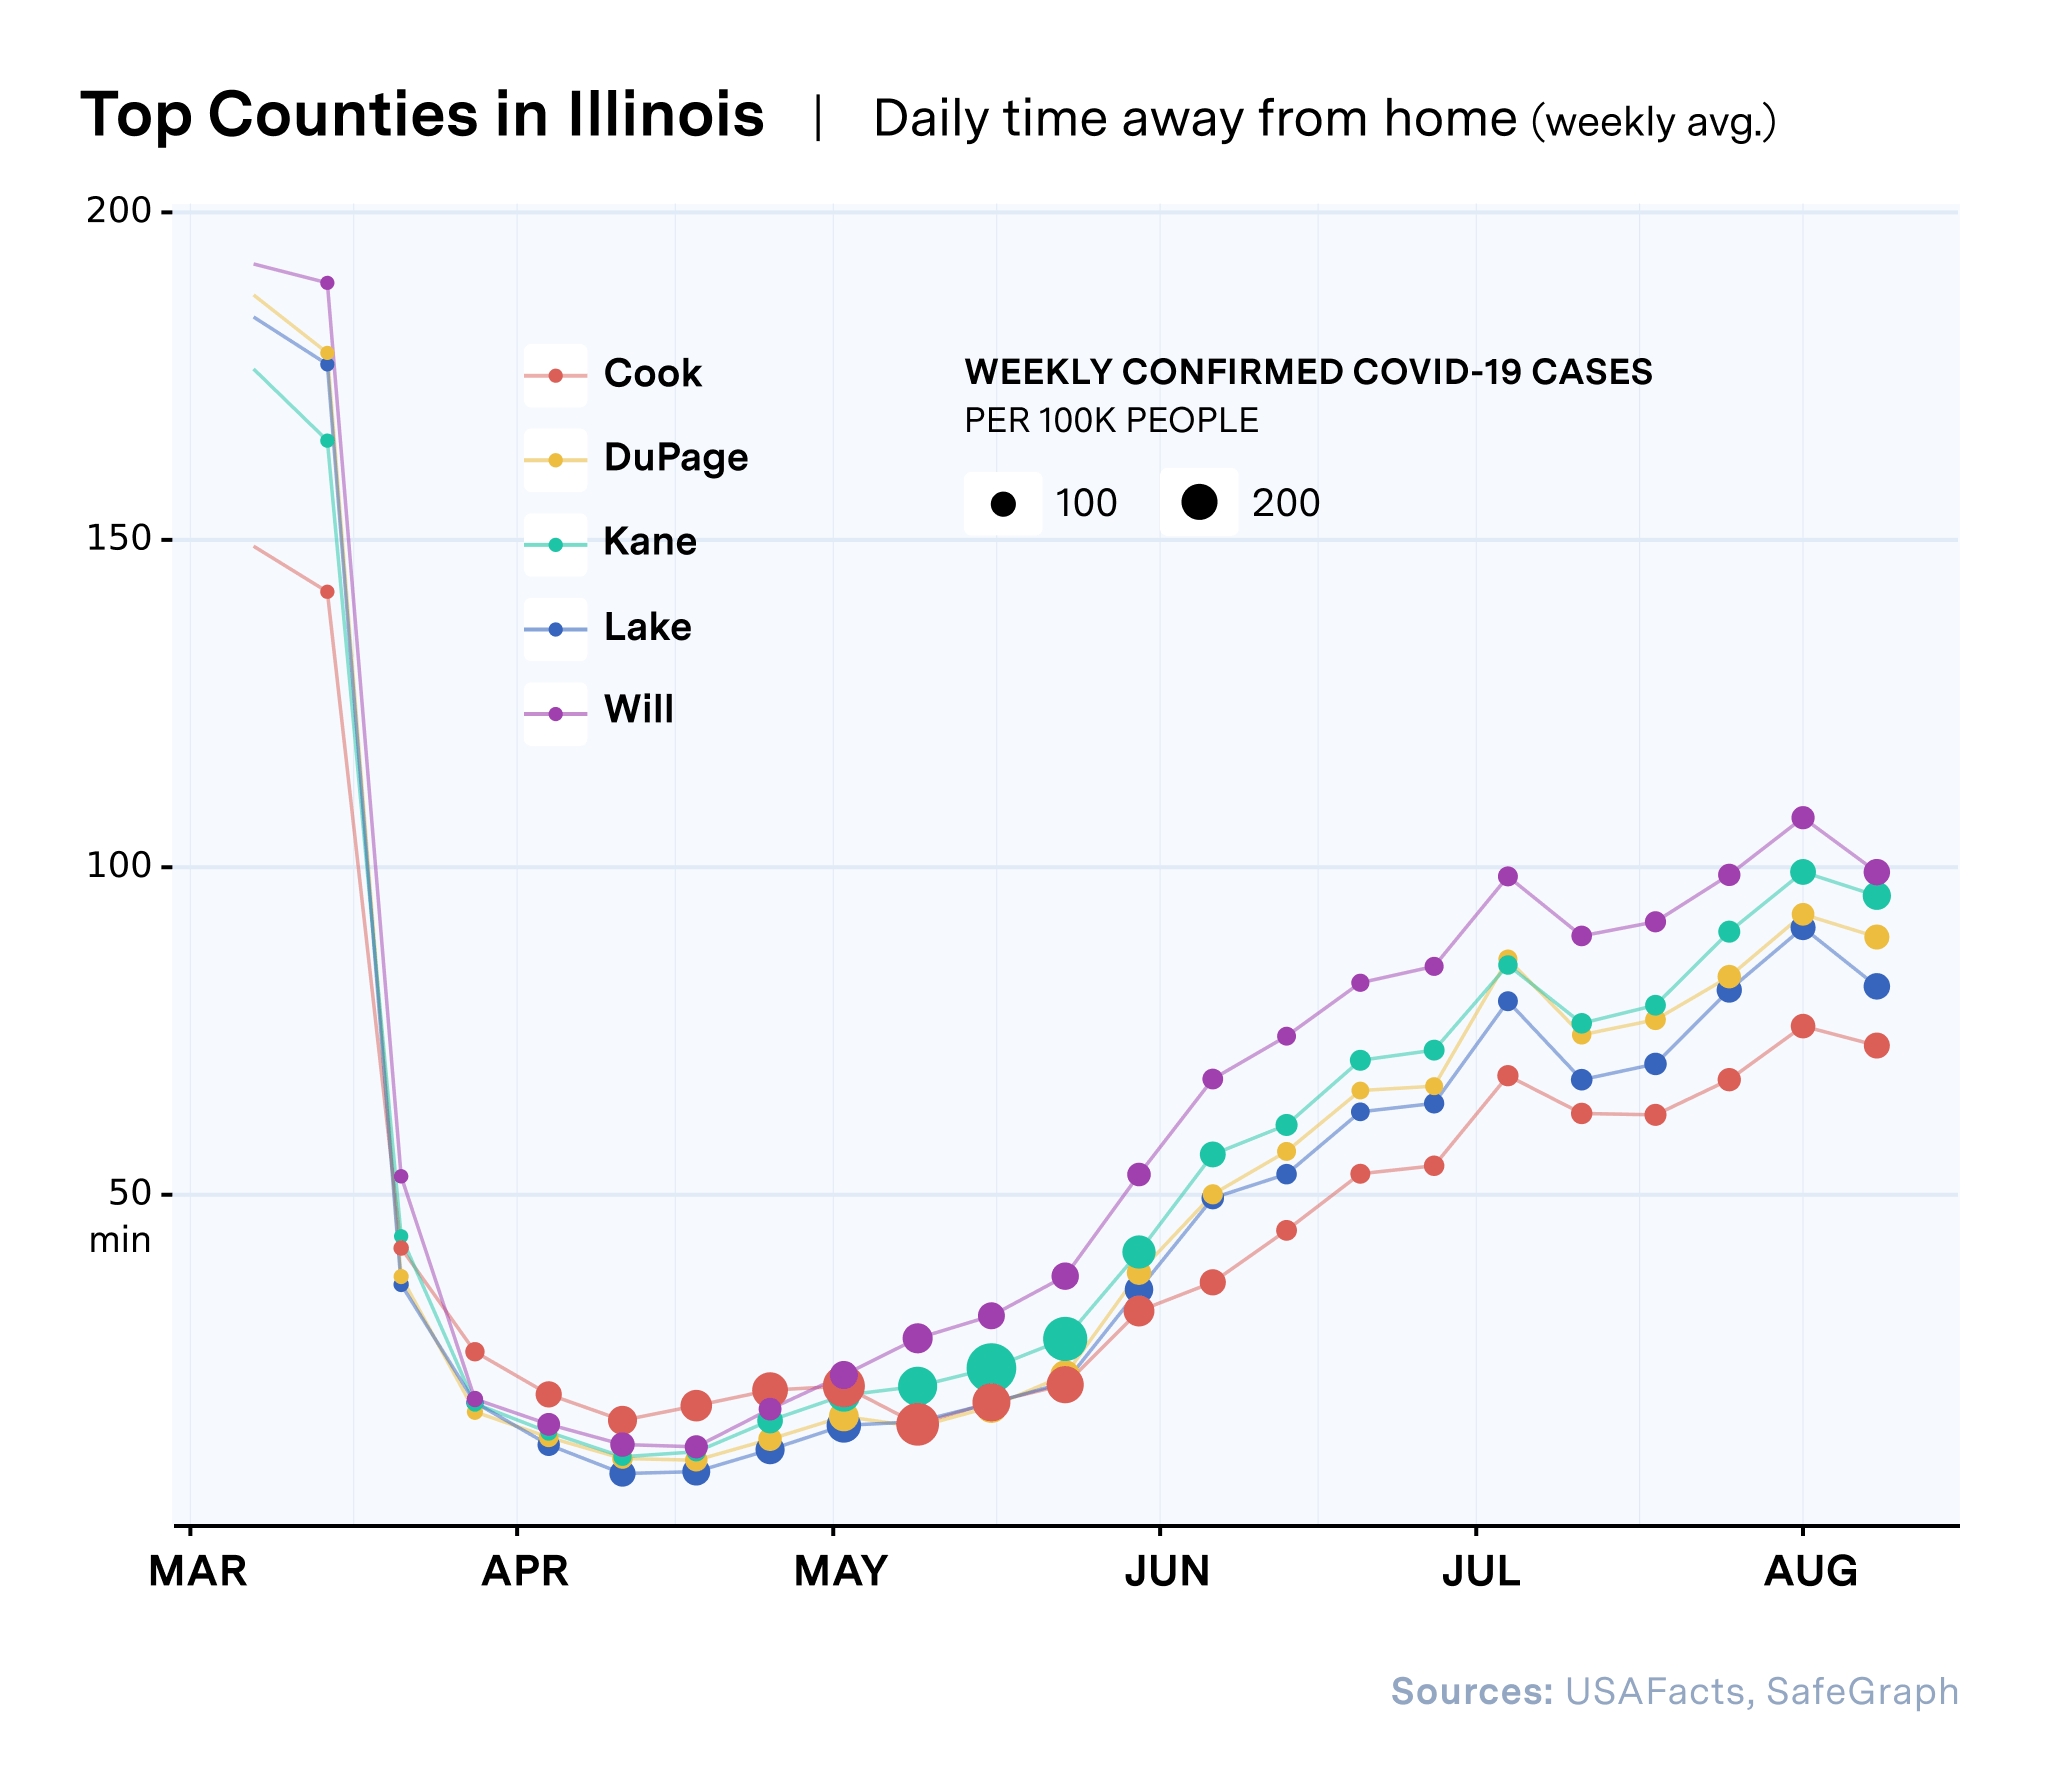
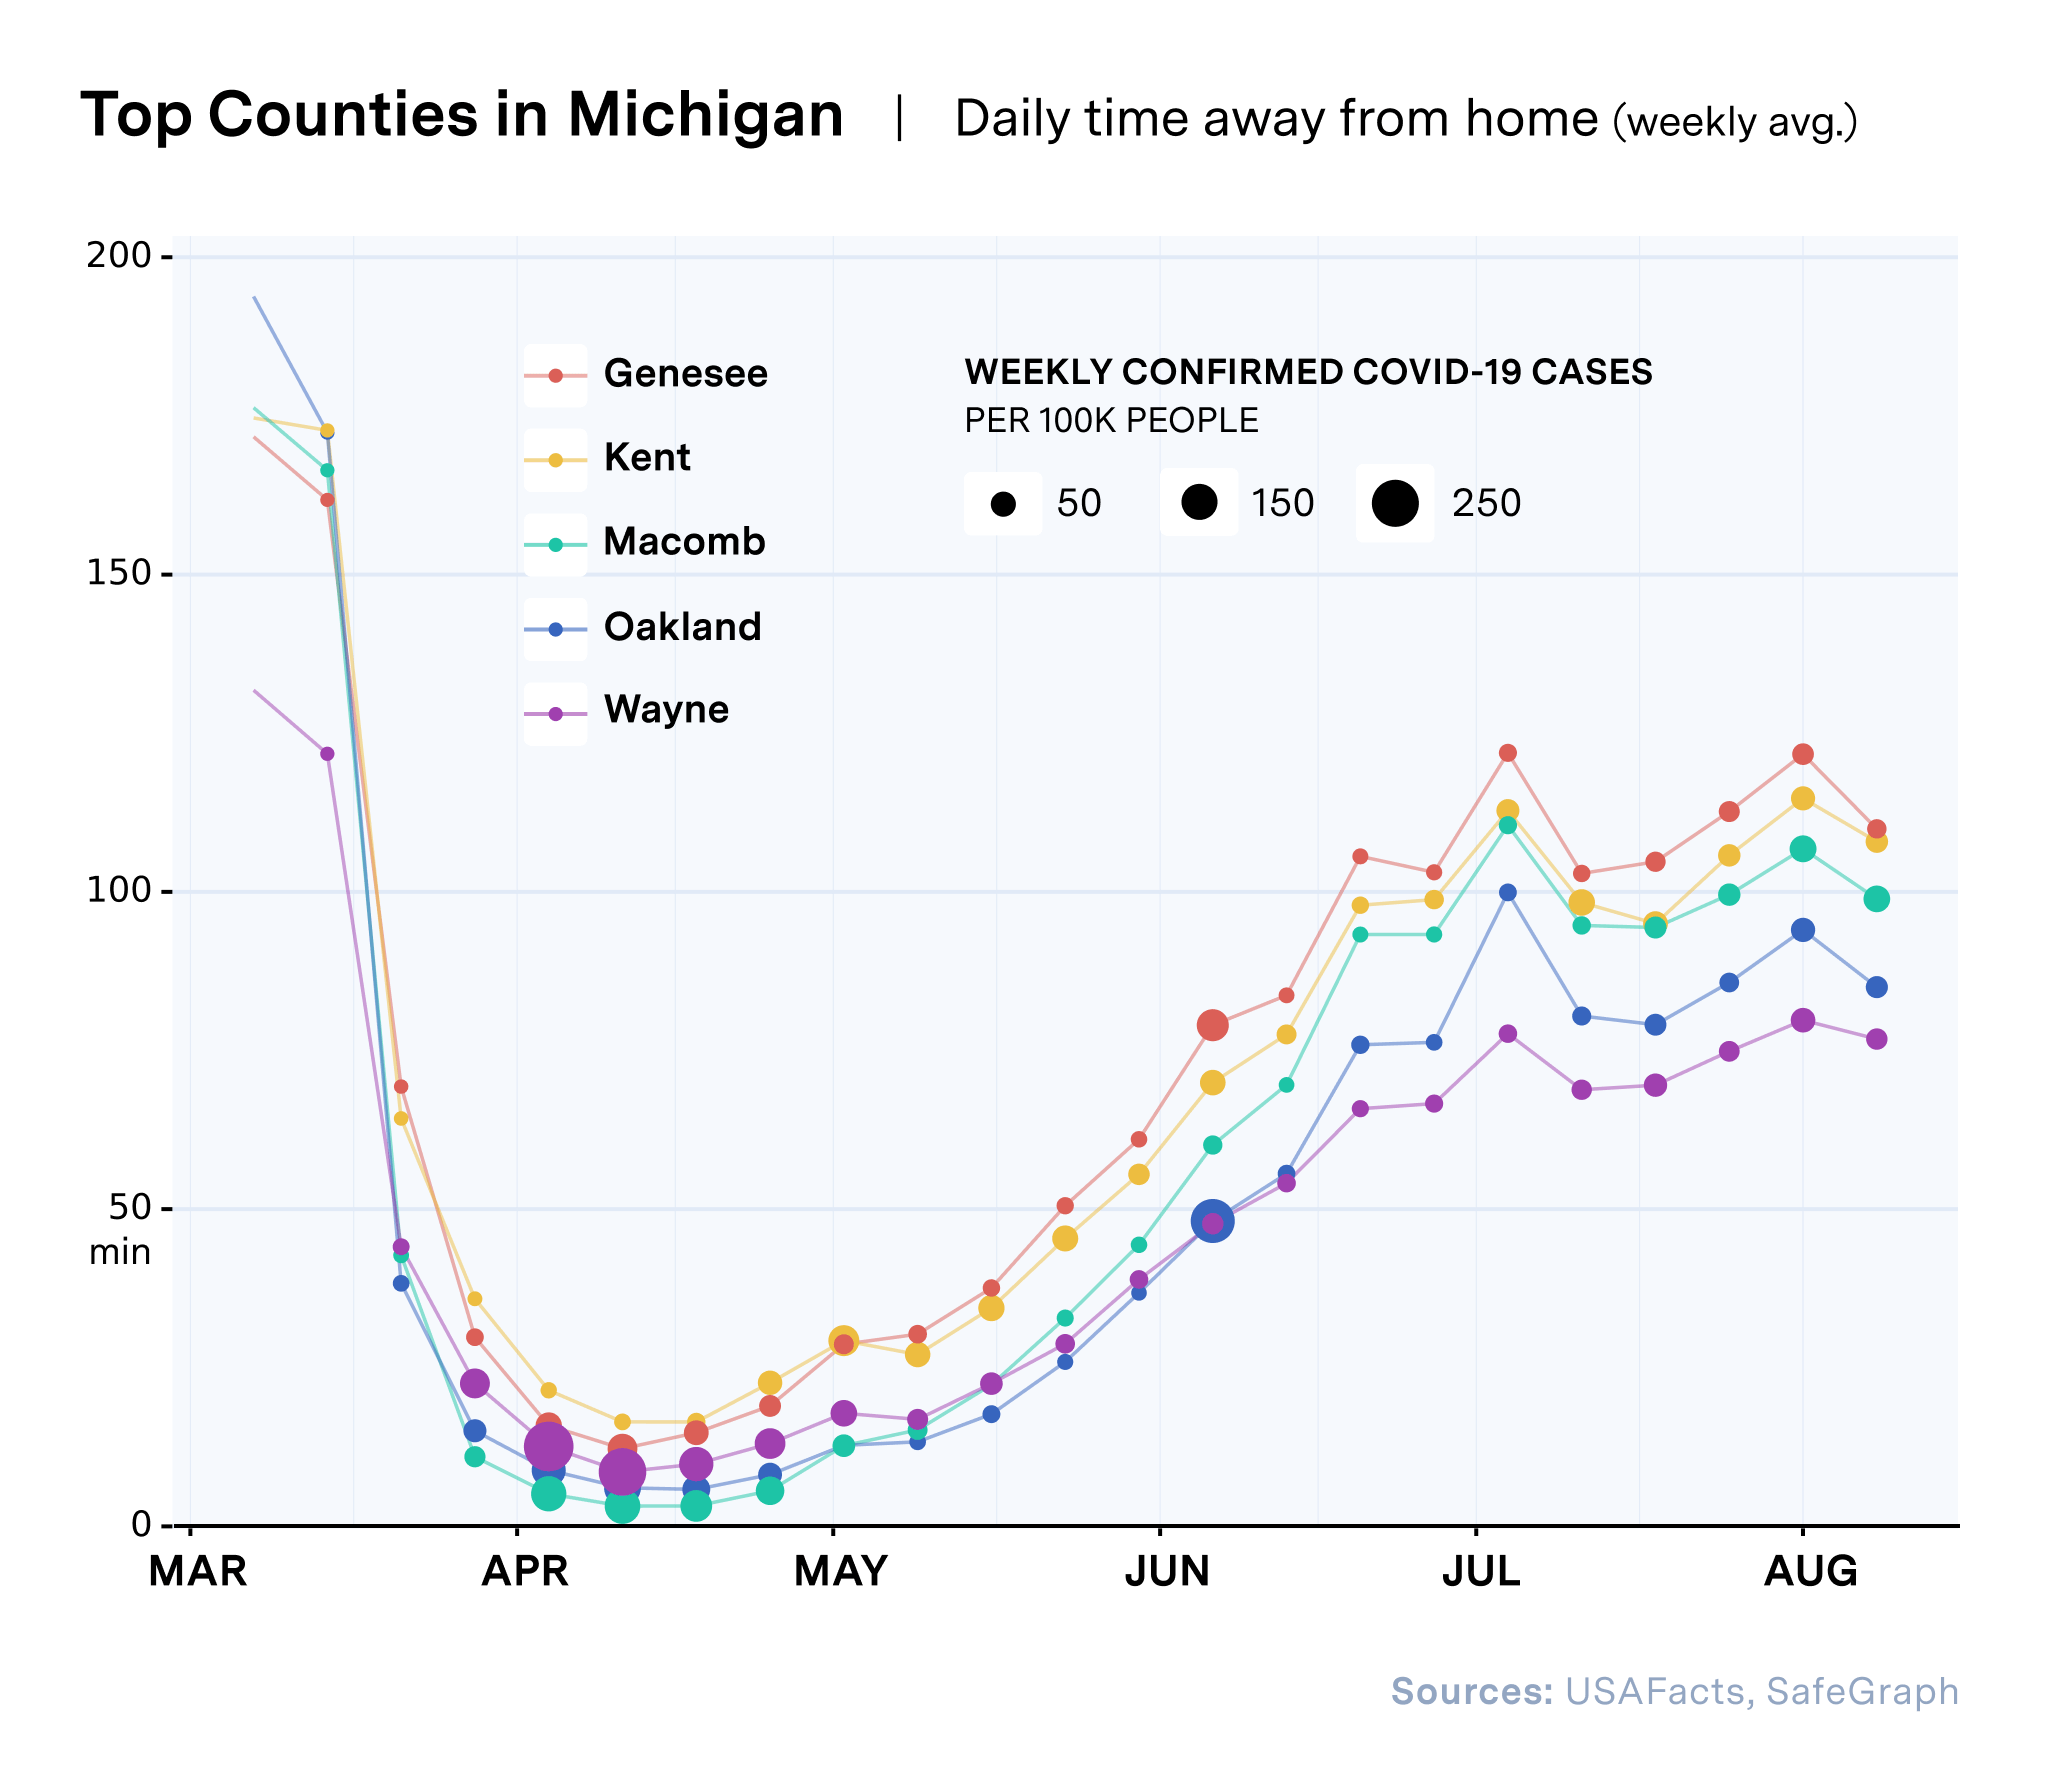
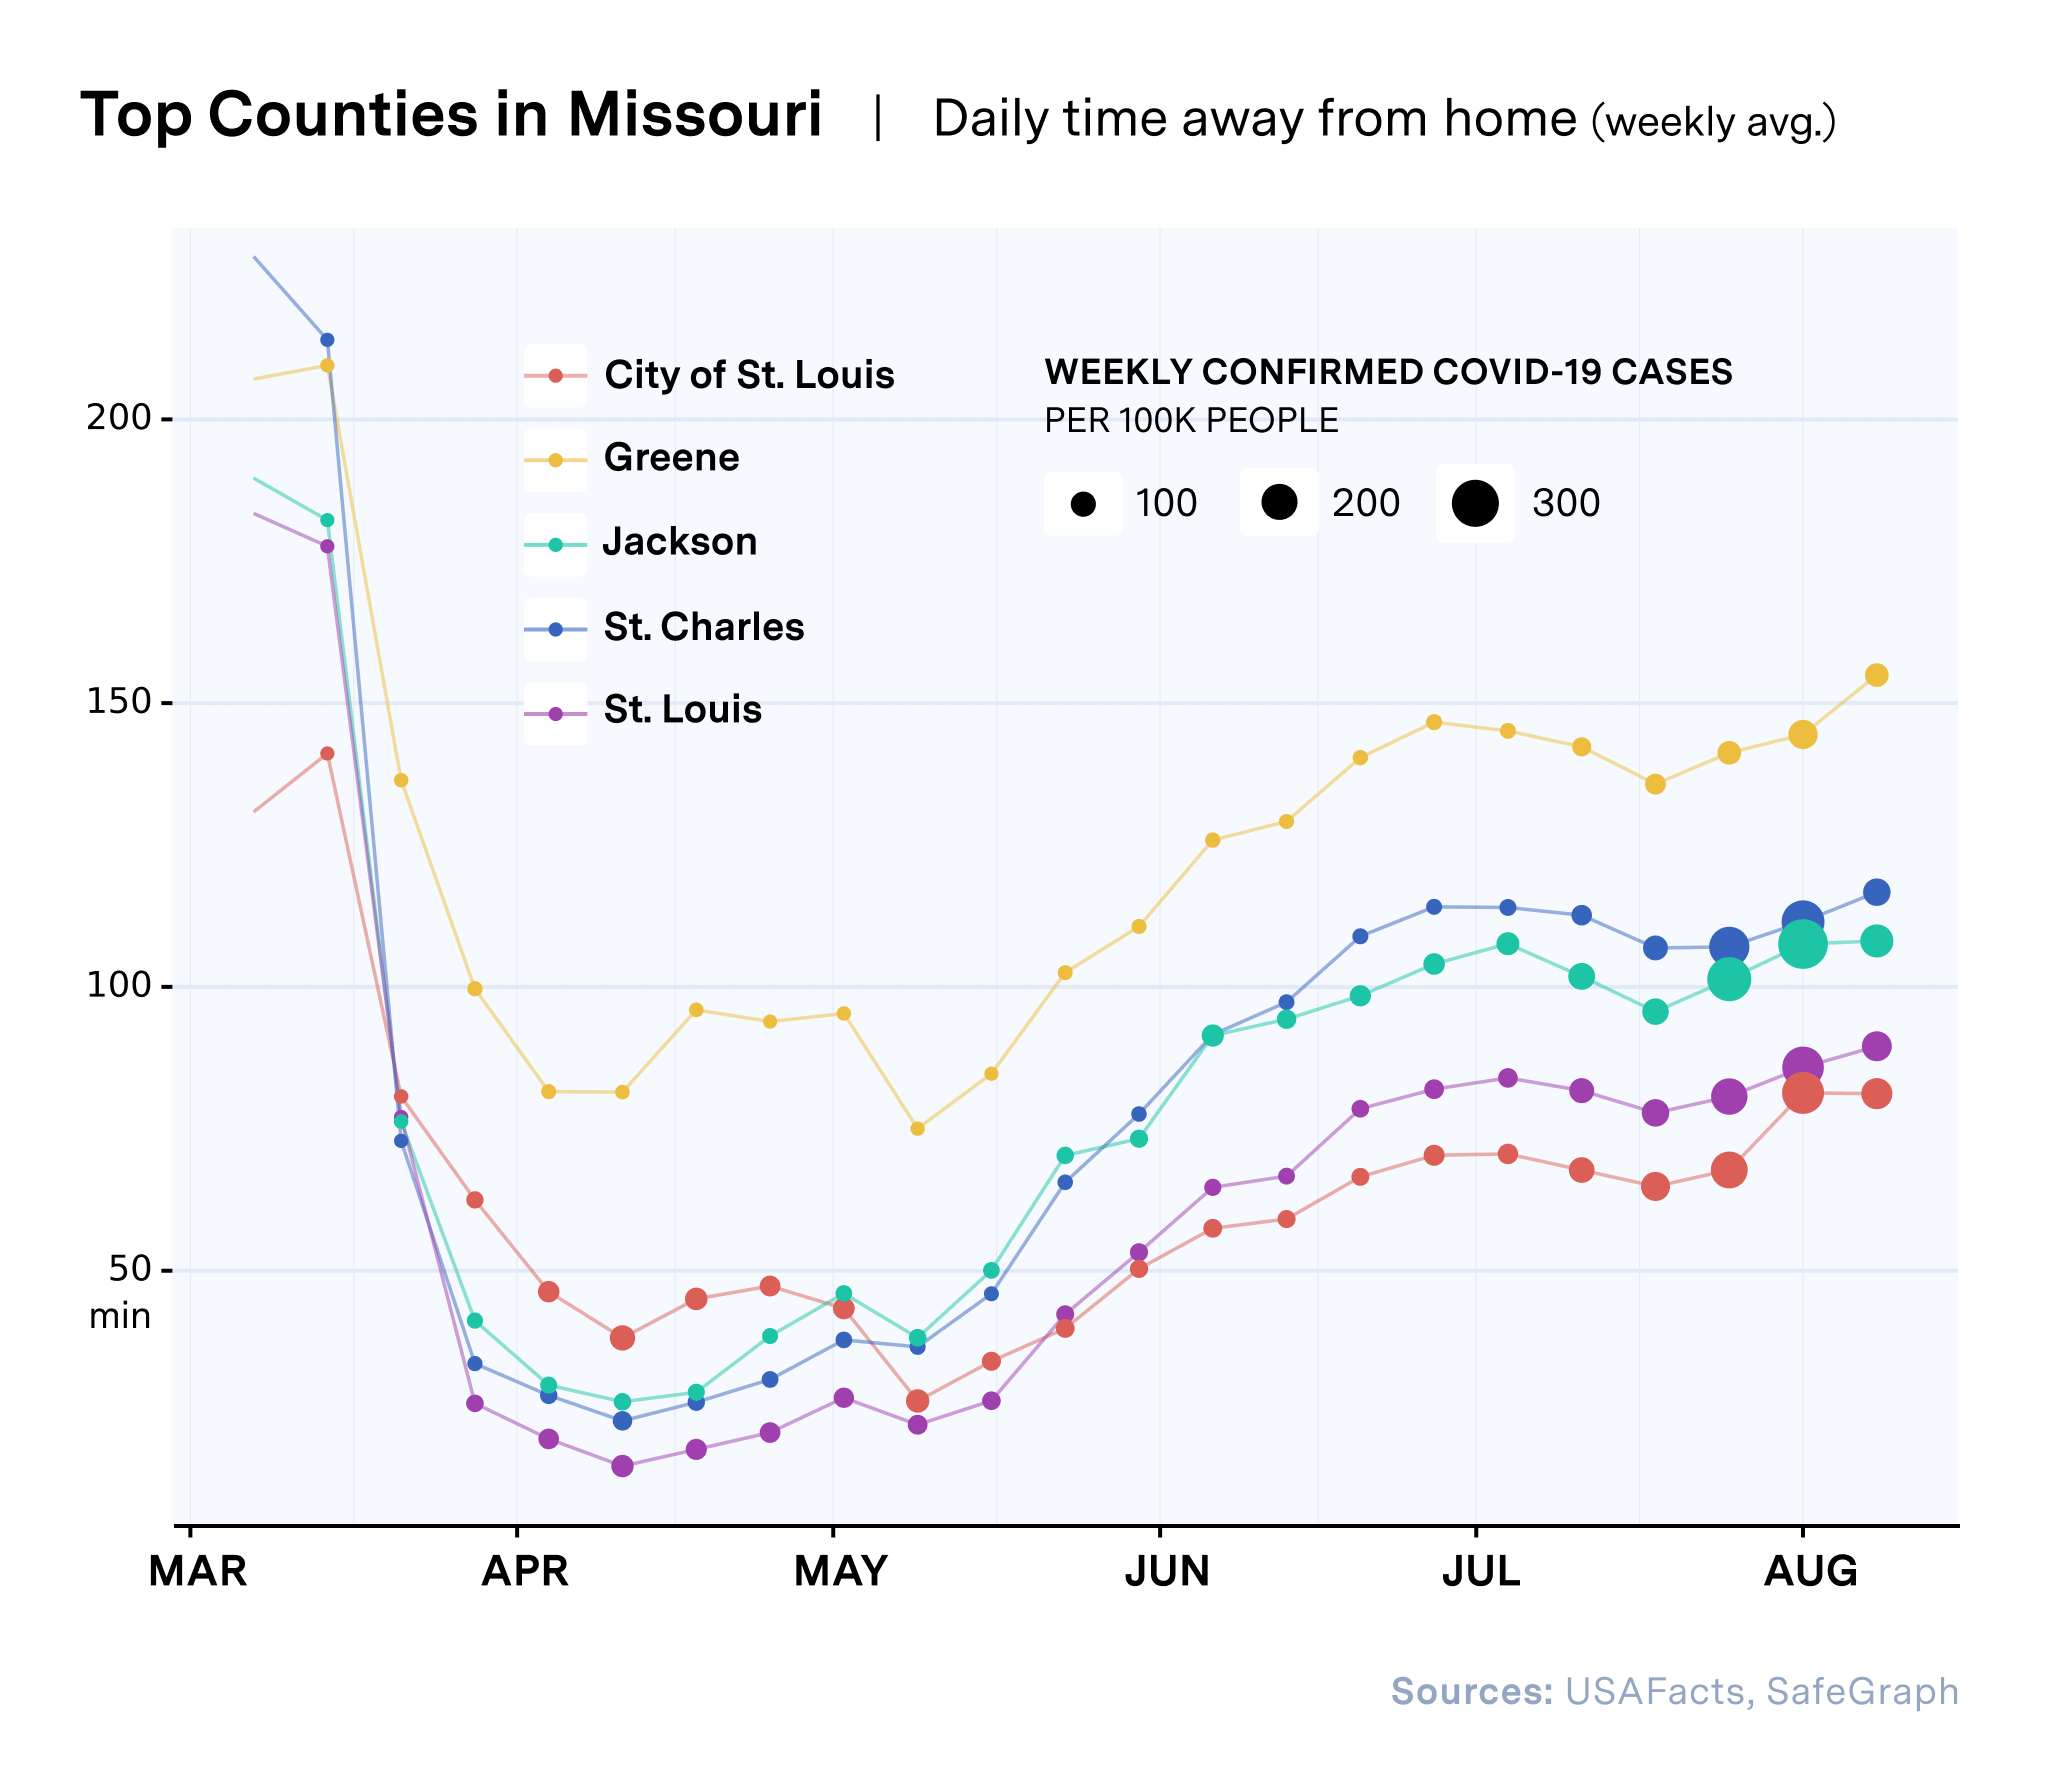
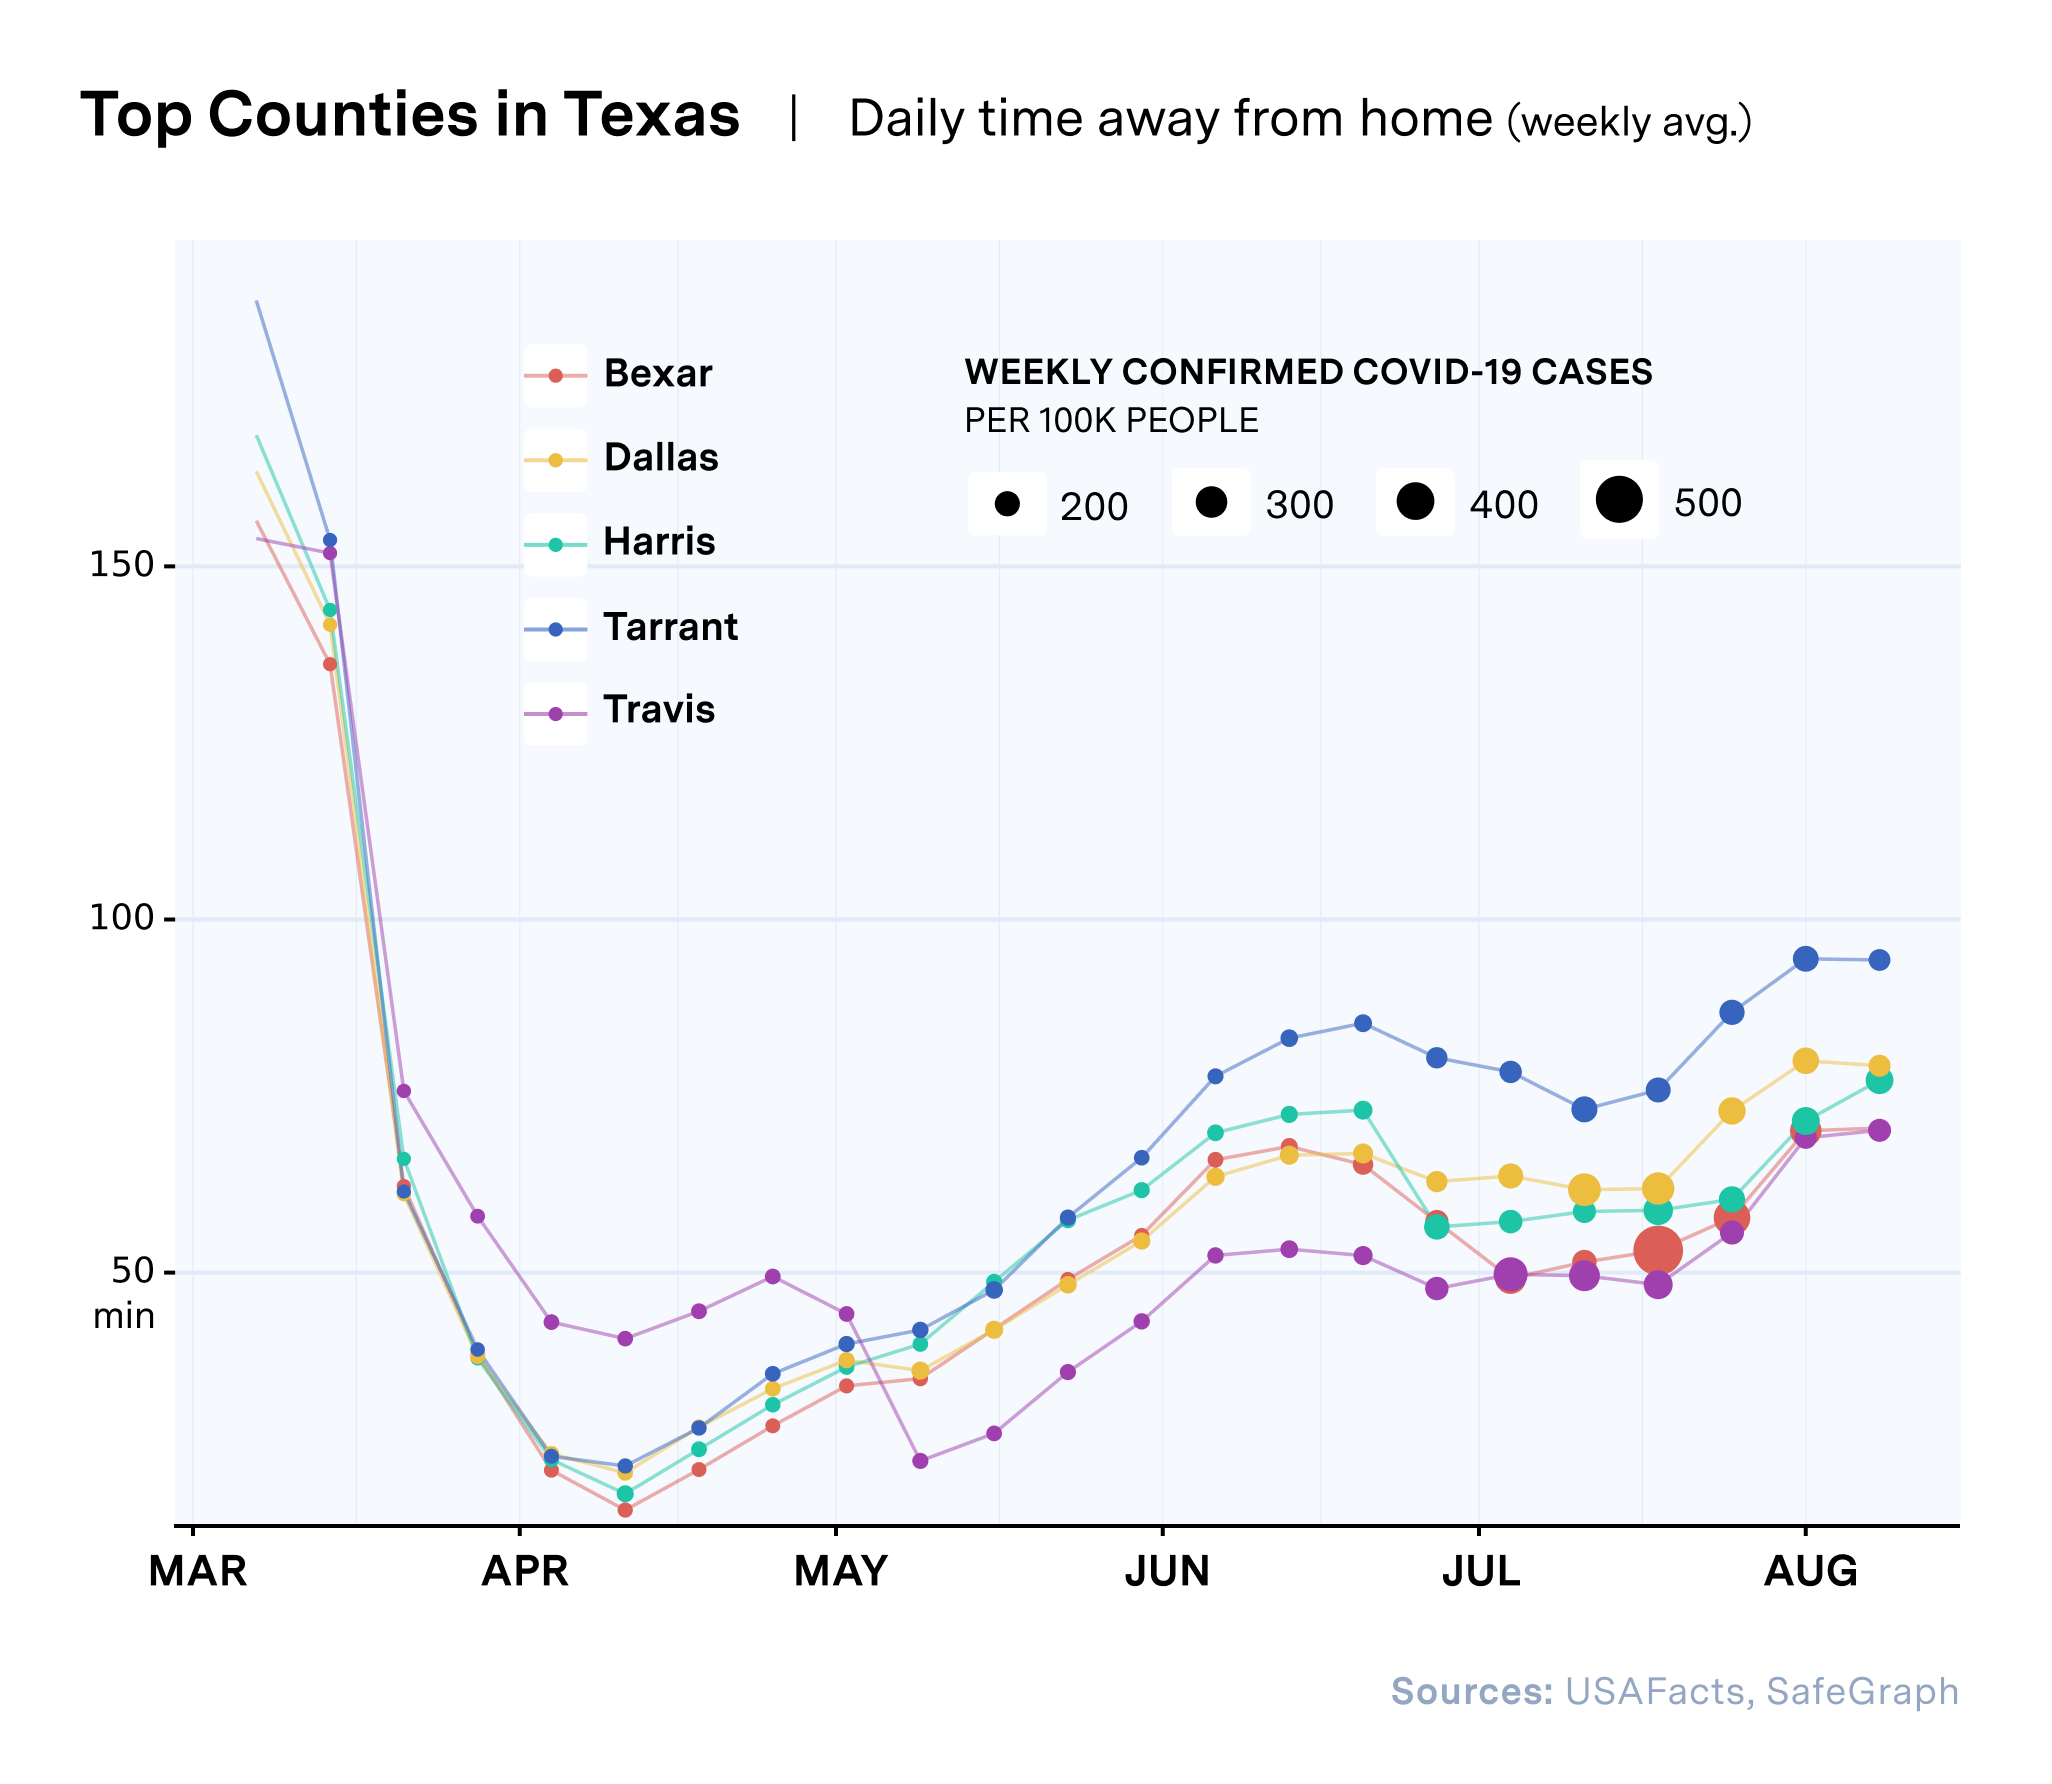
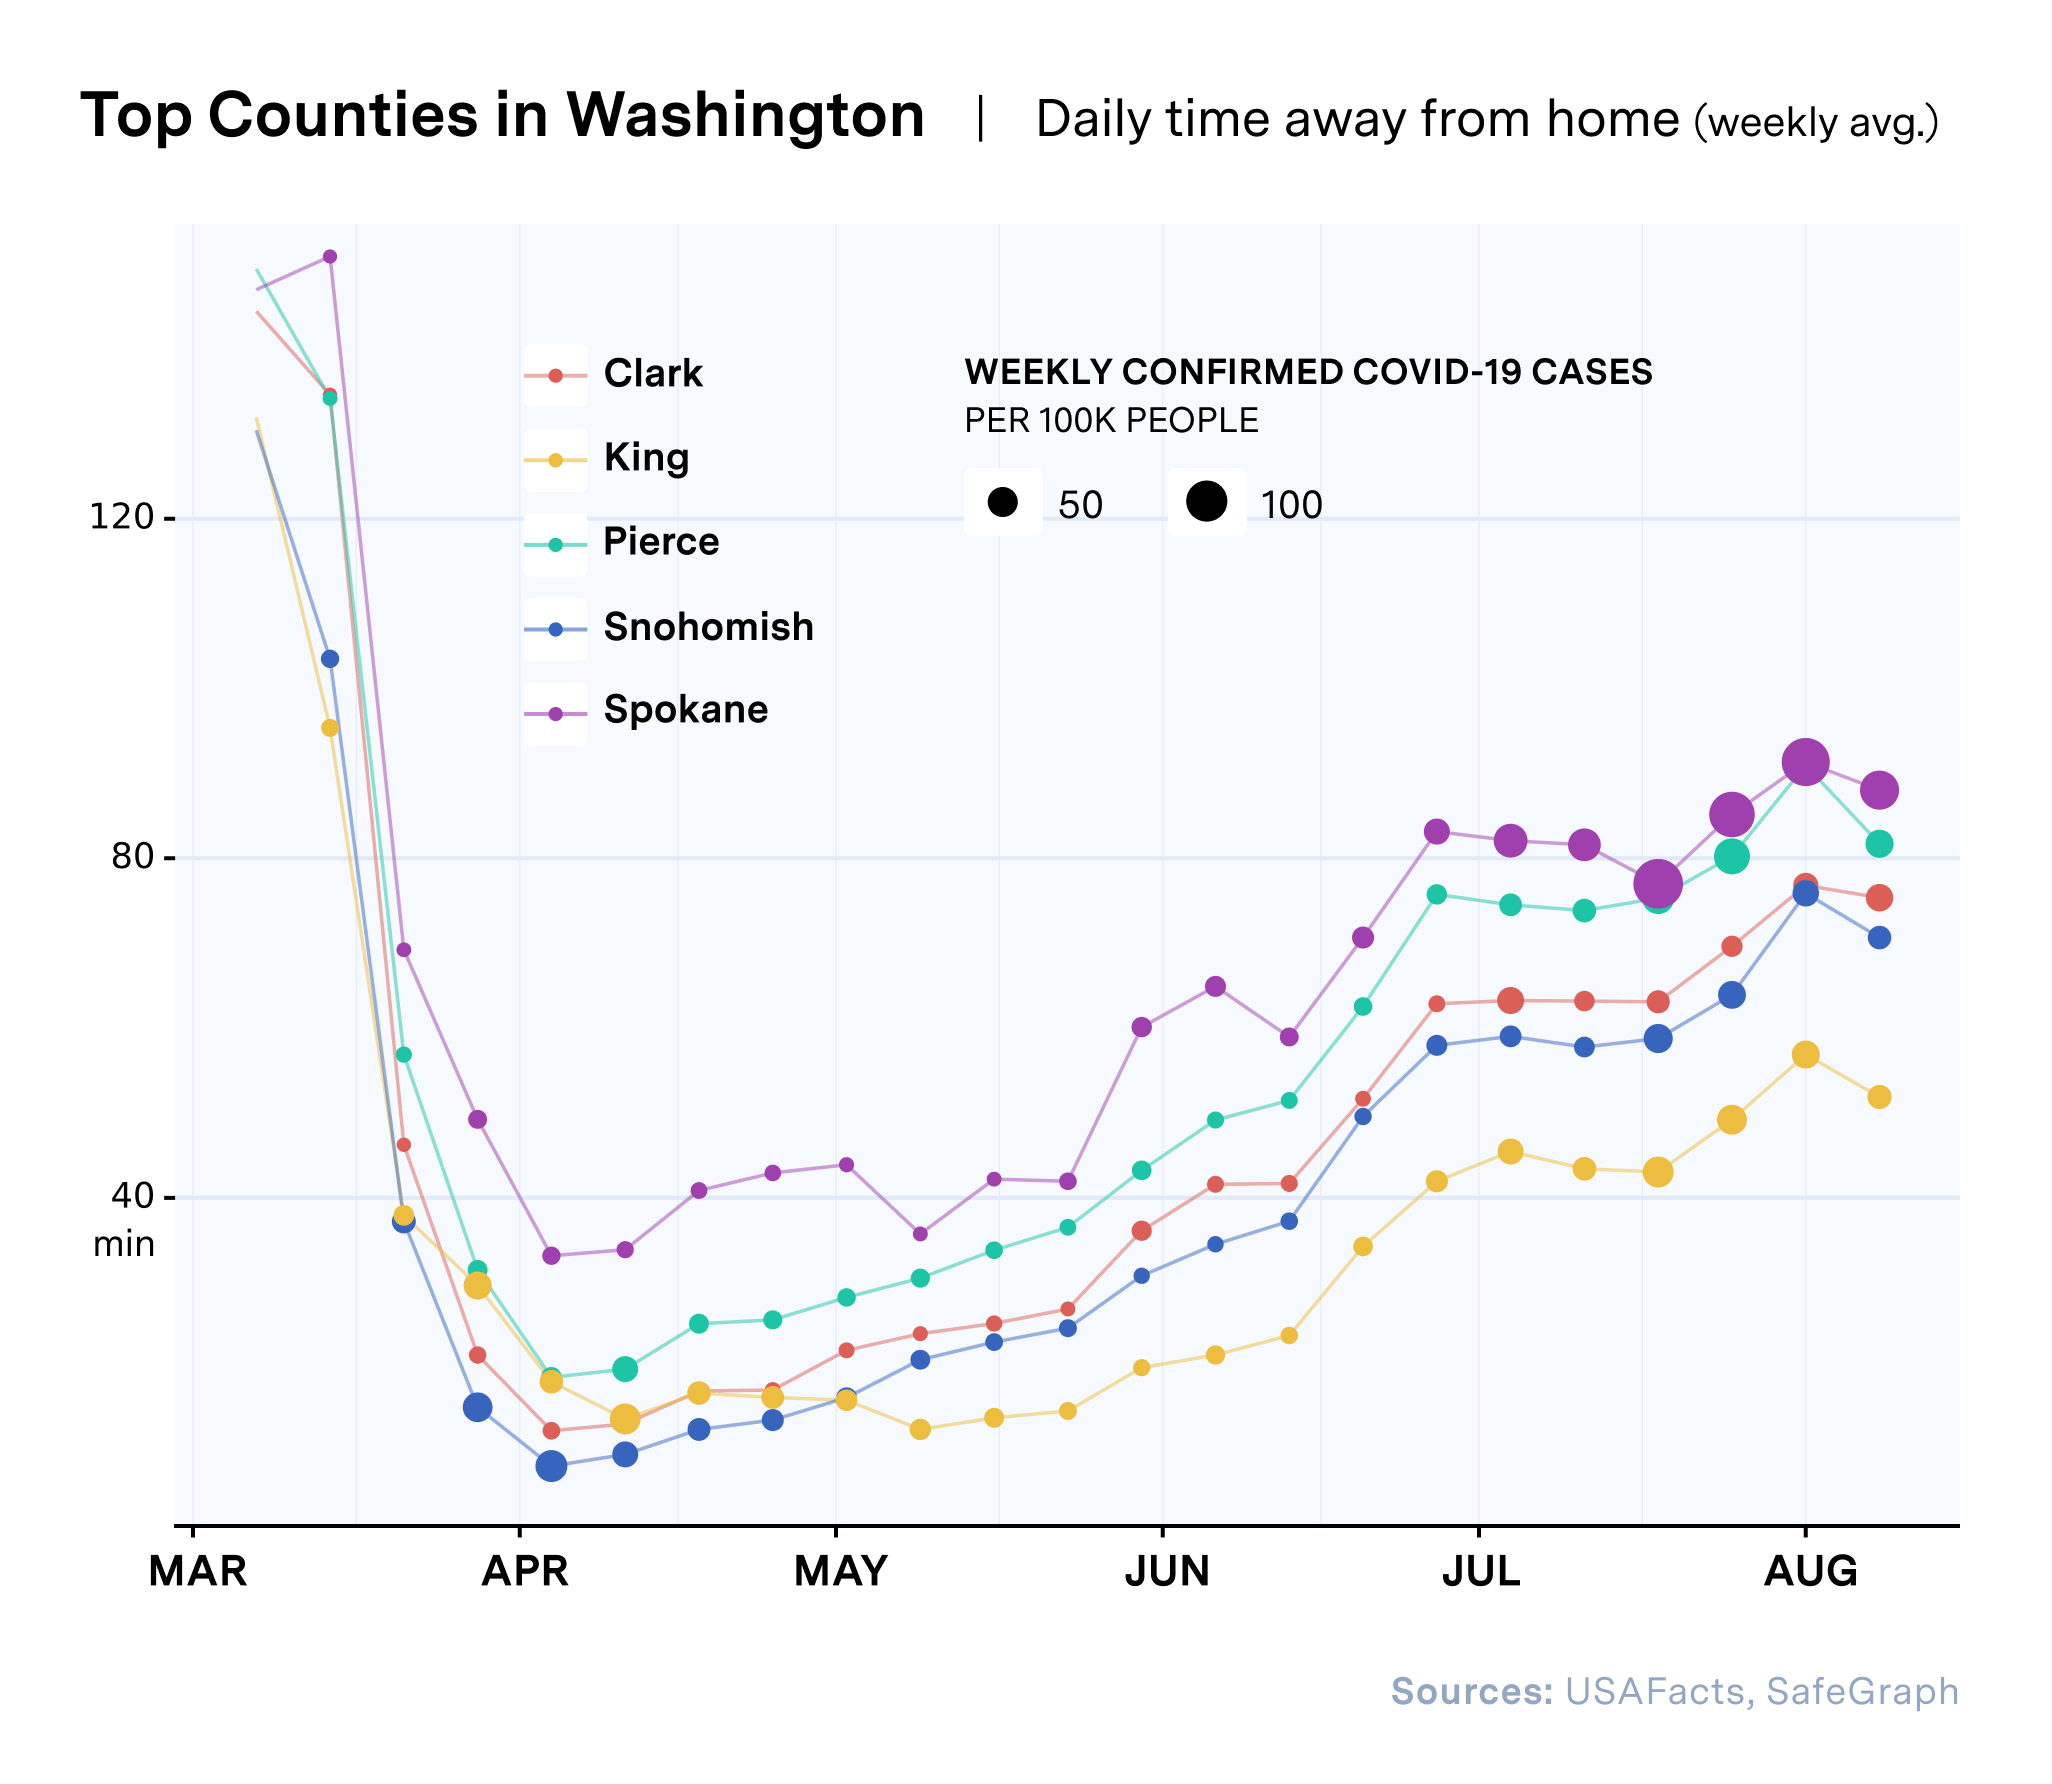
In counties where movement and per capita COVID-19 rates are trending upwards, interventions can be targeted to reduce movement, increase public health measures, increase testing and assess medical and ICU capacity.
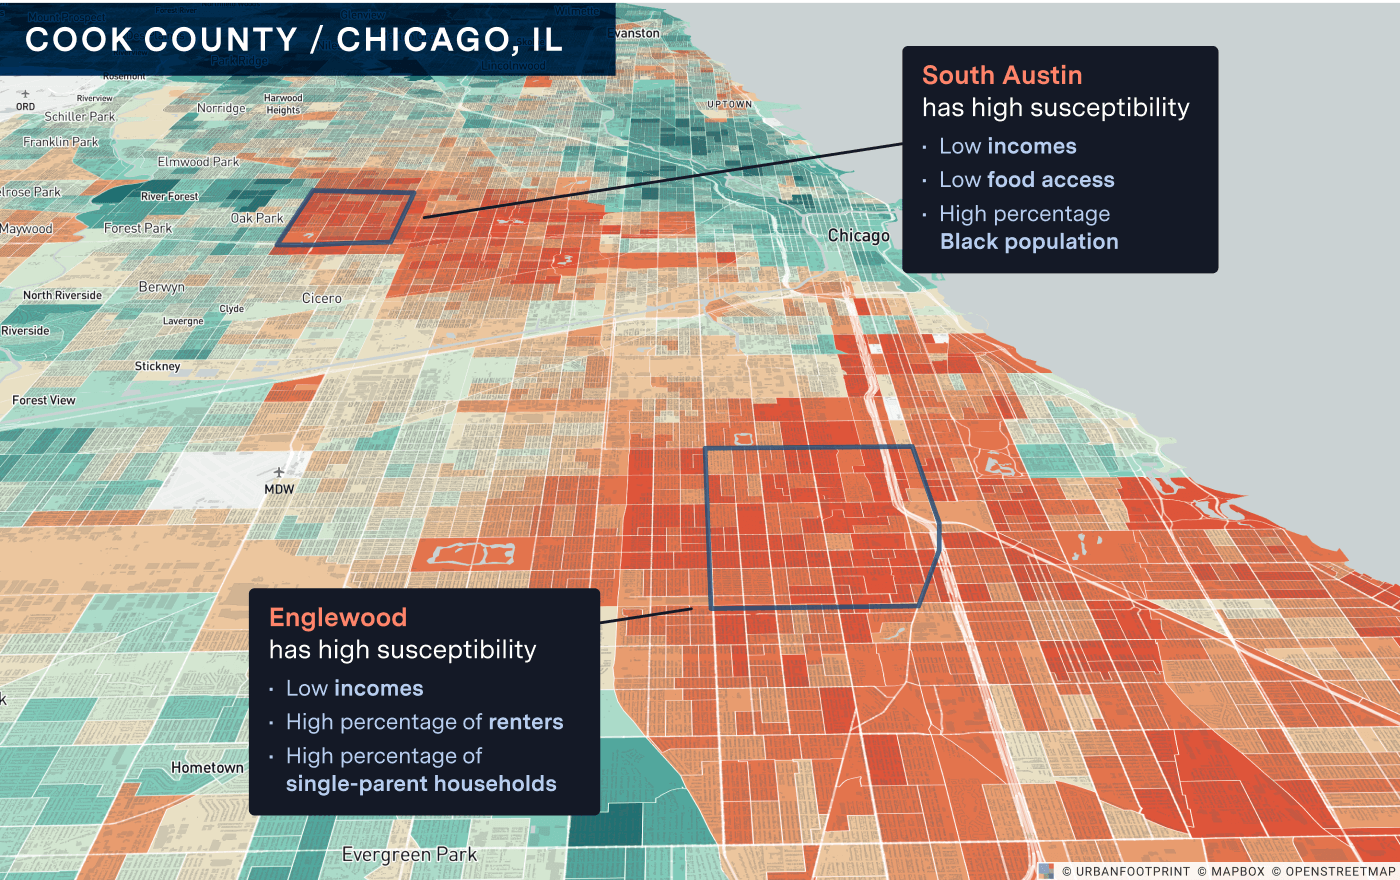
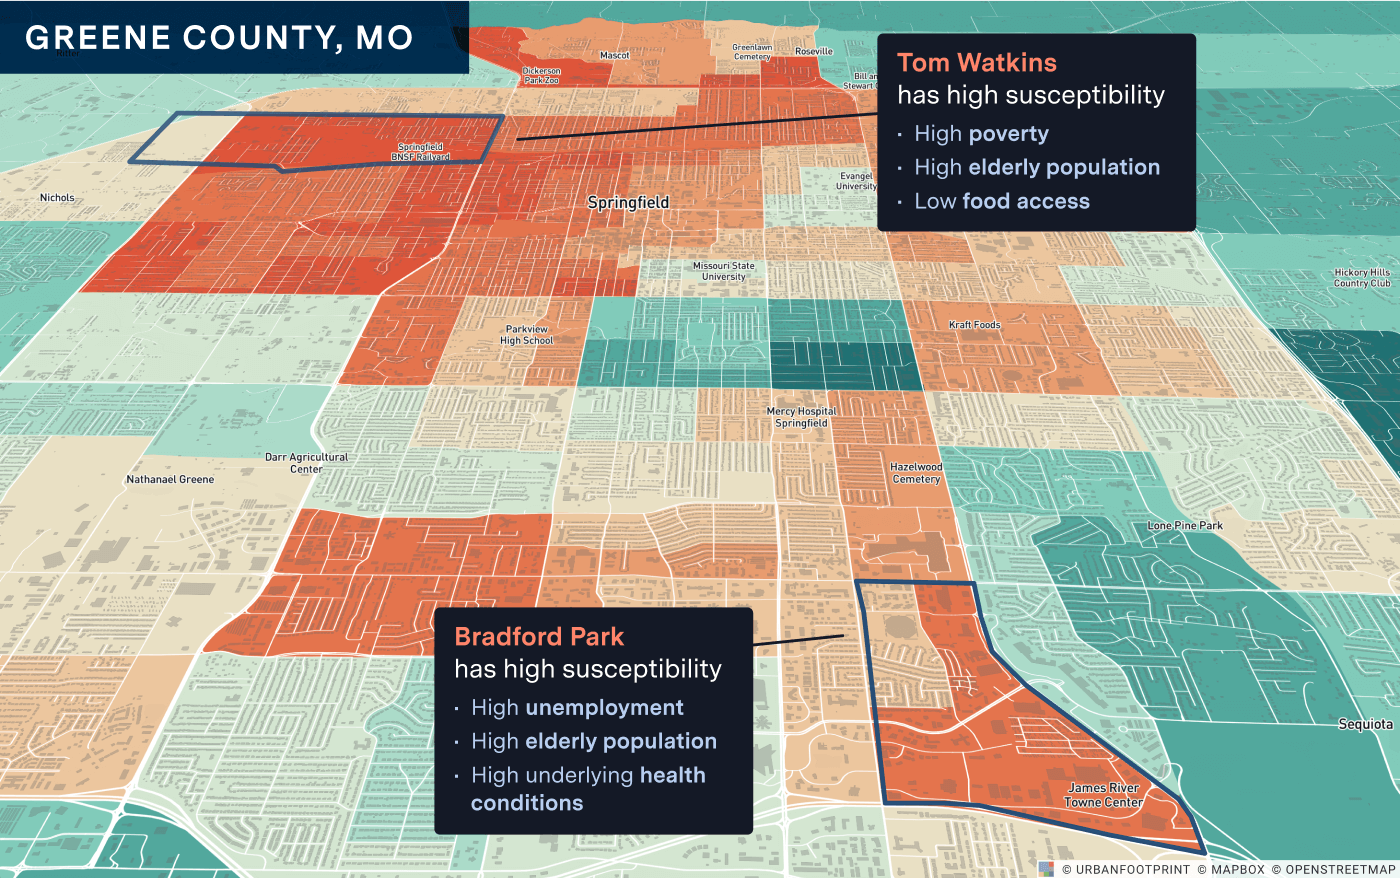
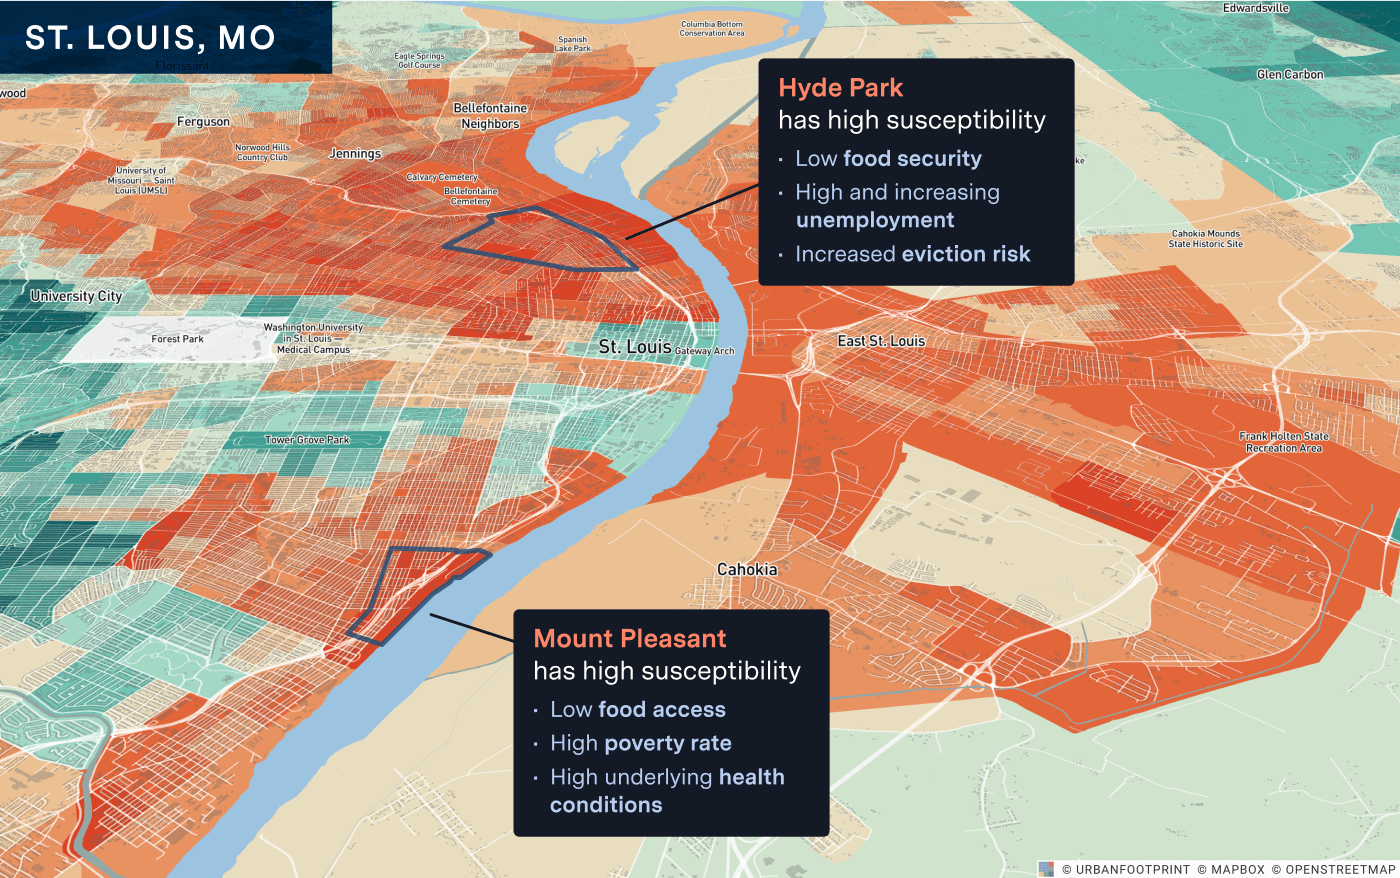
Geotargeting Interventions to the Most Vulnerable Communities
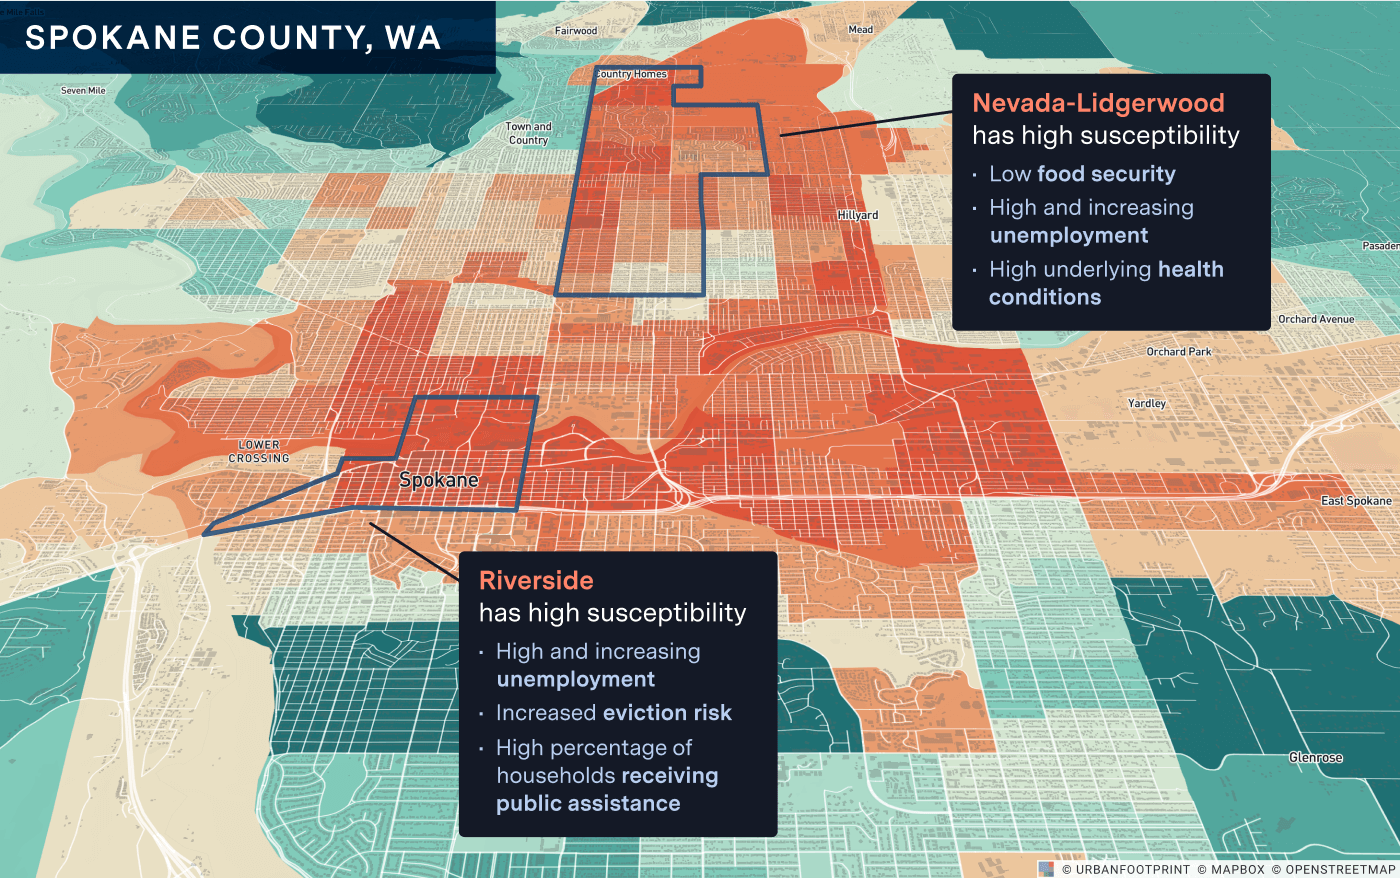
Given increased risk, it is also critically important to locate the most vulnerable populations in these emerging hot spots—areas where underlying health and socio-demographic factors increase risk to residents, and where increased unemployment, food insecurity, and eviction risk are highest. Geotargeting public health and social and economic interventions into such areas will serve to protect those most at risk and could prevent the crisis from digging even deeper into the most vulnerable communities.
Public health agencies and organizations can target the deployment of COVID-19 test sites into the most at-risk communities, expand medical surge capacity, and promote increased social distancing and mask use to reduce transmission. State and local governments and relief agencies can target food and rental assistance and provide social services. State and local jurisdictions and school districts can prepare for adjustments to economic sector activity and potentially start distance learning to reduce community spread among the most vulnerable. Certain communities are hit harder than others or are at greater risk of increased distress. Knowing where vulnerability is highest allows agencies to focus support where it is needed most.
Honing in on counties within ‘COVID-19 Watch List’ states where transmission risk could be highest, we can identify the communities most susceptible to COVID-19 and map out plans to reduce risk and address the health, economic and social needs of residents.

Better data can help agencies limit COVID-19 transmission and protect the most vulnerable
Now in the sixth month of the pandemic, many communities are experiencing a confluence of crises and are facing high levels of unemployment, high risk of eviction and homelessness, critically low access to healthy food, and poor access to medical and testing services. As federal and state assistance and protection expires or is reduced, these communities are also at very high risk of disease transmission and, in many cases, residents are also more likely to have underlying health conditions and socio-economic factors that place them at higher risk of complications and death.
As the race for a vaccine continues, we need better tools to fight the compounding impacts of the coronavirus pandemic for the long term. Better data can help governments and front line organizations understand where spikes may happen next and plan ahead to deliver relief and essential resources to those that need it most.
Have a question? Get in touch and let us know how we can help.
