


Starting your projects with up to date data just got easier. Our latest Winter 2025 data release brings refreshed nationwide datasets, including:
- Updated parcel and land-use data for current property insights
- Updated transit coverage with data from 800+ transit agencies
- Updated Community Insights using the latest census data to reflect population and household changes
- Updated area boundaries using the latest census data
- Updated energy datasets for energy use, emissions, and cost analysis
- Updates to the reference data library to reflect the latest available information from trusted, authoritative public and proprietary sources.
Let’s dive into what’s new.
Base Canvas: Quarterly Update
The UrbanFootprint Base Canvas has been refreshed to use updated data from our input sources, plus we made a few improvements.
- Updated parcel and point of interest data – all underlying parcel information and points of interest, which are inputs to land use typing, have been updated for the quarter. Also find the latest parcel information reflected in the Parcel Reference Data layer.
- Census data – this update incorporates the latest estimates of population and households from American Community Survey (ACS) 2023.
- Refined property value estimates – we’ve improved accuracy, especially for parcels with multi-unit buildings.
For more on using the Base Canvas and standardized parcel data in UrbanFootprint, check out our recent blog post: Unlock the Power of Unified Parcel Data.
Transit: Updated Coverage for Accessibility Analysis
UrbanFootprint’s transit data – the Public Transit Stops and Public Transit Lines layers – cover over 800 transit operators across the country, sourced from Mobility Database. This dataset powers our Accessibility modules, which measure:
- Access to transit – analyze connectivity across your project area
- Access to jobs and housing via transit – assess workforce mobility and housing accessibility
Easily add the updated layers to your projects. You’ll find information on transit modes, operators, and peak and daytime average headways, arrivals, and speeds.
Learn more about using these tools to optimize walkability and transit planning with UrbanFootprint: Master Walkability and Transit Accessibility.
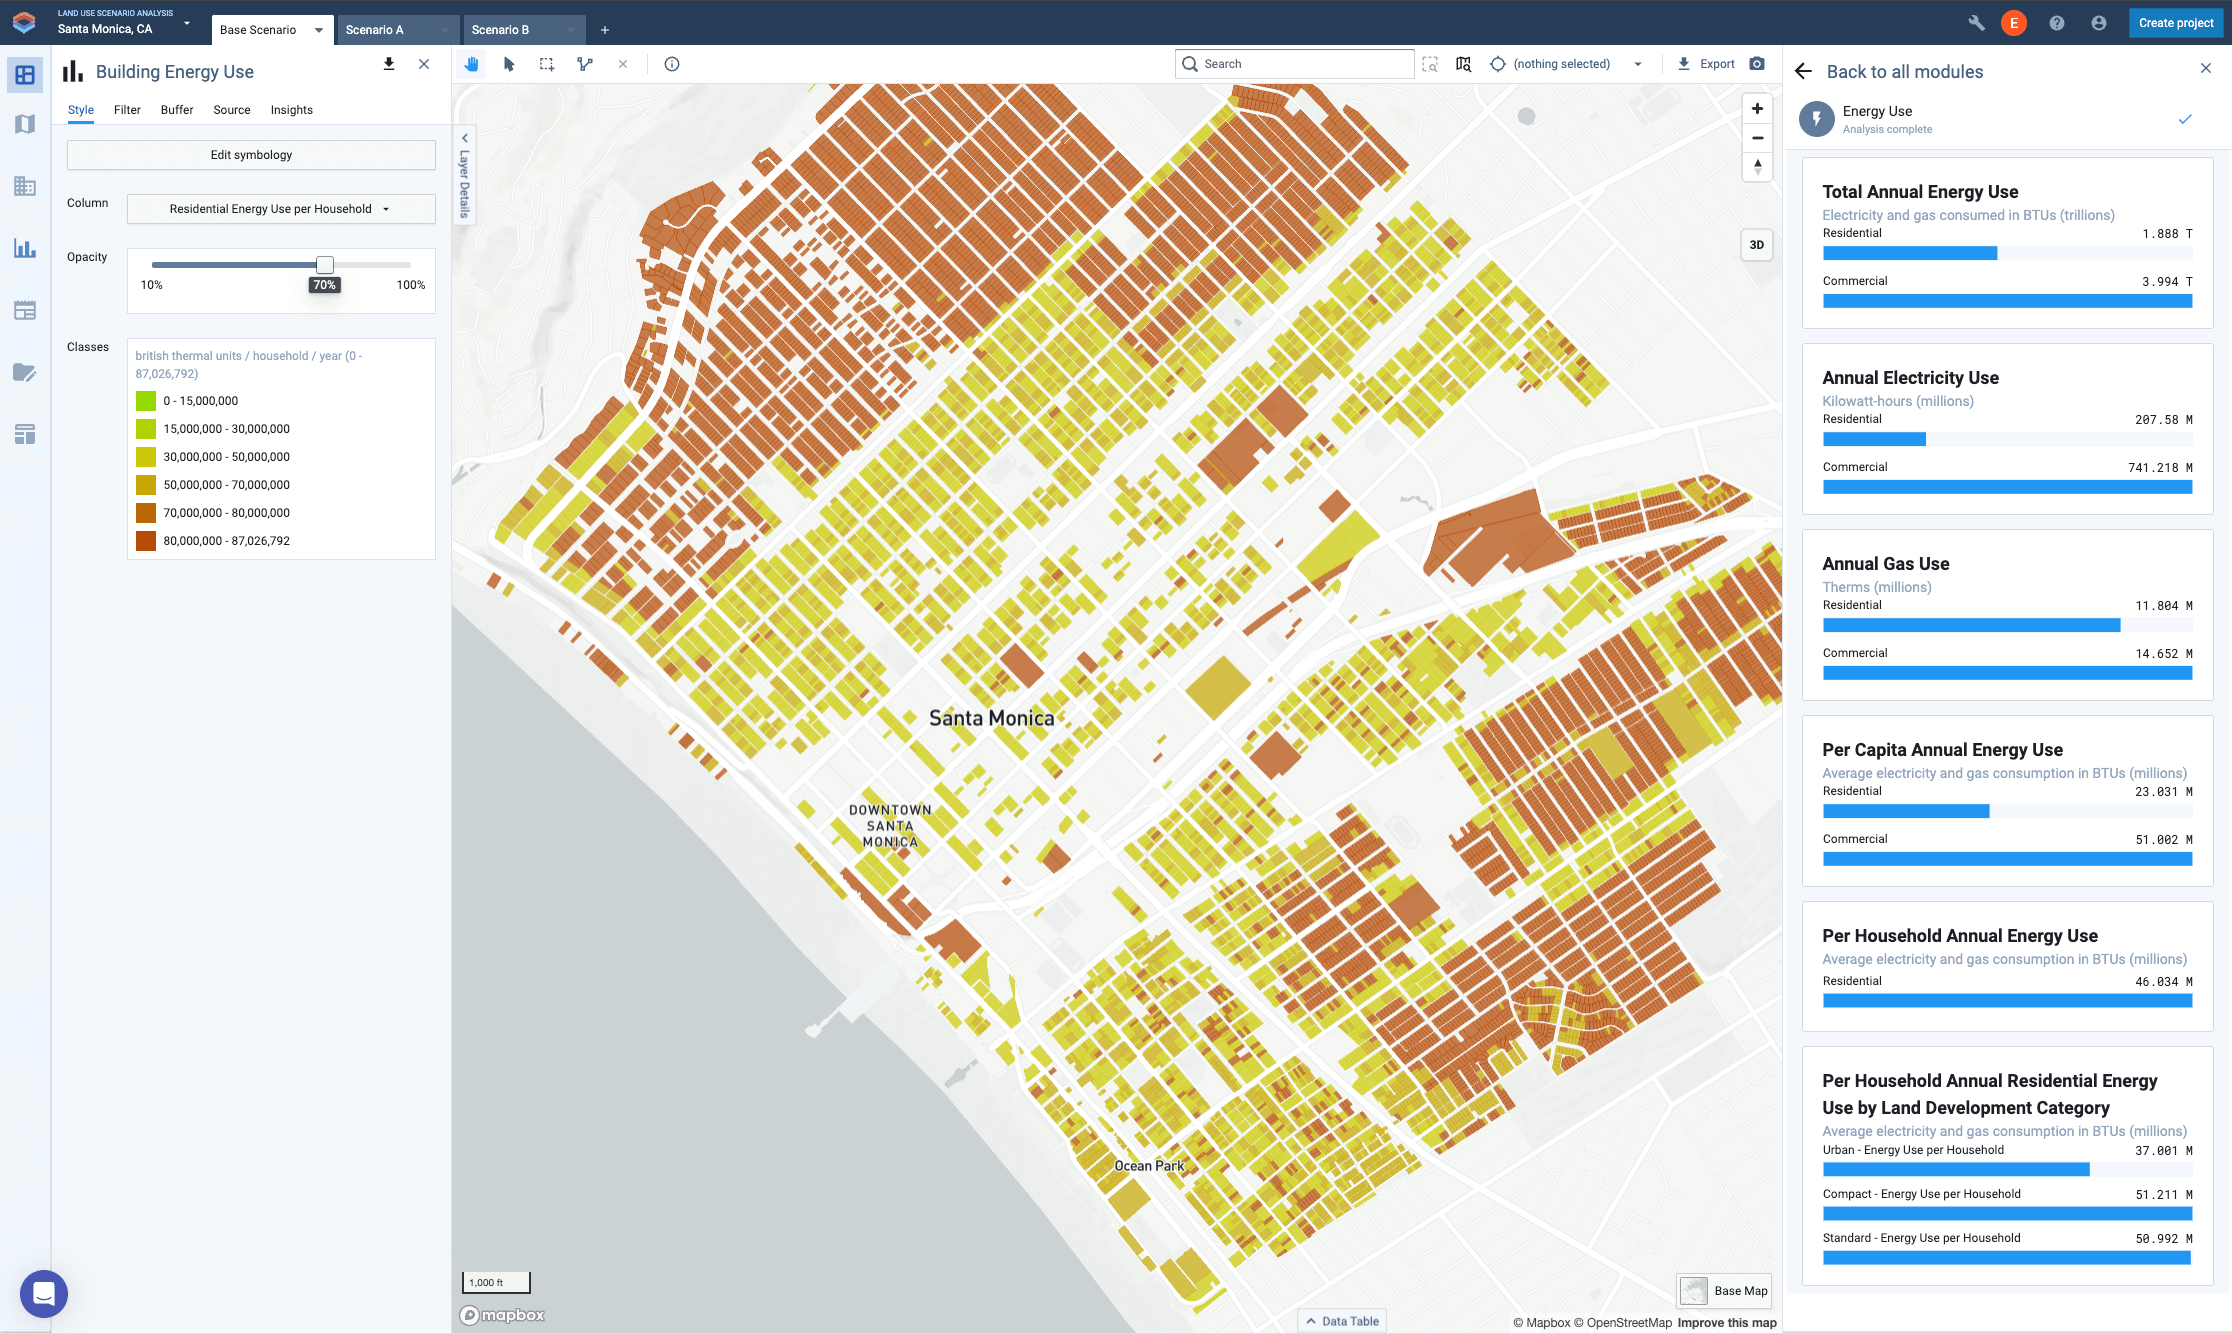
Energy Use, Emissions, and Household Costs Modules: Updated Assumptions
We have also updated data for the Energy Use, Emissions, and Household Costs modules, which help planners assess how land use affects energy use, GHG emissions, and household auto and utility costs.
- Energy Use – updated default assumptions for residential and commercial energy use using the most recent U.S. Energy Information Administration (EIA) and California Energy Commission survey data available
- GHG Emissions – updated default assumptions for CO2e emissions from electricity, natural gas, and auto fuel using EPA Emissions & Generation Resource Integrated Database (eGRID) data
- Household Costs – updated default assumptions for fuel economy and prices using EIA data
For a closer look at how analysis modules like these can support your planning, see: Get More from UrbanFootprint Using Analysis Modules.
Administrative Boundaries: Census 2023 Updates
UrbanFootprint now includes the most up-to-date boundary data from the 2023 Census, ensuring accurate geographic context for your projects. New and updated boundaries include:
- Block groups, tracts, counties, and county subdivisions
- Connecticut’s revised county-equivalent definitions
- 118th Congressional District boundaries (post-2020 Census redistricting)
- School districts, ZIP Code Tabulation Areas (ZCTAs), and census places (including cities, towns, and unincorporated places)
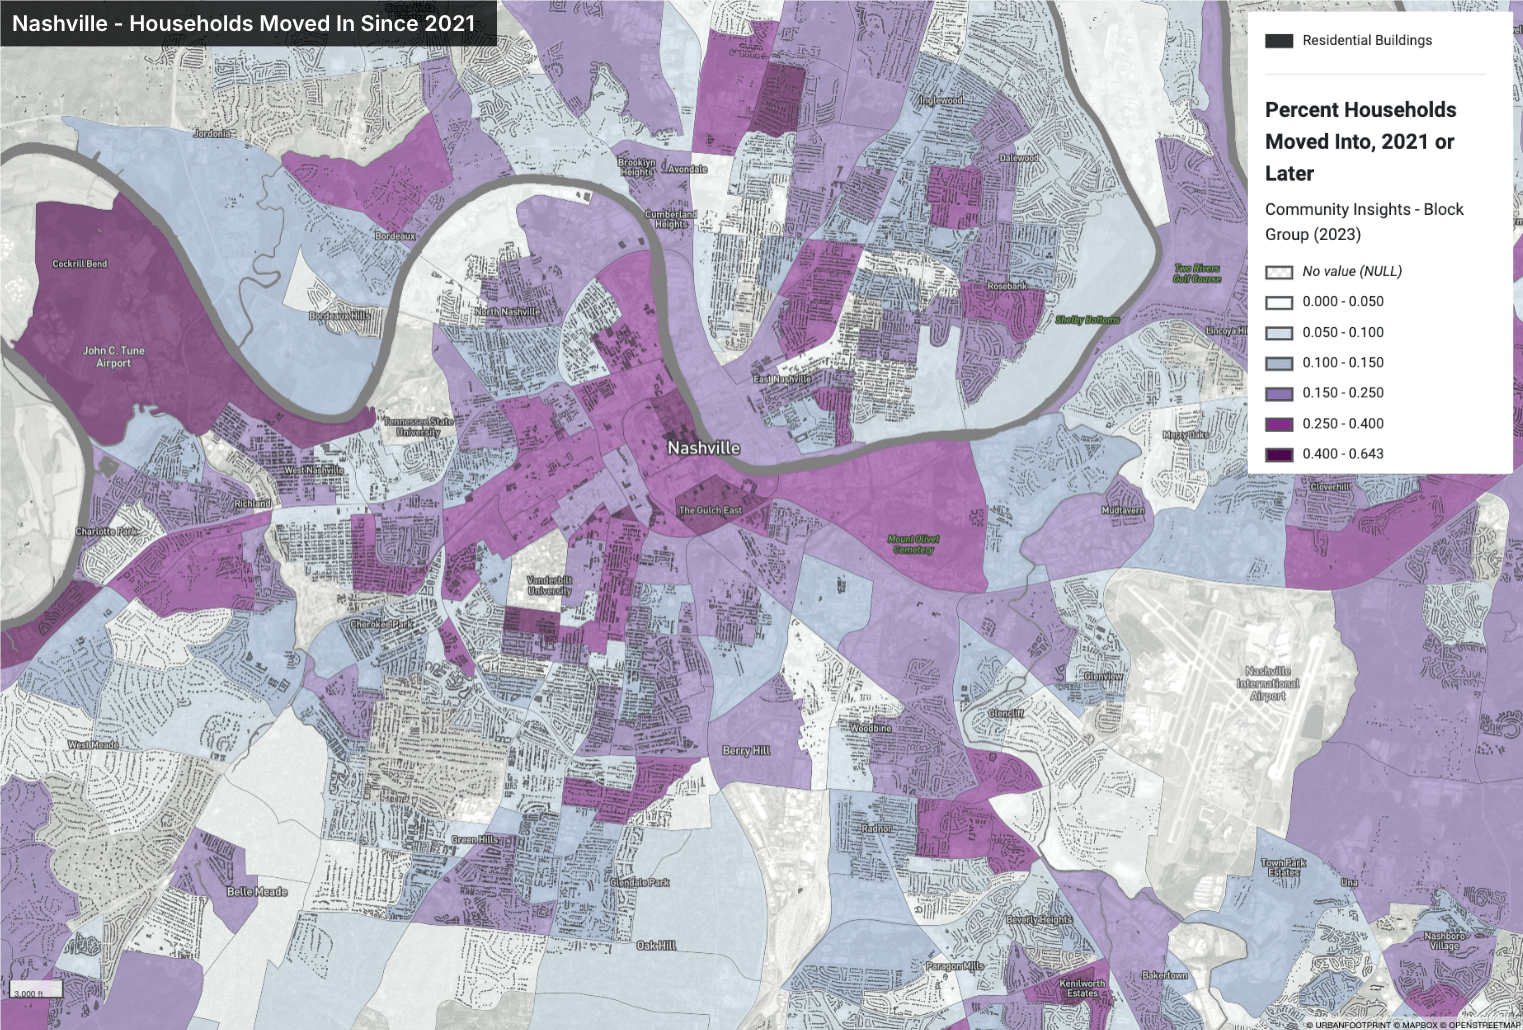
Community Insights: Updates and Expanded Demographic Data
Our Community Insights dataset now includes ACS 2023 5-Year Estimates, giving you a one-stop source for understanding population and households in your project areas. Newly added data include:
- Aggregate and average household income, home values, and household size
- Recent housing moves (where households moved in since 2021)
- Popular statistics from the 2020 Decennial Census, including population, race & ethnicity, and age
This expanded dataset provides even more valuable context, all in one place.
Reference Data Library: Regular Updates
UrbanFootprint provides nationwide, authoritative data from sources like FEMA and HUD, ensuring planners always have access to the latest and most reliable datasets. Some recent updates include:
- Flood Hazard and National Risk Index from the Federal Emergency Management Agency
- Fair Market Rents from the Department of Housing and Urban Development
- Fiber and Broadband Availability by census block, developed using data from the Federal Communications Commission
- Wetlands & Critical Habitat from the Fish & Wildlife Service
- Alternative Fuel Stations & Freight Facilities from the Department of Transportation
We regularly refresh data so that you can focus on analysis rather than data sourcing.
See UrbanFootprint in Action
We’re excited to bring you these updates – and there’s more to come. Want to explore the new data in action?
Book a demo to see how UrbanFootprint can streamline your analysis and decision-making.
Have ideas for new features? We’d love to hear from you! Send us an email with your thoughts.
