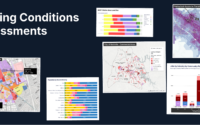
Introducing the new UrbanFootprint Existing Conditions Dashboard – one of our most exciting recent additions to the Analyst application. Built to dramatically reduce the time needed to perform essential current conditions assessments in any U.S. location, the new dashboard brings together vital information and compelling visuals across a range of topic areas with just a couple of mouse clicks. It includes profiles of population, employment, and land use so you can quickly home in on insights that matter. Whether you’re preparing a proposal, kicking off work on a comprehensive plan, or aligning stakeholders around key metrics, the new dashboard can save you time and sharpen your focus from the start.
In this post, we’ll introduce you to the dashboard – what it contains, how to create one, and how you can use it to quickly assess and communicate information about the communities you’re serving.
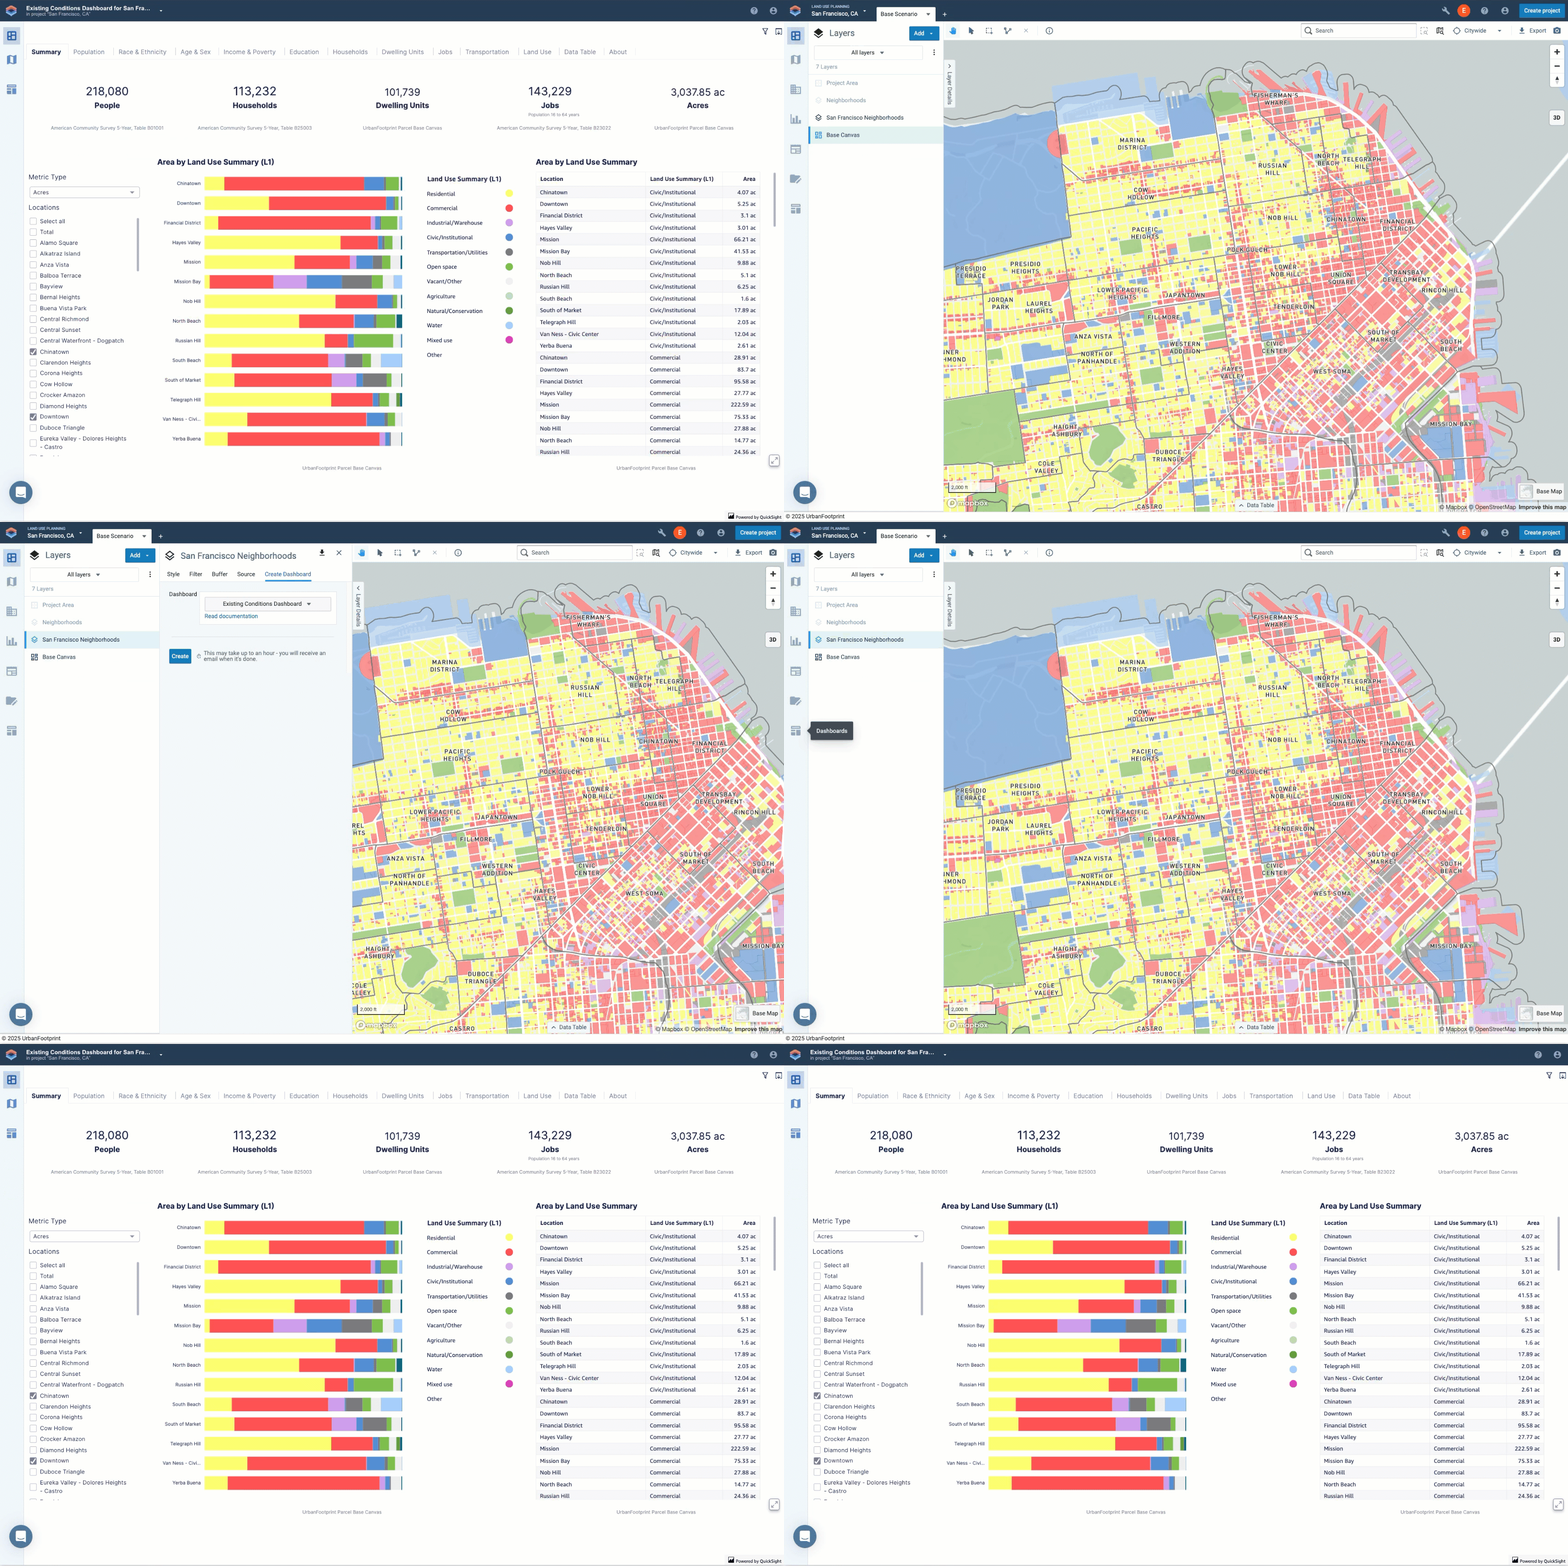
Built for Planners – Built for Speed
Assessments of existing conditions are part of almost every urban planning, design, and real estate project. They are fundamental for understanding context and informing planning and policy development. But these assessments typically take far more time and resources than they should to complete.
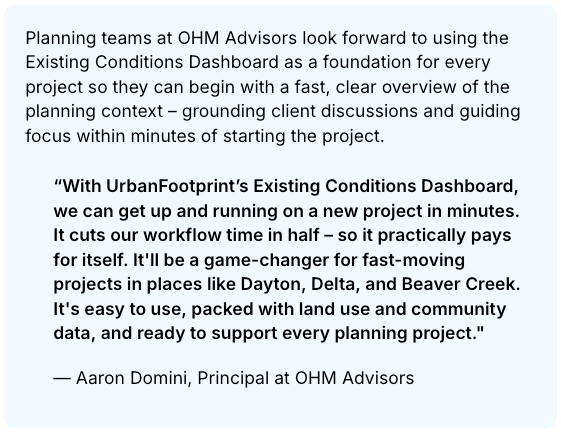
The new Existing Conditions Dashboard is designed to substantially reduce the time needed to assess and report on current conditions in any U.S. location. We talked with planners and designers about their needs and the common challenges of wrangling and assembling data from multiple sources and across geographies. The Existing Conditions Dashboard is the solution: it streamlines assessments by using data from the UrbanFootprint Base Canvas and the American Community Survey – core data already integrated into the UrbanFootprint platform – to provide a consistent foundation of metrics in any location.
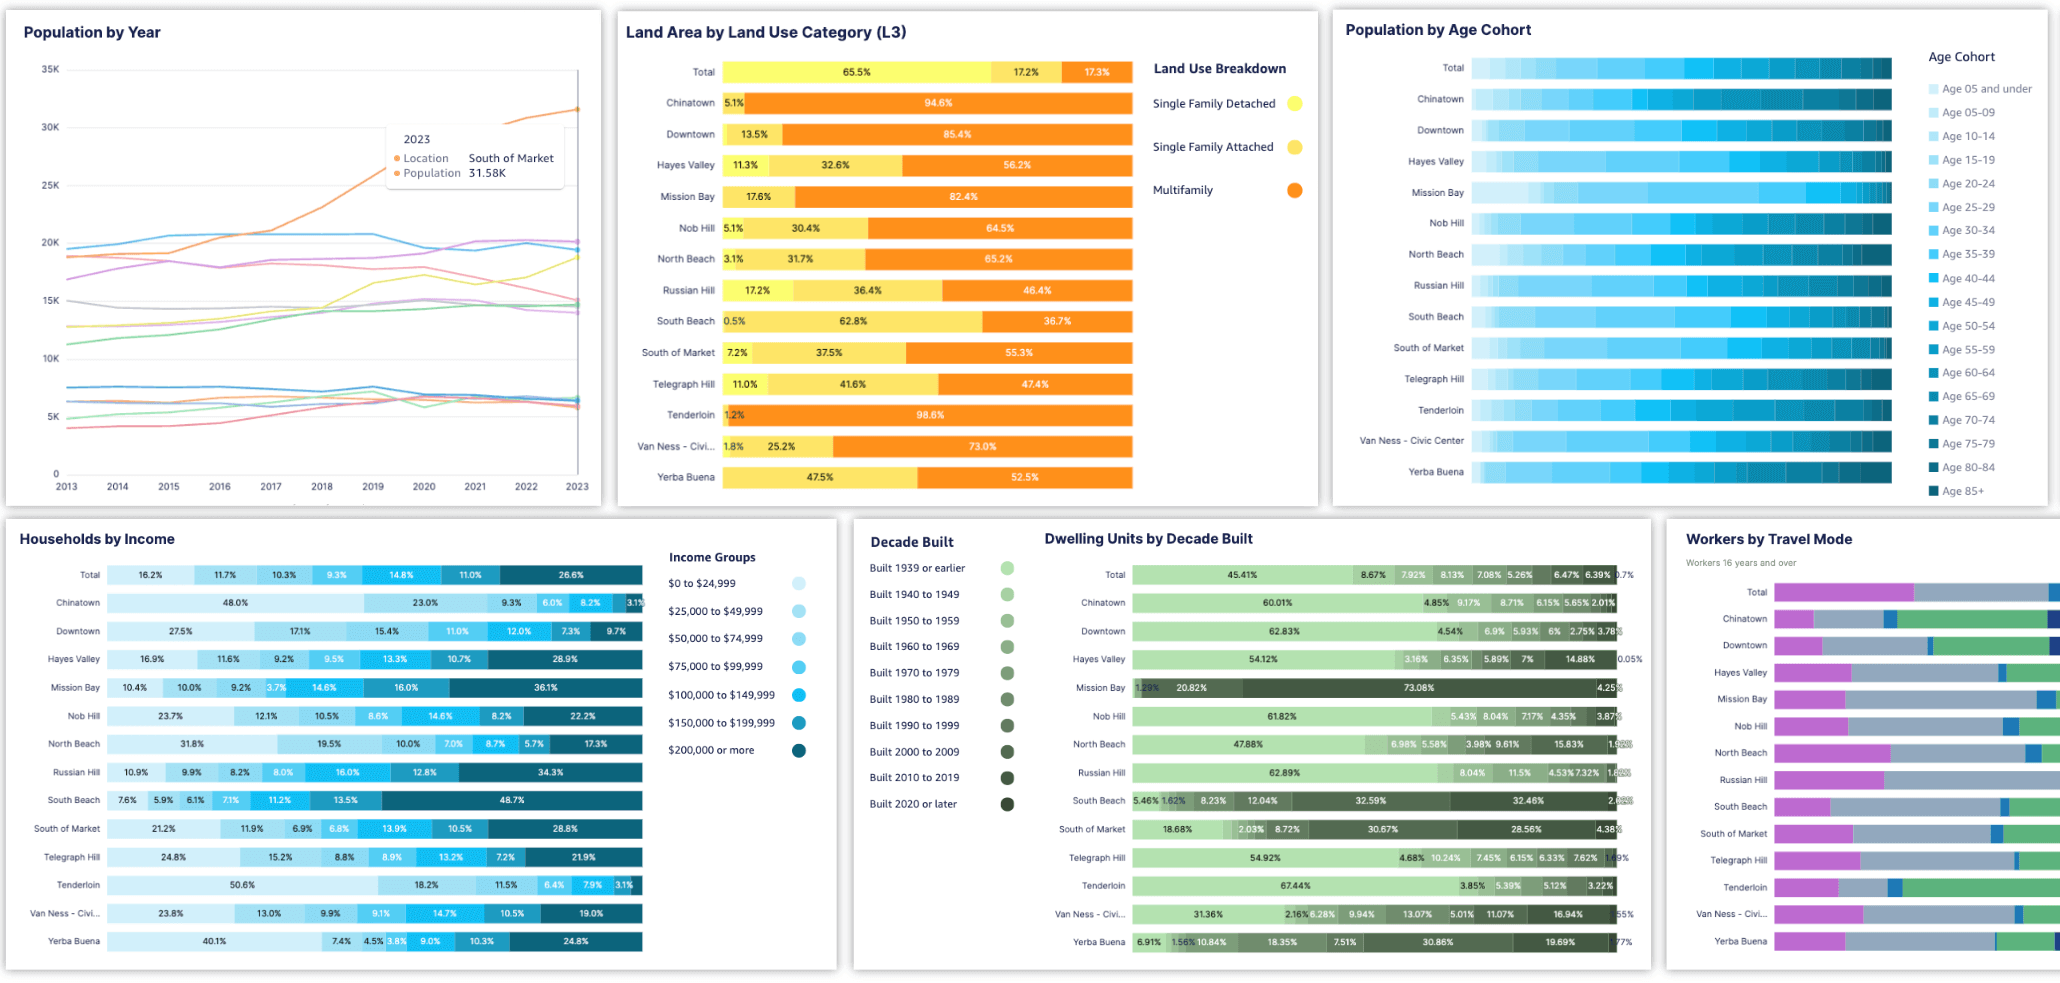
A user designates the areas they want to assess, and UrbanFootprint automatically gathers data and creates a full suite of charts and tables ready for reporting that sets the stage for deeper geospatial analysis. A dashboard can be created for any number of neighborhoods, districts, or subareas.
New Dashboards Support A Range of Project Applications
The new Existing Conditions Dashboard drives speed and depth for a wide range of planning and design projects:
- Comprehensive Plans – Generate dashboard charts and data by neighborhood or community planning area for existing conditions reports.
- Regional and MPO Planning – Compare counties, cities, or districts within a region and identify jurisdiction-level trends and disparities.
- Transit-Oriented Development – Generate and compare profiles of existing conditions in station areas.
- Grants and Proposals – Pull high-impact visuals and consistent data to strengthen project justifications and stakeholder engagement.
- Collaboration and Stakeholder Engagement – Export dashboards to share as PDF files, copy individual dashboard charts into documents and presentations, or export the summary data to share. Use dashboards in collaboration with project partners to ensure you’re aligned on the same data. You can even share live dashboards directly with clients or stakeholders (with UrbanFootprint user access) so they can interact with the data themselves.
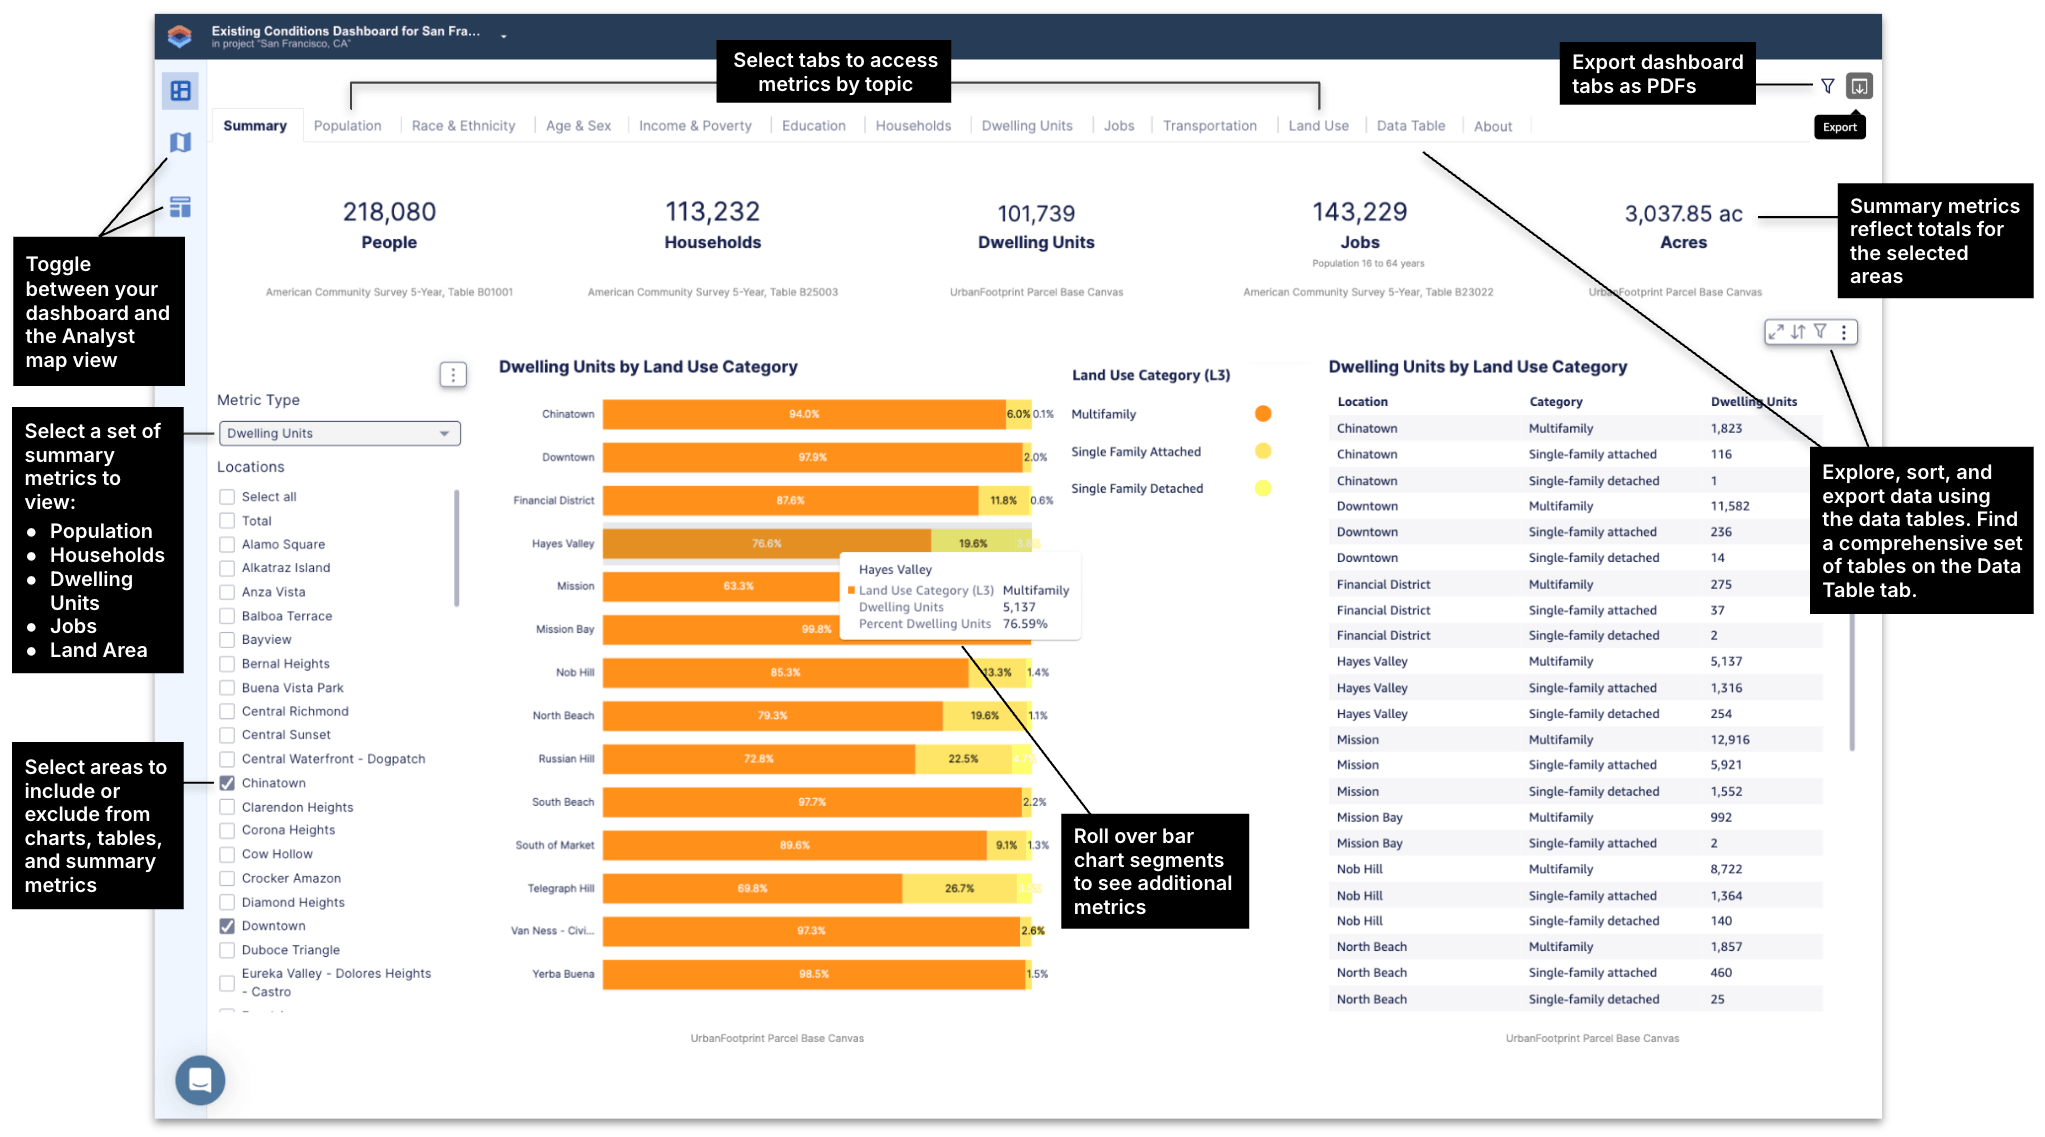
Seamlessly Integrated in UrbanFootprint Analyst
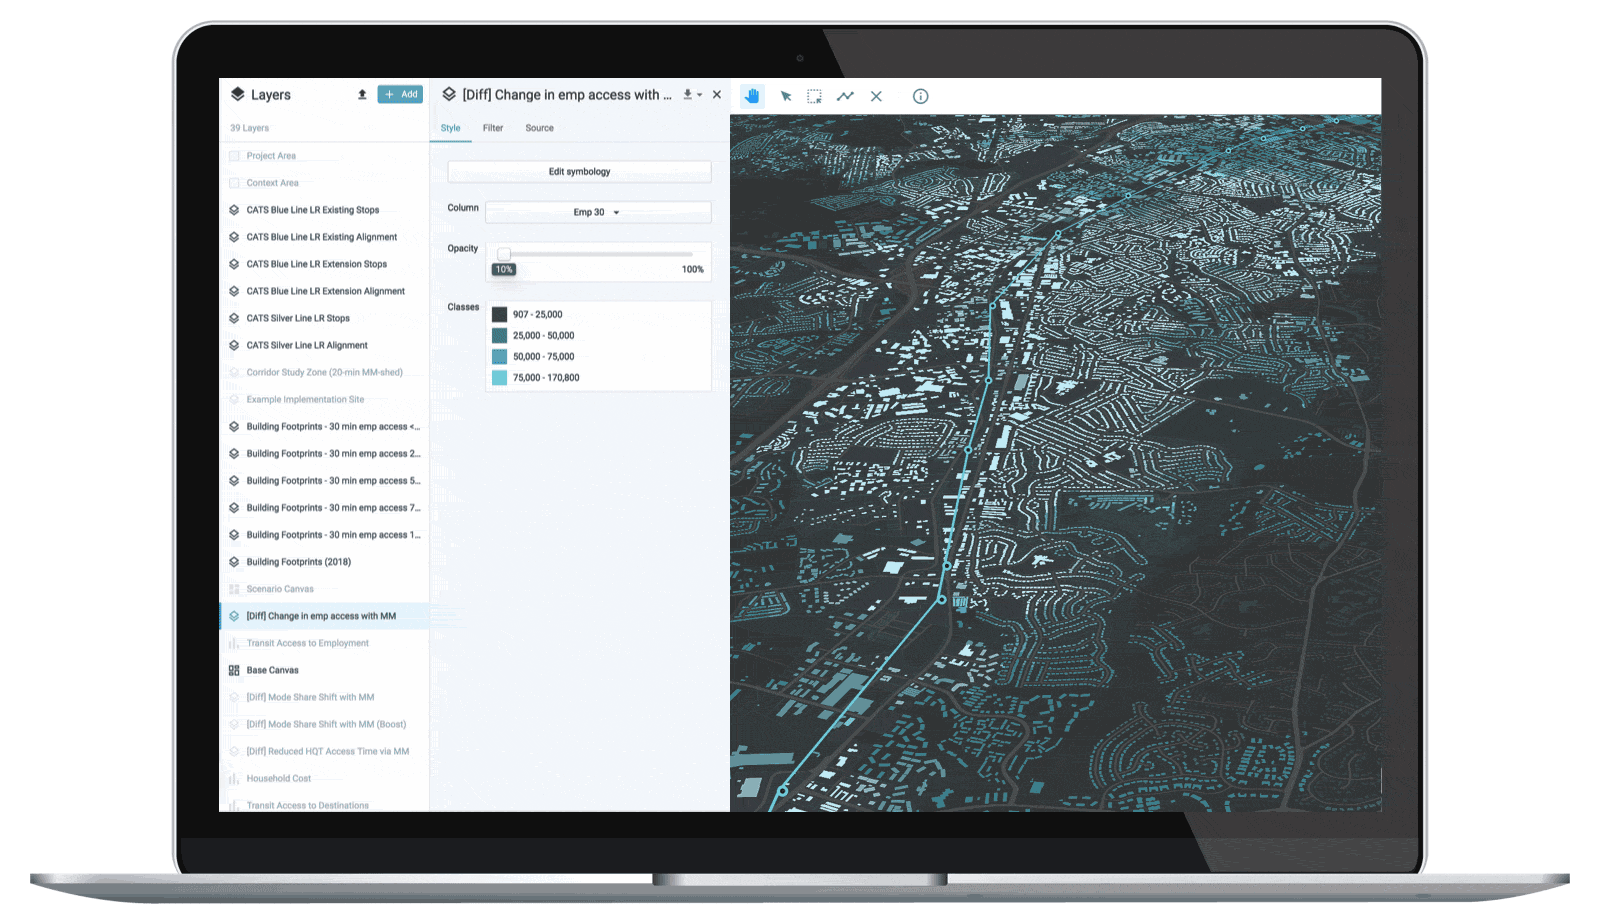
The new dashboard complements Analyst’s powerful and easy-to-use mapping and scenario planning capabilities. It expands what you can do in the platform, saving you time with charts and summary metrics that can be used alongside maps and analysis results.
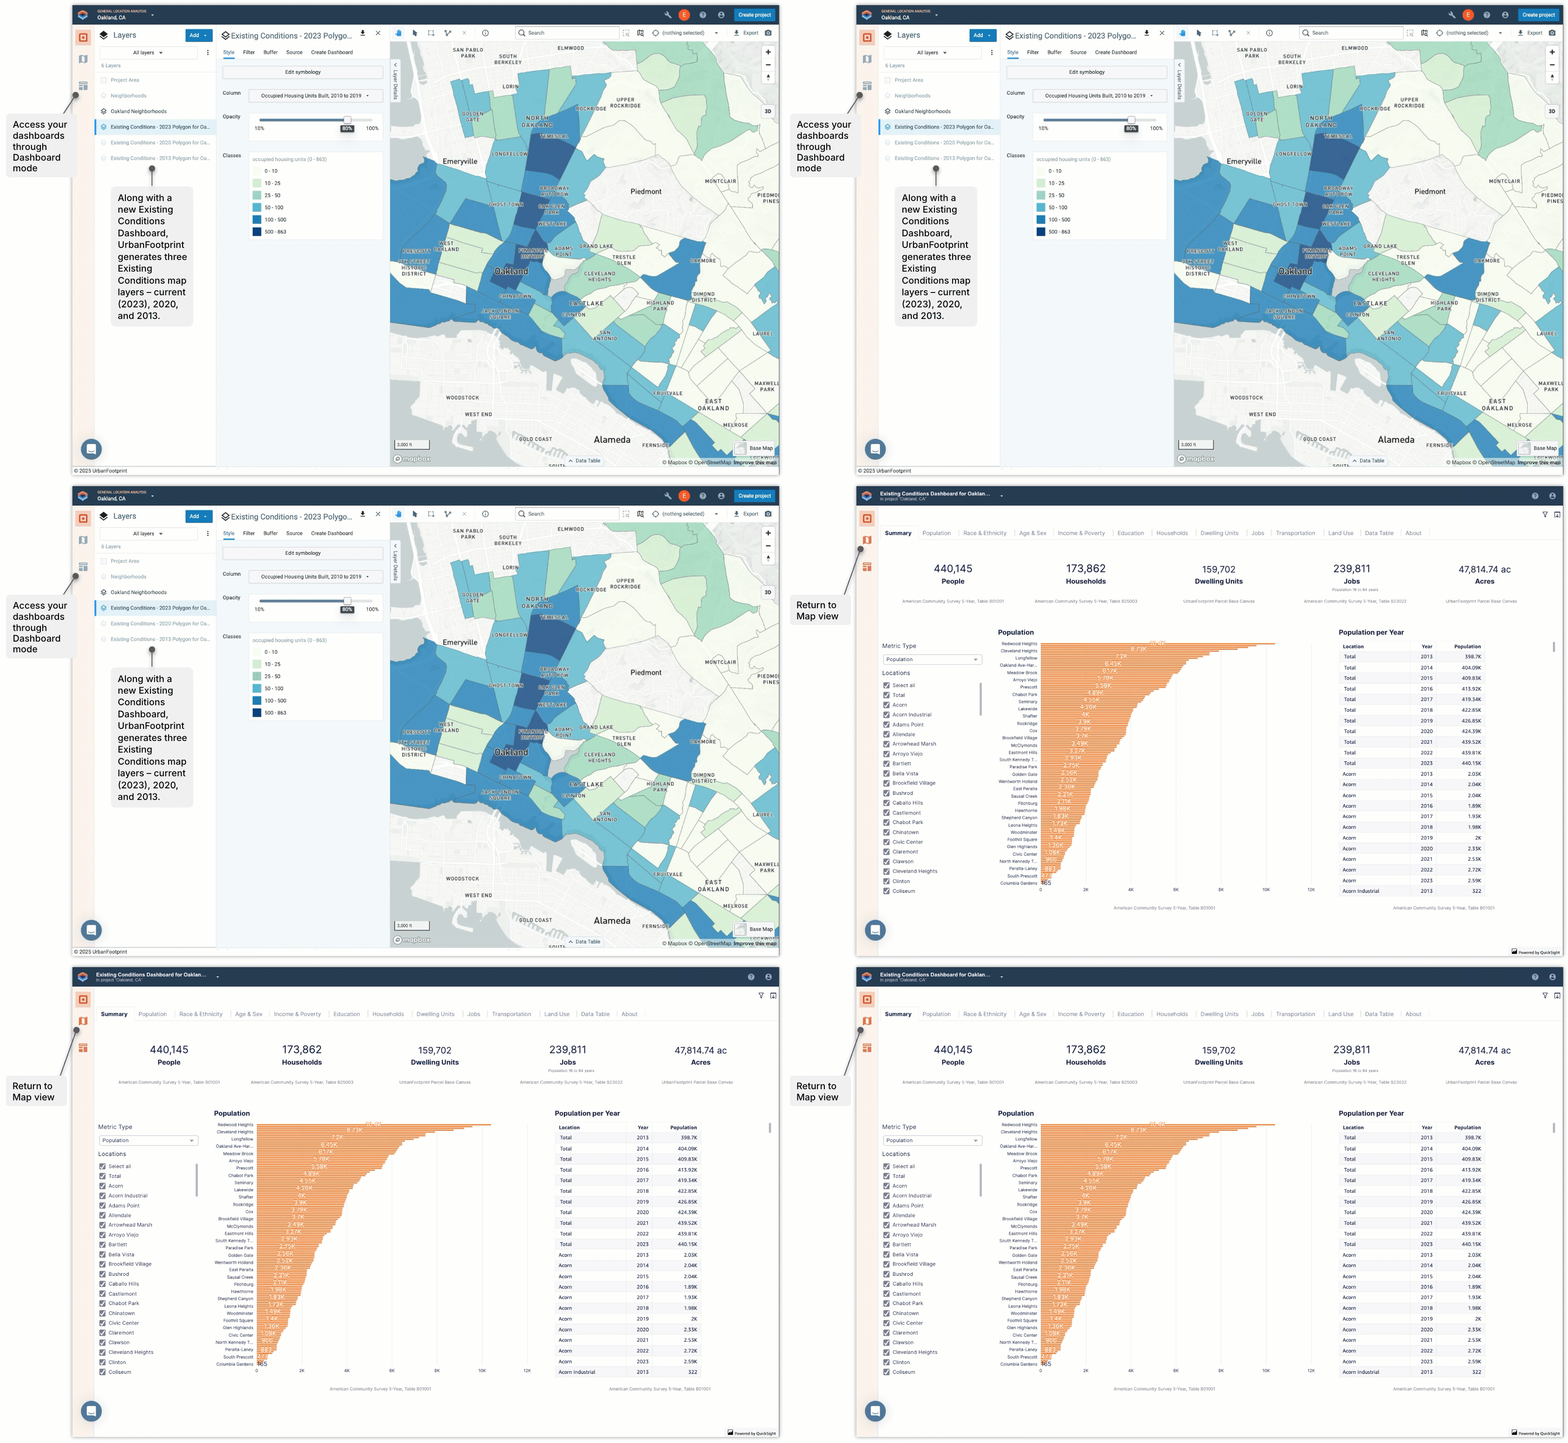
Metrics that Matter – What the Dashboard Includes
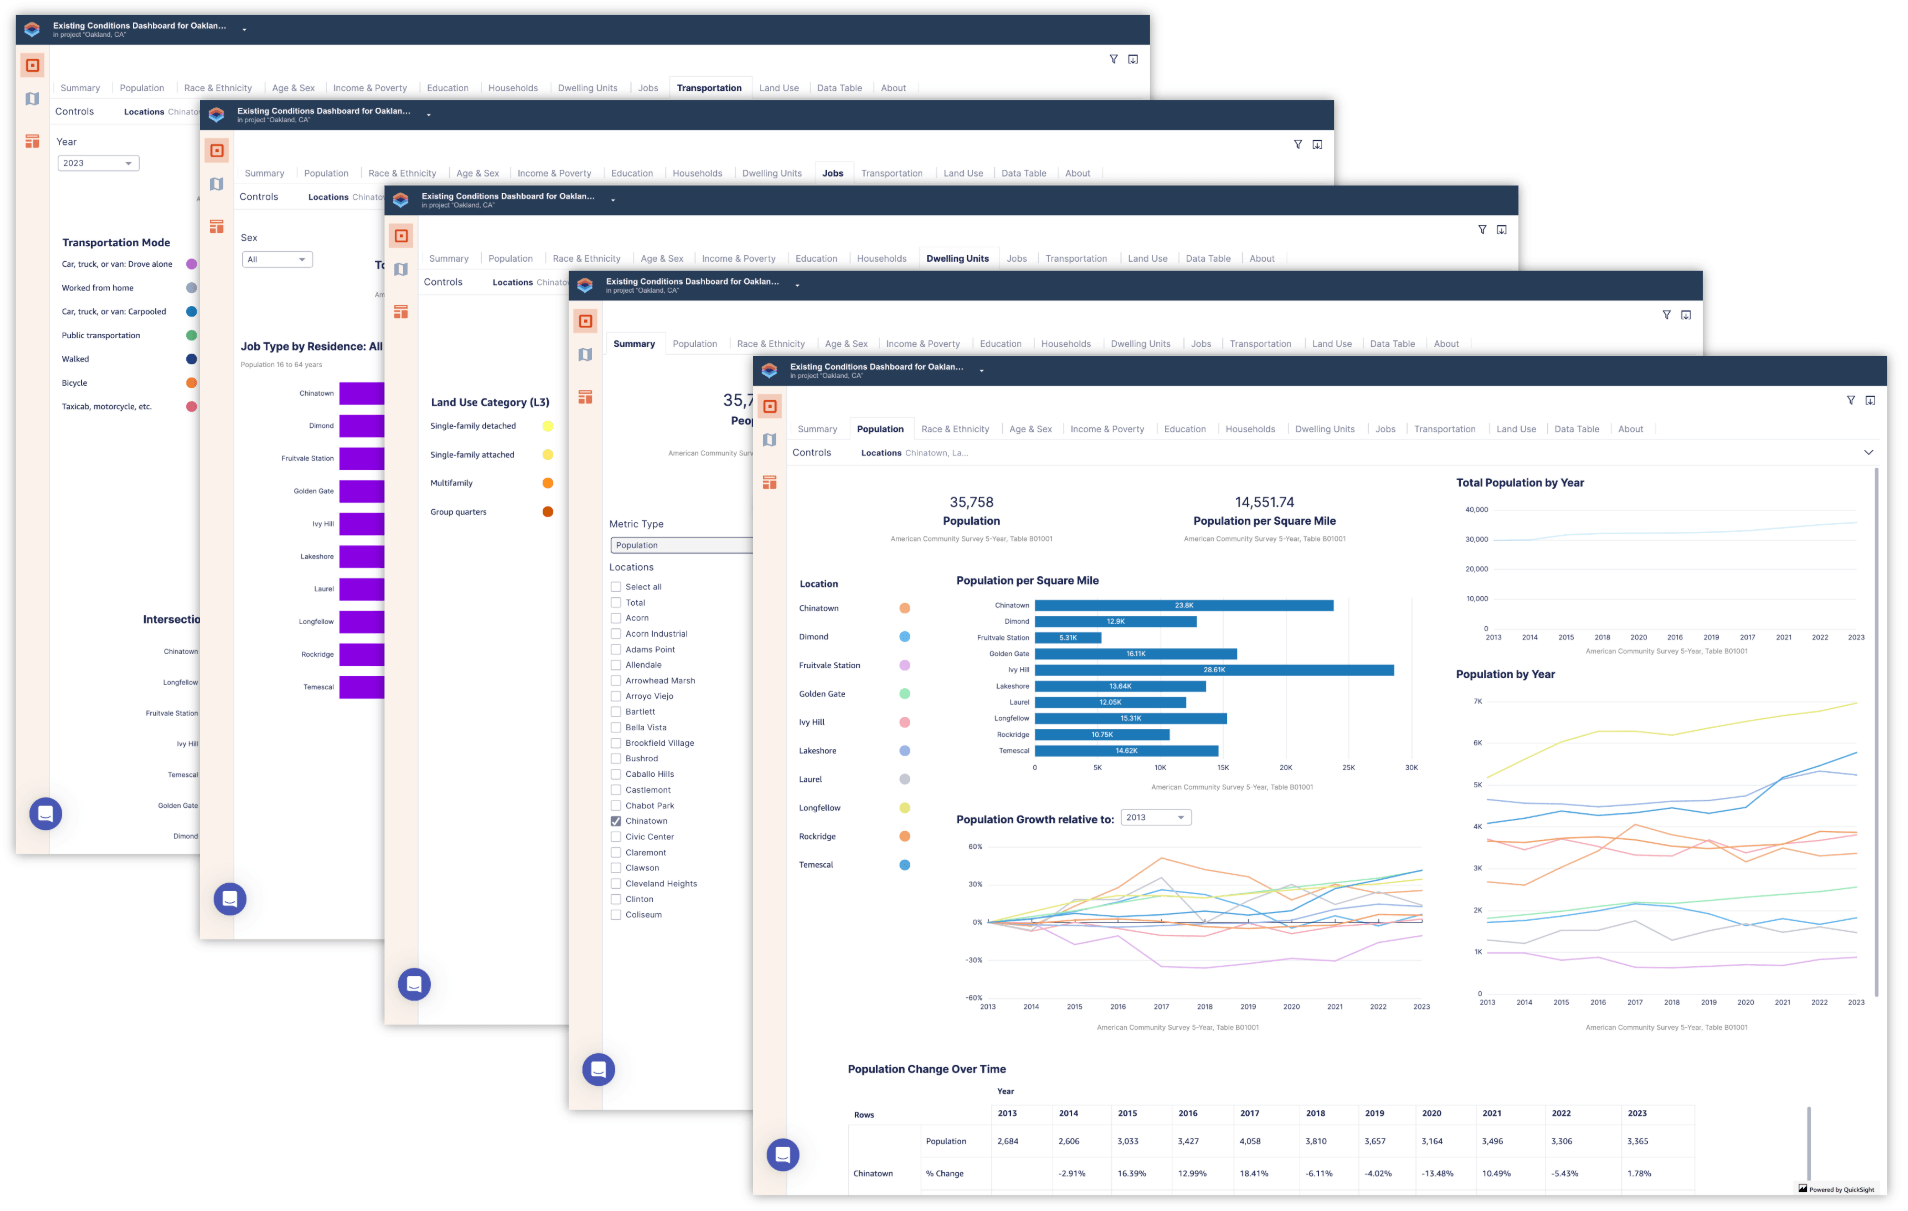
The Existing Conditions Dashboard brings together a suite of socio-demographic and land use data for any U.S. location. It draws from the UrbanFootprint Base Canvas – a highly detailed data assembly containing key land use and building metrics for 160 million U.S. land parcels – and the latest American Community Survey (ACS) 5-year estimates from the U.S. Census. Data is cleanly organized in tabs by theme, including:
- Summary – Population, households by tenure, dwelling units by land use category, jobs by industry, parcel area by land use category
- Population – Population by year, population change relative to a selected year (as early as 2013), and population density
- Race & Ethnicity – Population by race and ethnicity
- Age & Sex – Population by age group and sex
- Income & Poverty – Population by poverty level and households by income group
- Education – Educational attainment for adults 25 and older
- Households – Households by tenure and household sizes
- Dwelling Units – Dwelling units by type and decade built
- Jobs – Jobs and employed residents by industry, and work status of residents
- Transportation – Workers by travel mode and intersection density
- Land Use – Parcel area by land use category at two levels of detail (UrbanFootprint’s L1 and L3 categories), and building floor area by residential type and commercial sector
How to Get Started
Creating an Existing Conditions Dashboard is easy once you’re in UrbanFootprint Analyst. Dashboards can be created in any project, whether new or existing – all you need is a layer containing the area(s) that you want analyzed. You can use one of the reference data layers already available in the platform (for example, Neighborhoods or Zip Code Tabulation Areas), or upload a spatial data layer of your own. There are some guidelines around analysis area sizes; please see our Quick Start Guide or help documentation for more details.
Once you have a layer to use:
- Select the layer, which opens the Layer Details pane.
- Click on the Create Dashboard tab.
- Click Create.
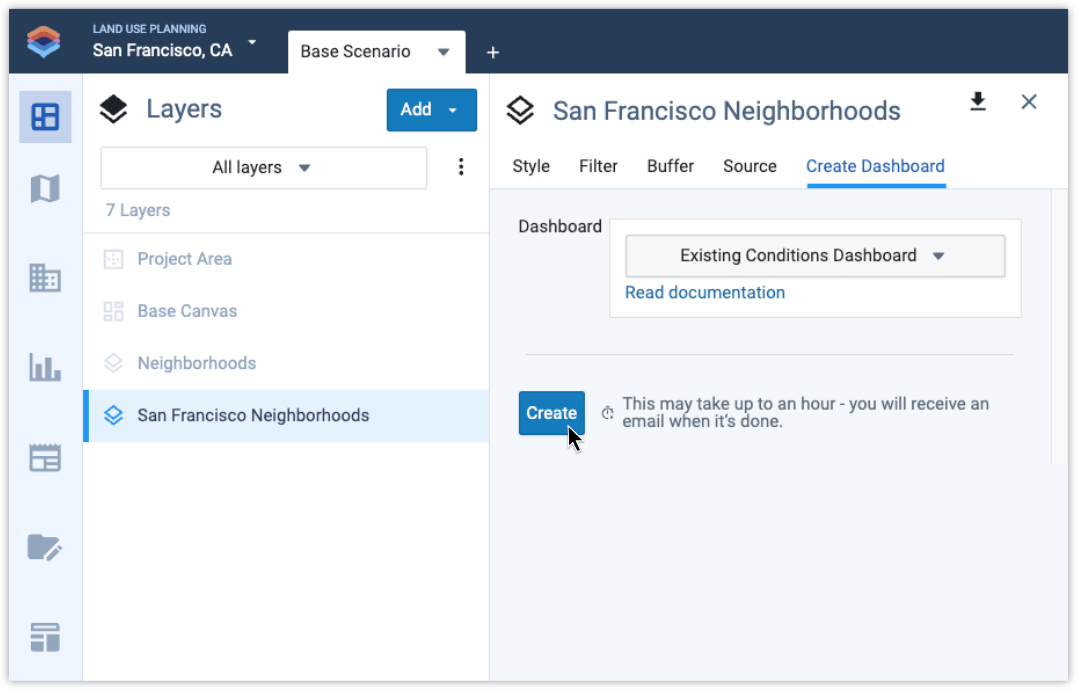
That’s it! It takes about 15 minutes to create a dashboard, or a bit longer if you have large areas. When the dashboard is complete you’ll receive an email with a link to view it.
Start exploring the Existing Conditions Dashboard today and see the impact it can have on your work. Your feedback helps us refine our products, so don’t hesitate to connect and share your ideas.
Save Time. Tell a Great Story. Move Projects Forward Faster.
The Existing Conditions Dashboard is available now in UrbanFootprint. From proposals to stakeholder engagement to final reporting, this new dashboard delivers essential insights – curated, visual, and built for planners.
Want to see it in action? Schedule a walkthrough with our team or log in to try it now.
