


UrbanFootprint’s new Existing Conditions Dashboard is built to support a wide range of planning workflows – all from a single, trusted platform. Read on to see how you can use the dashboard in your work.

Faster and Deeper Existing Conditions Analysis
Local or regional plans, transit-oriented development (TOD) planning, real estate investment and site selection – they all require baseline information about demographics, housing, land use, transportation, and employment. The new Existing Conditions Dashboard quickly assembles and presents essential metrics across all these topic areas and sits alongside the mapping and analysis capabilities already available in UrbanFootprint.
With just a couple clicks, UrbanFootprint delivers metrics for any U.S. location, producing data for any combination of neighborhoods, districts, cities, counties, or custom geographies. You can quickly create dashboard charts and metrics to get a head start on proposals, and dramatically cut the time it takes to perform existing conditions assessments for any type of planning project.
All you need is a layer containing the areas that you want analyzed. You can use one of the reference data layers already available in the platform (e.g., Neighborhoods or Zip Codes), or upload a layer of your own. Below are examples of the dashboard’s output and capabilities across five key topic areas: Demographics, Housing, Land Use, Transportation, and Employment.
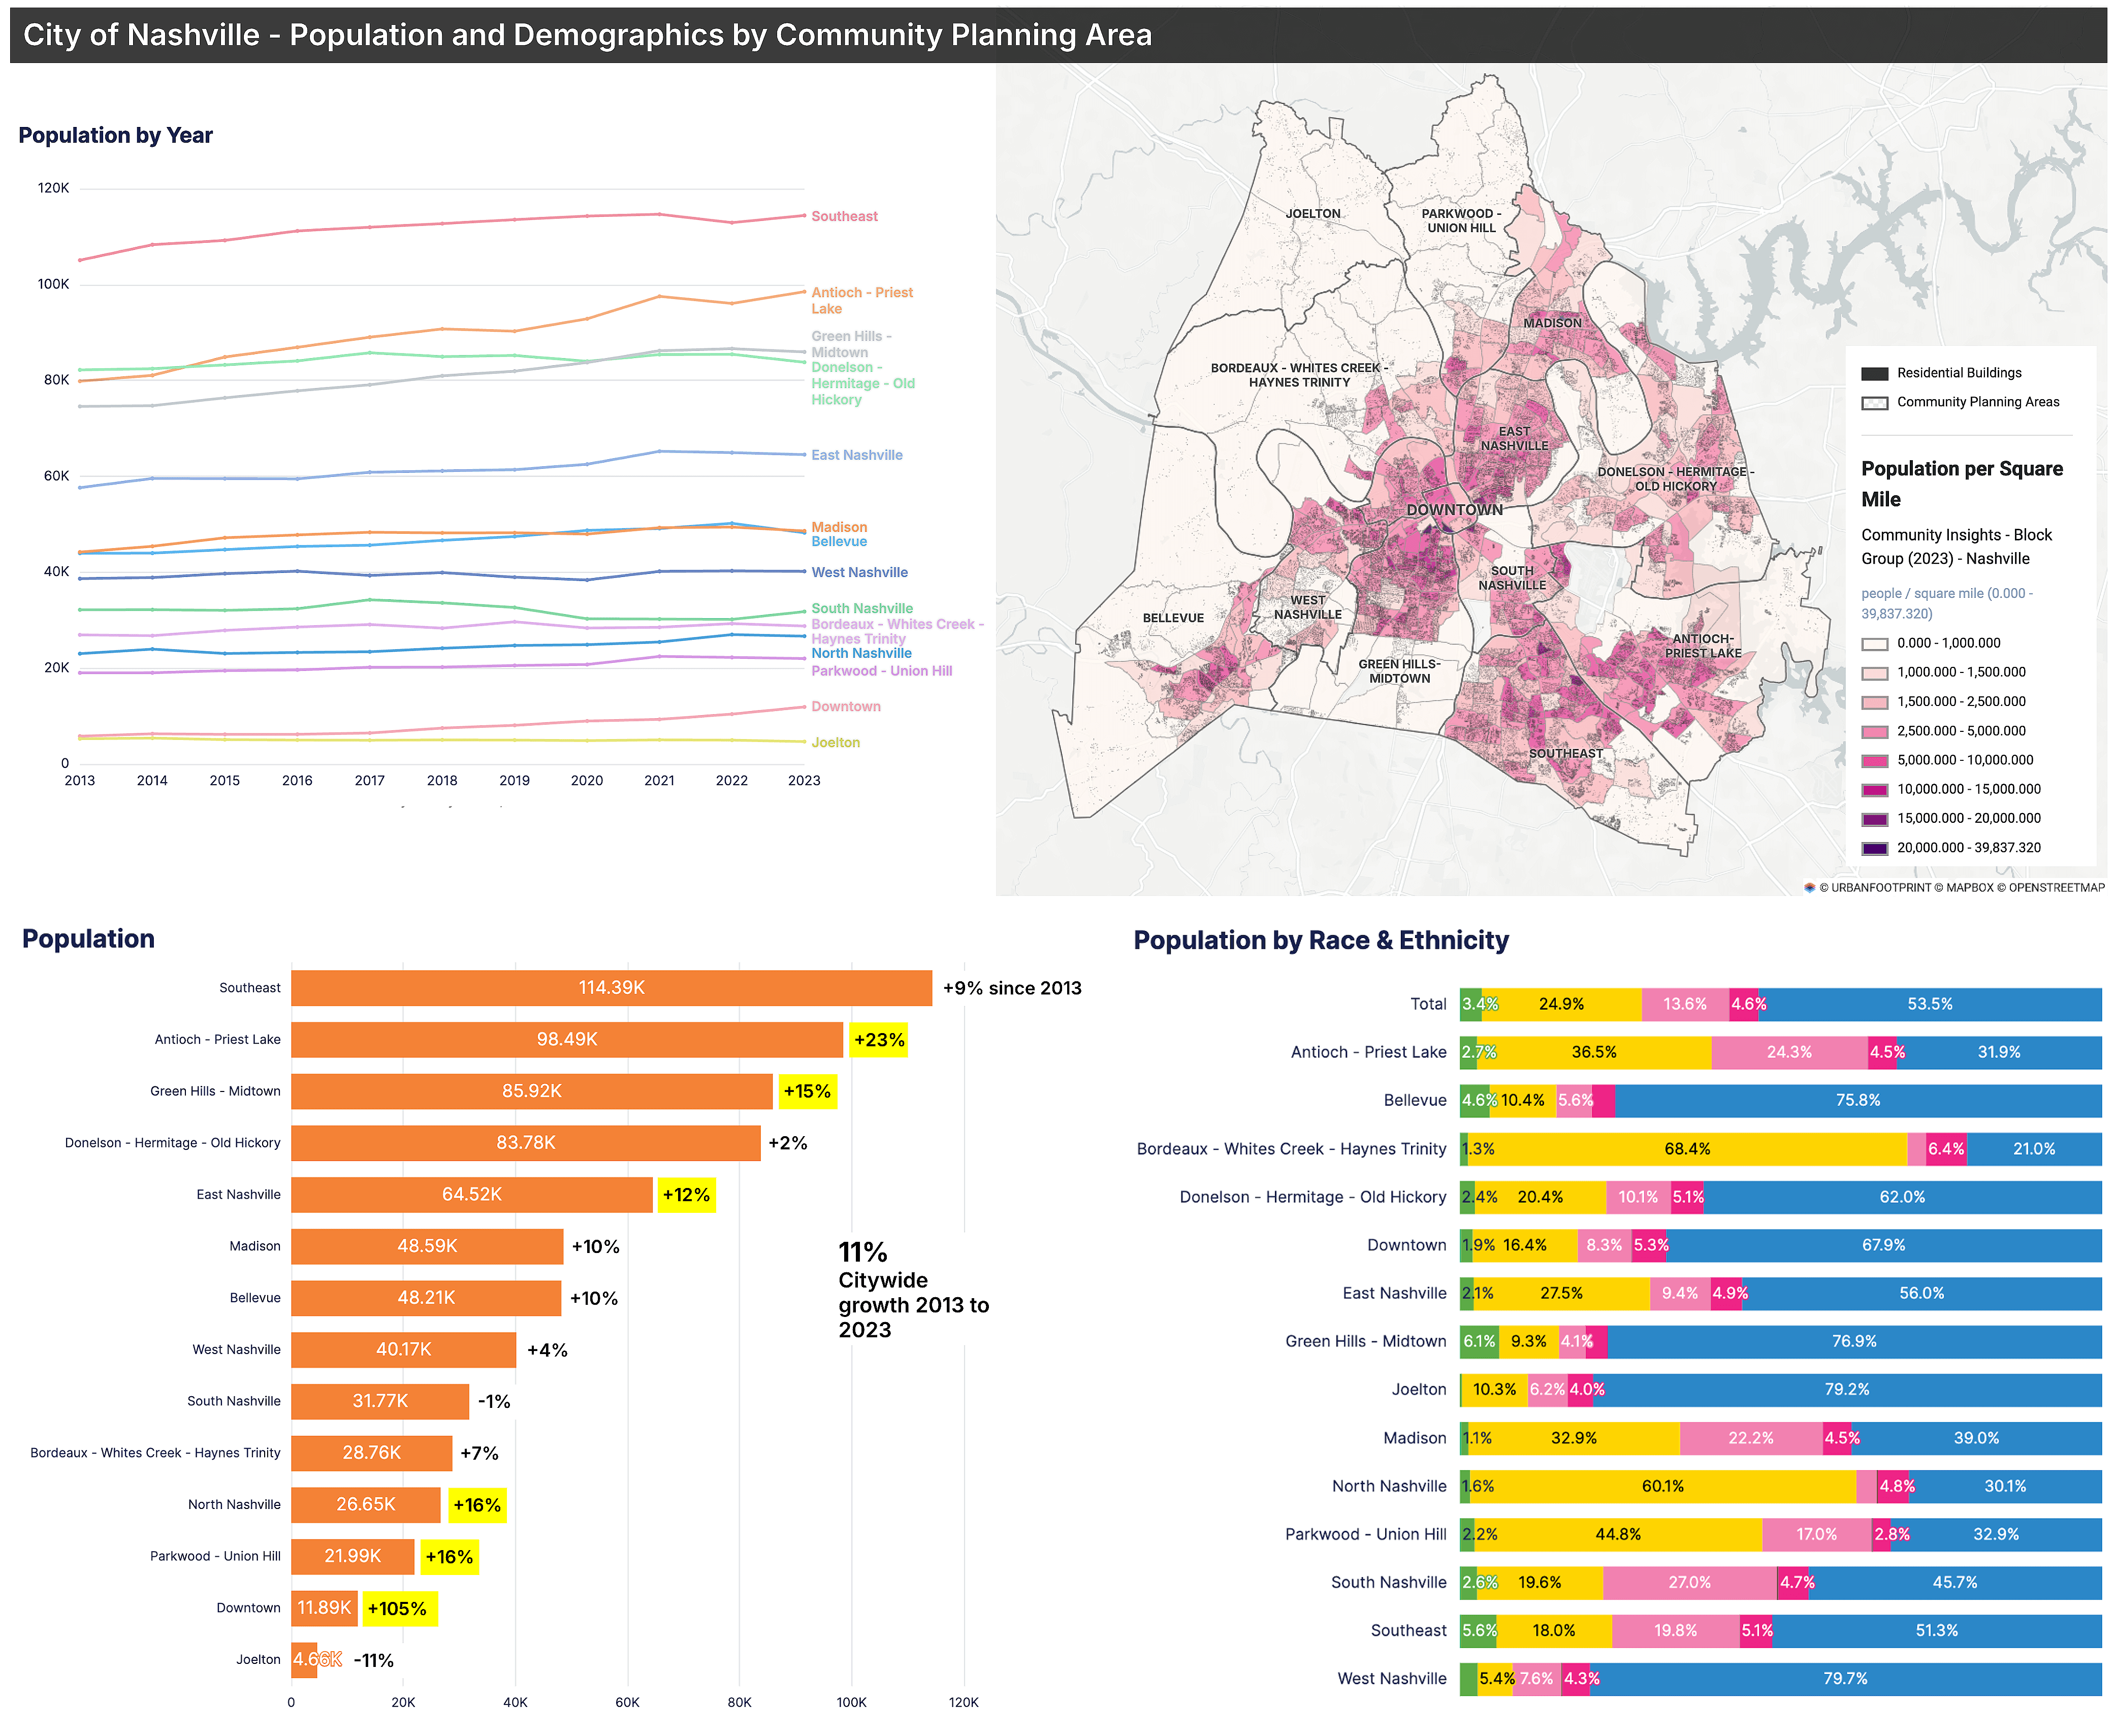
Demographics
The Existing Conditions Dashboard features demographic information across five categories: Population, Race & Ethnicity, Age & Sex, Income & Poverty, and Education. The Population tab includes charts and data that track population changes over time, providing comparative insights at a glance.
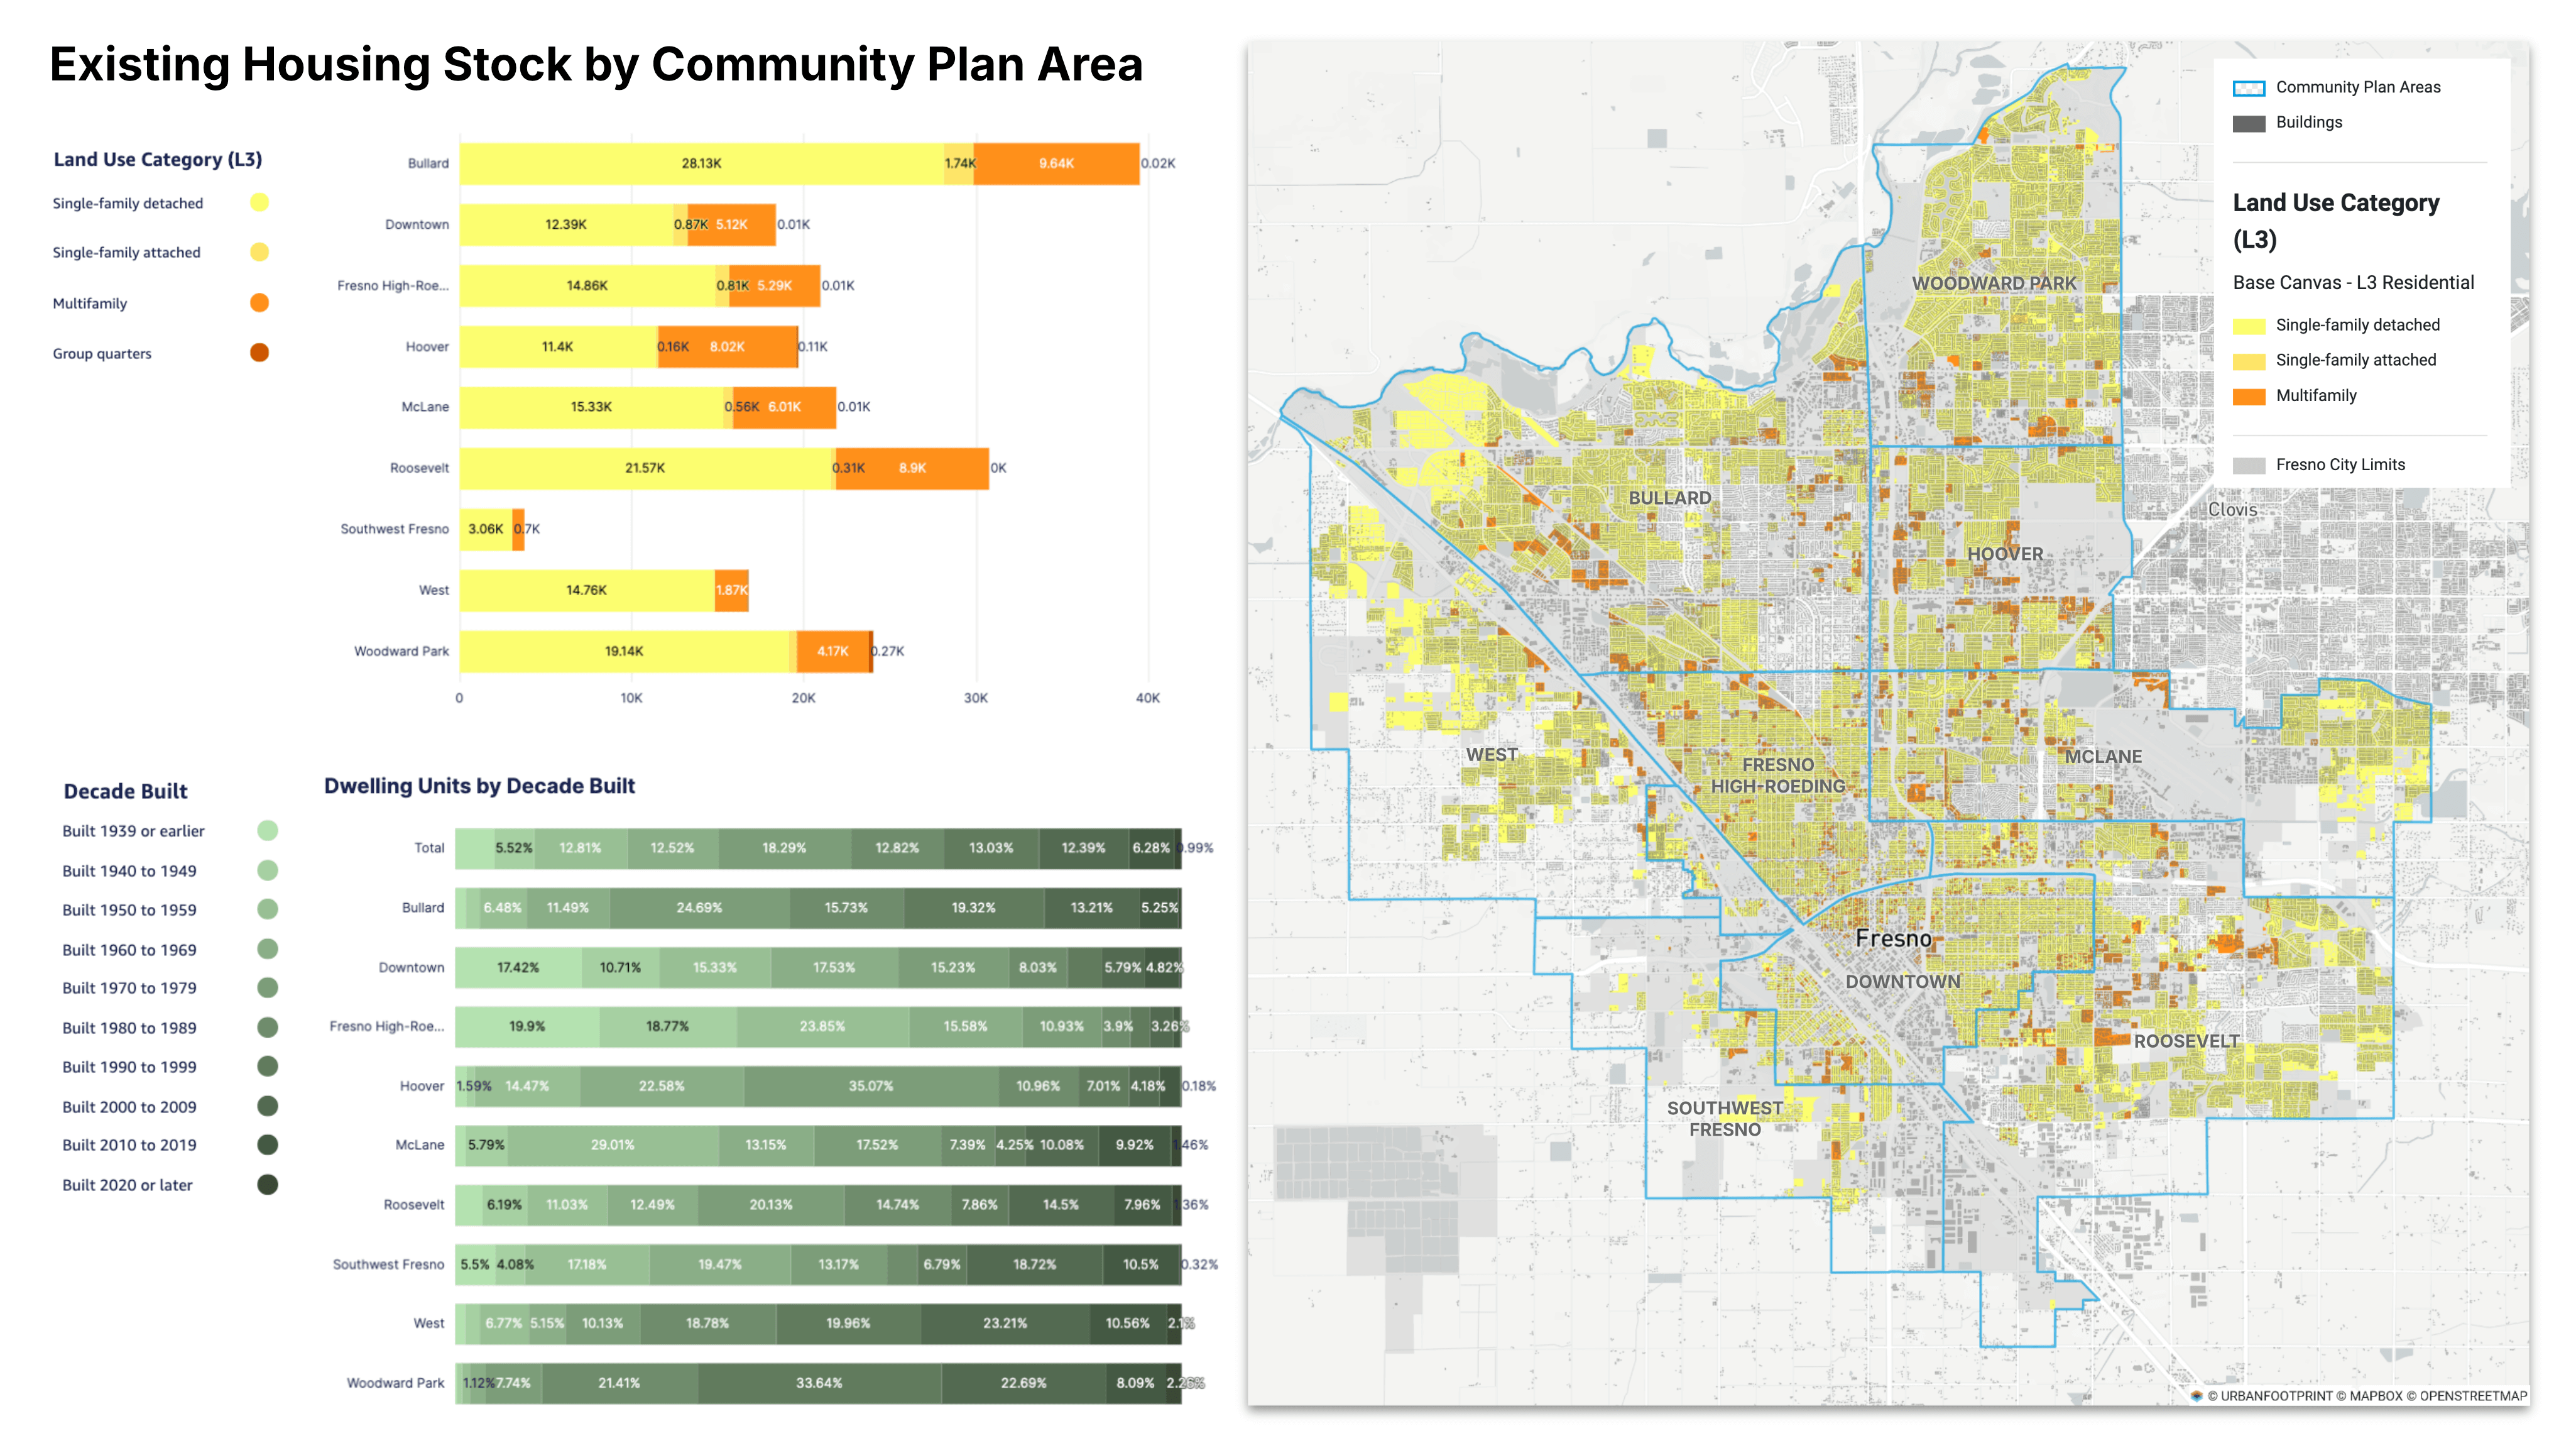
Housing
To support assessments of existing housing, the dashboard includes metrics on dwelling units and land area by housing type (e.g., single family detached, single family attached, and multifamily), units by decade built, the mix of units by type, housing tenure (owner or renter occupancy), and average household size.
The residential land use and dwelling unit data are derived from the UrbanFootprint Base Canvas, which you can map for a corresponding visual assessment of housing locations. Going further, you can use the Parcel Reference Data layer for additional mapping and analysis, for example to visualize residential property values or construction year at the parcel level.
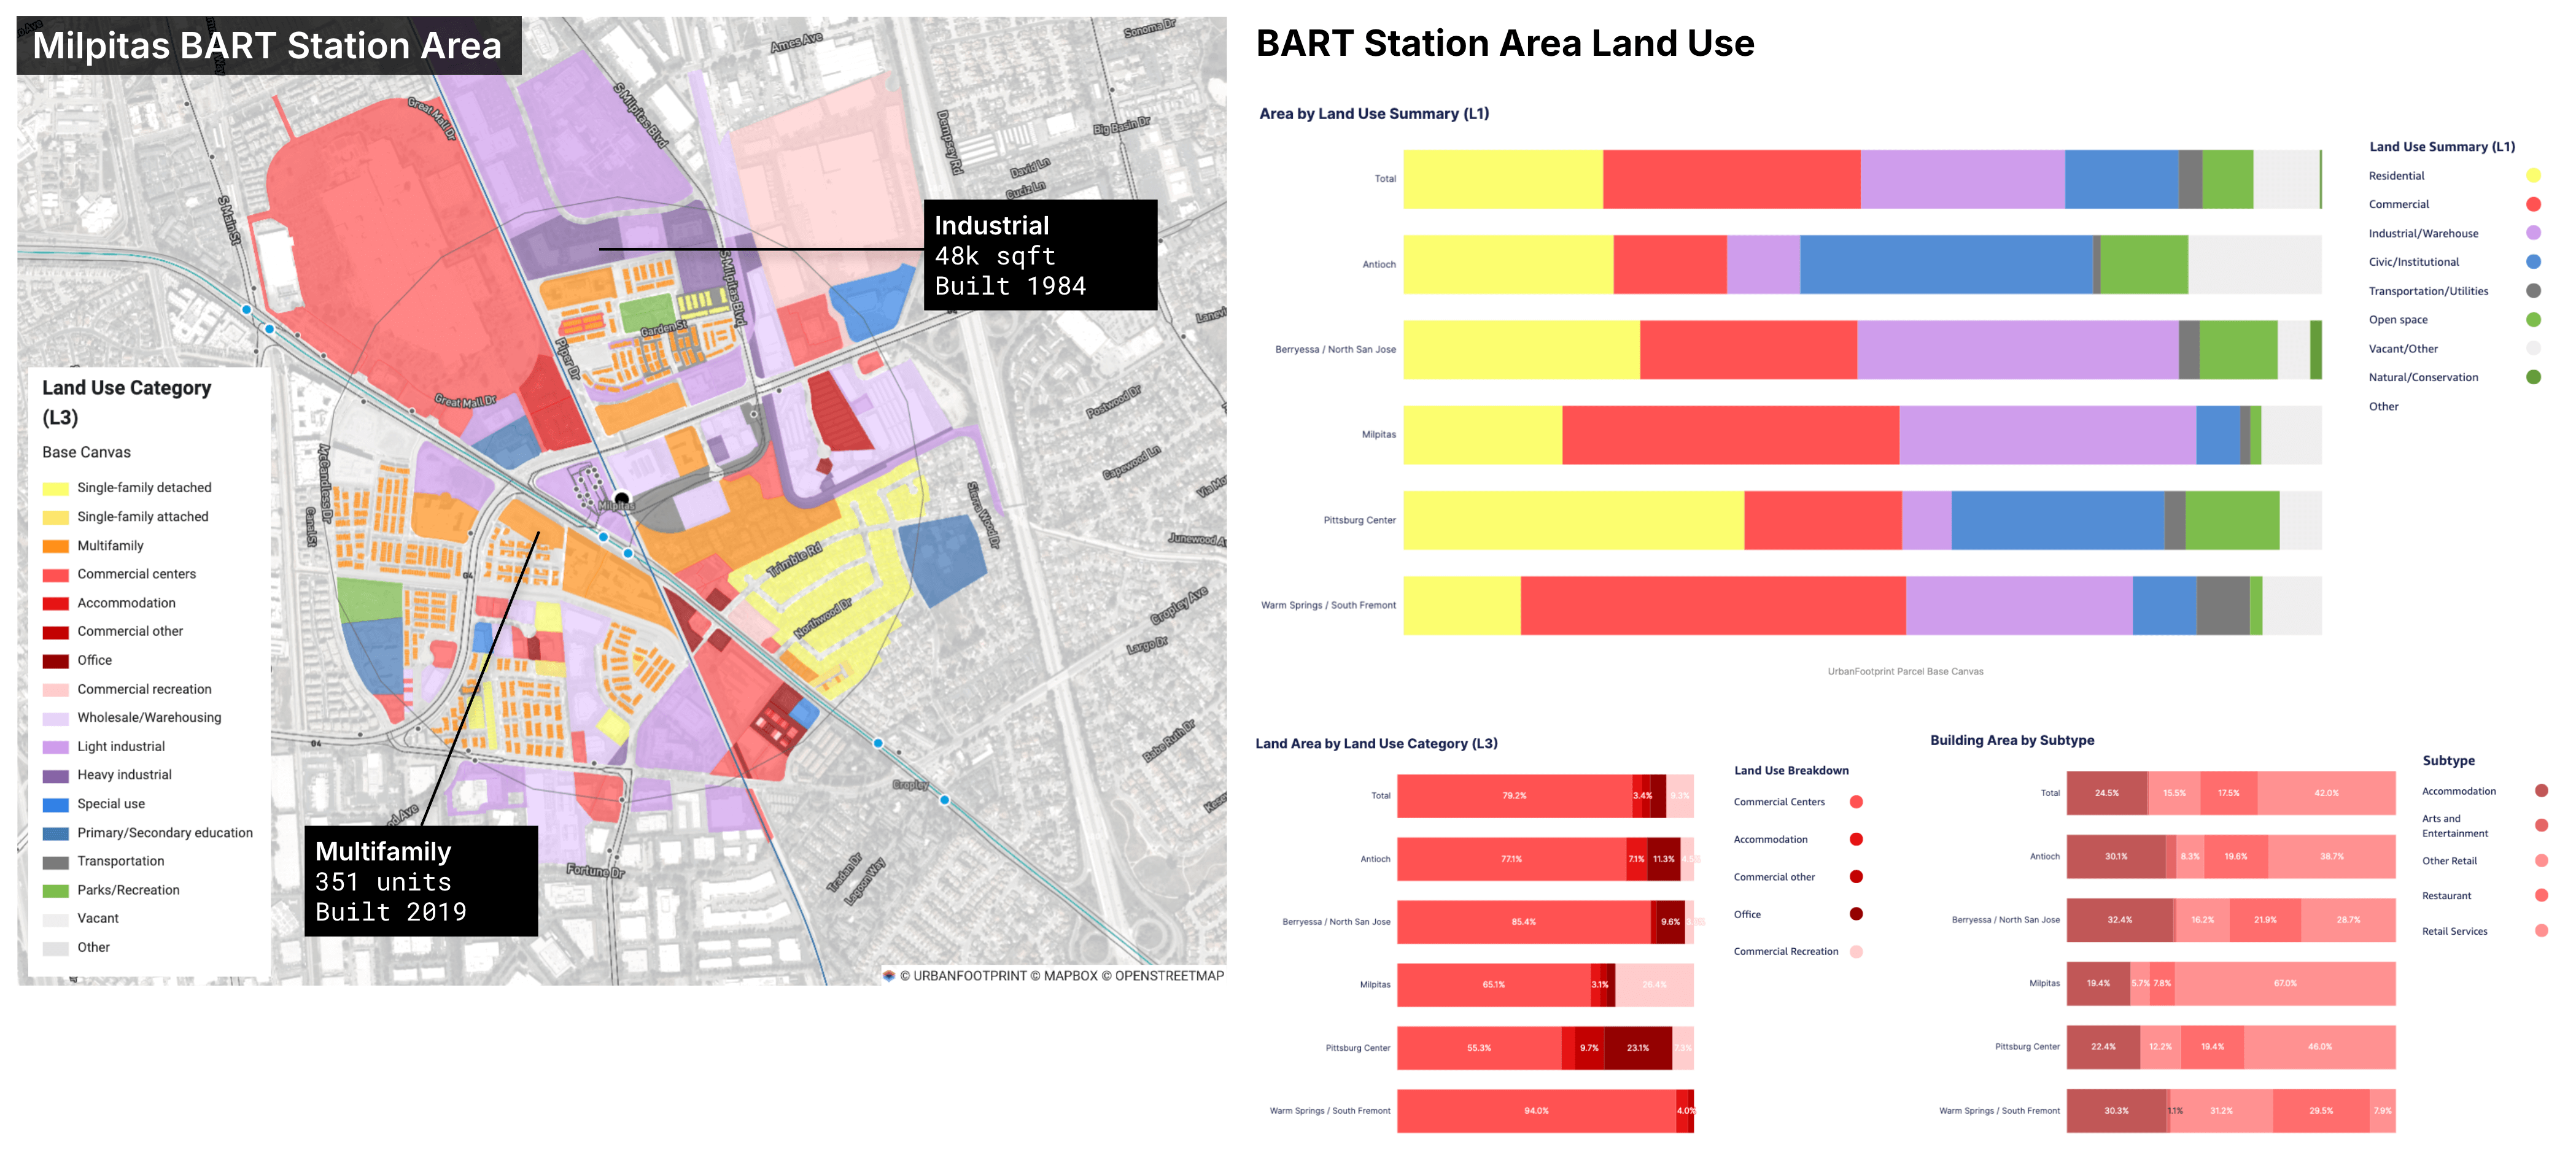
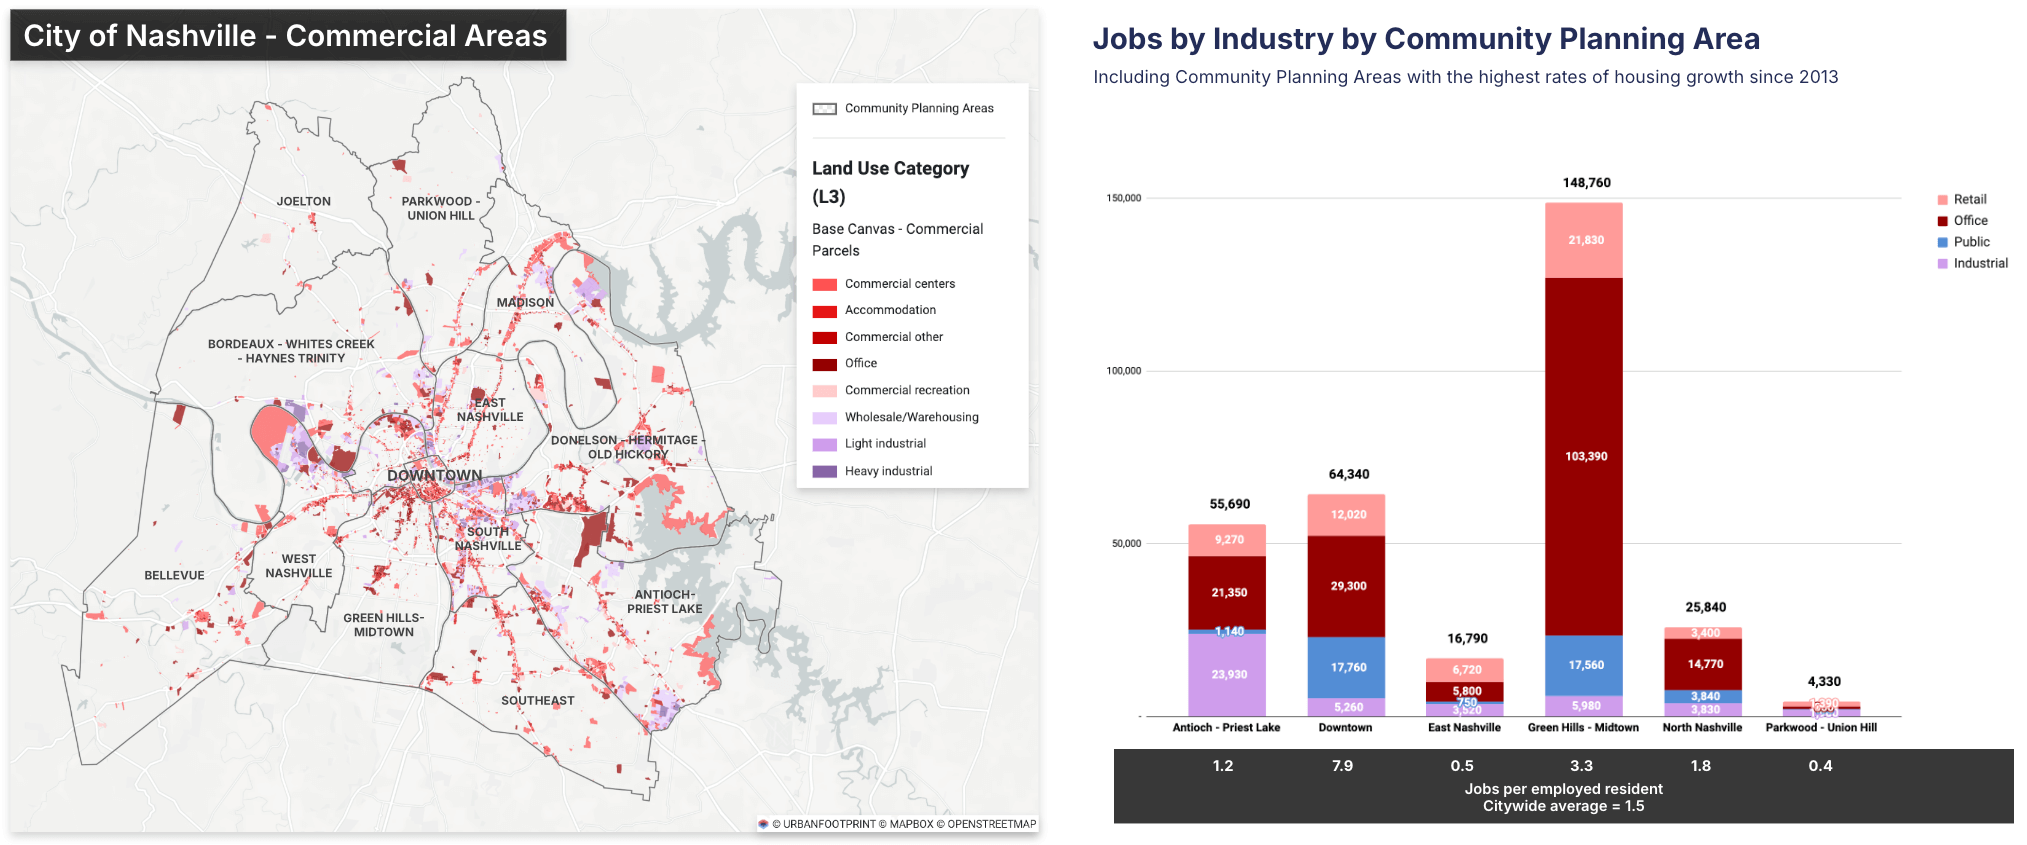
Land Use
Key land use metrics are driven by the unified parcel data of the UrbanFootprint Base Canvas. The dashboard summarizes the distribution of parcel land area by land use – from a high-level summary of general uses (e.g., residential, commercial, industrial) to more specific use categories (e.g., single family detached, commercial centers, light industrial). Summaries also include parcel area and building square footage by type to support assessment and analysis of existing capacity, particularly with respect to commercial uses.
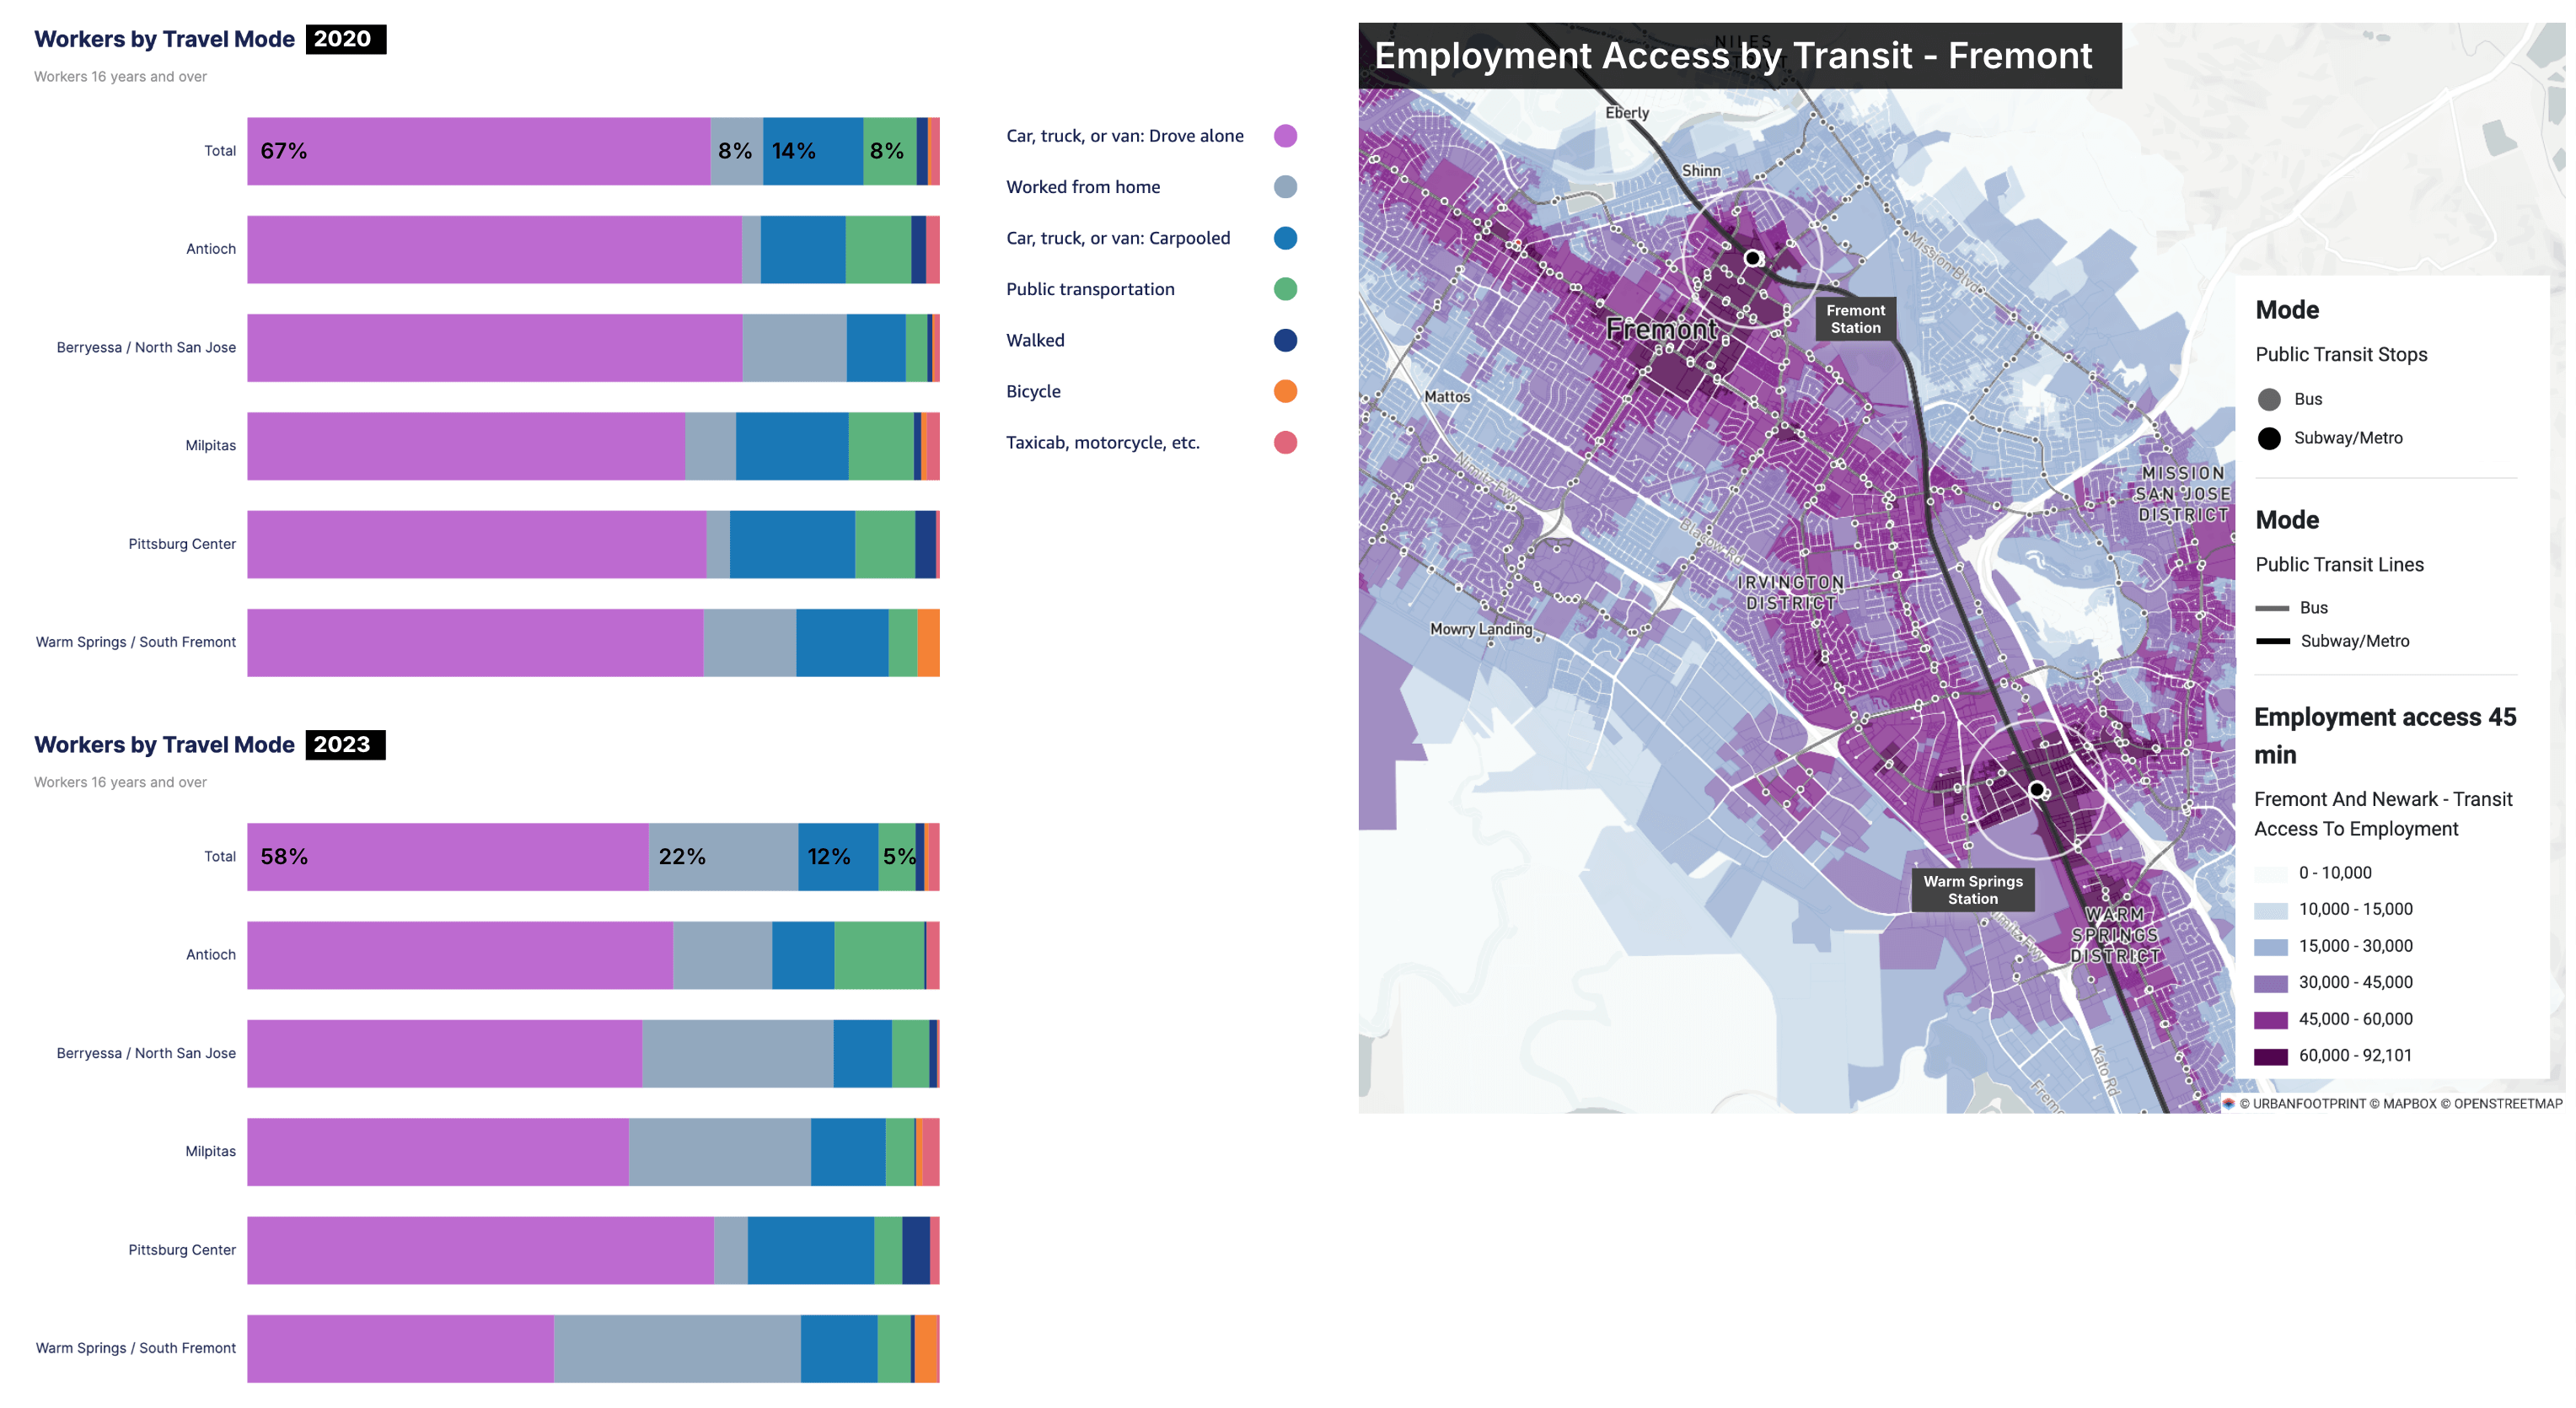
Transportation
The Transportation tab of the Existing Conditions Dashboard includes travel mode share metrics from the American Community Survey, as well as UrbanFootprint’s calculation of intersections per square mile, an important indicator of urban form and walkability. You can evaluate current travel mode share – the proportions of workers driving alone, working from home, carpooling, taking public transportation, walking, biking, or using taxis or motorcycles – and assess changes over time.
Baseline walk accessibility, transit accessibility, and transportation analysis in UrbanFootprint are a natural complement to the mode share metrics. Modeled at the parcel level using current streets, walk paths, and transit networks, the Walk and Transit Accessibility modules estimate travel times to essential destinations including schools, parks, transit stops, and custom points of interest, as well as numbers of jobs within set time periods. The Transportation module metrics include vehicle miles traveled (VMT) per household and per capita, and trip counts by mode. In turn, the Emissions and Household Costs modules estimate the emissions and household driving costs associated with the modeled VMT.
Employment
The Existing Conditions Dashboard summarizes current employment conditions in any geography. It includes jobs and employed residents by industry, as well as the work status of residents. These metrics support assessments of local economic conditions, jobs-housing balance, and economic and real estate development opportunities.
Collaboration and Engagement
The Existing Conditions Dashboard was designed to support collaboration and engagement among project partners and stakeholders. With UrbanFootprint user access, you can share live dashboards directly with clients or stakeholders so they can align on the data and work with it themselves. You can also export dashboards to share as PDF files, or export the summary data to share.
Learn More
The Existing Conditions Dashboard is available now in UrbanFootprint. From proposals, to stakeholder engagement to final reporting, this new dashboard is built for planners by planners. It delivers curated and visual insights that save time, drive more effective collaboration, and power better plans and policies.
Want to see the new dashboard in action? Schedule a walkthrough with our team or log in to try it now.
