


The recent wildfires in Los Angeles County were devastating. The two most damaging infernos, Eaton and Palisades, burned 11,000 structures, claimed 29 lives, and caused unprecedented economic impacts. These fires were particularly frightening given their location and proximity to densely populated urban areas, and could have caused even more damage were it not for a massive and prolonged fire fighting response.
Several factors contributed to the intensity and loss from these fires. A wet growing season followed by drought created conditions ripe for fire ignition, then strong downslope winds intensified the flames and grounded firefighting aircraft, allowing for significant expansion.
The LA fires and others that have wrought extensive damage in the recent past implore us to pause and consider fire risk across the U.S., how it may be changing, and what can be done to save lives and keep property safe from the standpoints of homeowners, businesses, jurisdictions, government agencies, and a broader society. In this post, we map where UrbanFootprint’s modeled estimates of high wildfire probability and drought risk coincide with areas prone to high downslope winds to understand where people and property may be at especially high risk of very destructive fires.
A Historical Context
Records of the most damaging or deadly wildfires in U.S. history show major fires falling into two time periods: from the late 1800s to the early 1900s; and the past twenty years, from 2005 to 2025.1 The late 1800s saw the deadliest fires, including the Peshtigo (Wisconsin, 1871), Hinckley (Minnesota, 1894), and Cloquet and Moose Lakes (Minnesota, 1918) fires. Poor forestry practices such as leaving branches on the ground after clear-cutting, a lack of modern firefighting capabilities, and the inability to evacuate quickly led to these deadly fires in the upper Midwest. Advancements in forestry and firefighting reduced the frequency and intensity of fires throughout the 1900s.
But fires have taken a turn for the worse over the past twenty years. Wildfires have become more intense and damaging, especially in the last decade. Numerous devastating wildfires, including Paradise (California), Marshall (Colorado), Maui (Hawaii), and Palisades and Eaton (California) have destroyed tens of thousands of structures and claimed hundreds of lives. According to the National Interagency Fire Center, the annual area burned has more than doubled over the past forty years despite the frequency of fires remaining relatively constant.2 This doubling has occurred entirely west of the Mississippi, with little change in the Eastern U.S.
What is Making Recent Fires so Damaging?
There are commonalities among recent fires that we’ll explore in detail here, including high wildfire risk, drought conditions following wet years, and downslope wind events. Below, we can see some of the driving factors involved in three of the largest recent fires – the Marshall Fire in Colorado, the Maui Fires in Hawaii, and the Palisades and Eaton fires in Los Angeles County.
Table 1. Common drivers of three recent devastating wildfires.
| Colorado Marshall Fire December 2021 |
Hawaii Maui Fires August 2023 |
California Palisades and Eaton Fires January 2025 |
|
| Wildfire Risk3 | Very High Burn Probability (Boulder County: 92th percentile) | Very High Burn Probability (Maui: 98th percentile) | Very High Burn Probability (Santa Monica: 94th percentile, Altadena: 100th percentile) |
| Drought Conditions Following Wet Years | Extreme drought conditions when the fire occurred according to the U.S. Drought Monitor.4 This followed a very wet year in which the growing season saw “Much Above Normal” precipitation that led to enhanced fuel load.5 | Moderate drought conditions according to the U.S. Drought Monitor.6 This followed a wetter than normal year that enhanced fuel load.7 | Severe drought conditions for Los Angeles County according to the U.S. Drought Monitor.8 LA has seen enhanced precipitation over the past two years including atmospheric river events that may have contributed to enhanced grass growth in the Wildland Urban Interface (WUI) areas of both fire perimeters.9 |
| High Winds | Dry downslope winds with gusts of 80 to 105 mph.10 | Dry downslope winds with gusts of 69-92 mph.11 | Dry downslope winds with gusts of 90-100 mph.12 |
| Special Wind Regions13 | The fire perimeter is directly within the Special Wind Region that experiences the Chinook winds. | The entire Hawaiian Island chain has its own set of special regions, primarily due to the threat of hurricane winds, such as those during the Lahaina fire. | Altadena and the 3-4 other places within the reach of the Eaton Fire all are within the special wind region that experiences the Santa Ana winds. |
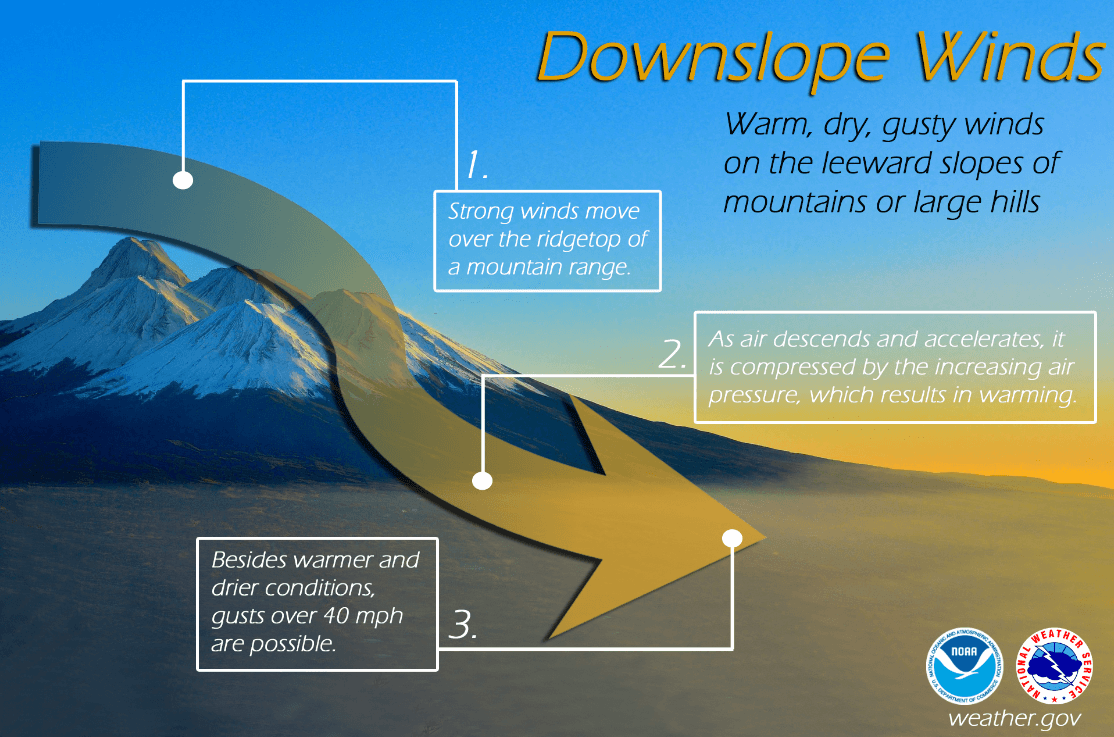
Downslope Wind Events
As air rises over a mountain range it loses moisture and gains heat. As it descends and accelerates on the opposite side of a mountain, the air is compressed by increasing air pressure, resulting in warming and a reduction in relative humidity. These warm, dry winds can accelerate to very high speeds causing damage and greatly increase fire risk. The Chinooks in the Colorado Front Range and the Santa Ana winds in Southern California are examples of this phenomenon.
Fires caused by downslope wind events are particularly destructive. While they make up only 14% of wildfires and 11% of the total burned area in the Western U.S., they account for 60% of structures lost and over 50% of fatalities. Furthermore, downslope fires are more than twice as likely to be caused by human-ignitions such as debris burning, recreation, or energy systems.14 High winds can damage infrastructure such as powerlines and ignite fires.
Why downslope wind event fires are so damaging:
- Downslope winds tend to be hot with low humidity, drying the vegetation and enhancing the flammability of the fuel.
- Fires usually burn up slopes and away from urban areas, but downslope winds can drive fires from wildlands into more urban areas.
- Wildfires driven by high winds can move fast and jump over barriers such as interstates or rivers, making them harder to control on the ground.
- High winds can ground firefighting aircraft that are important for containing large fires, especially in areas that are inaccessible to ground crews.
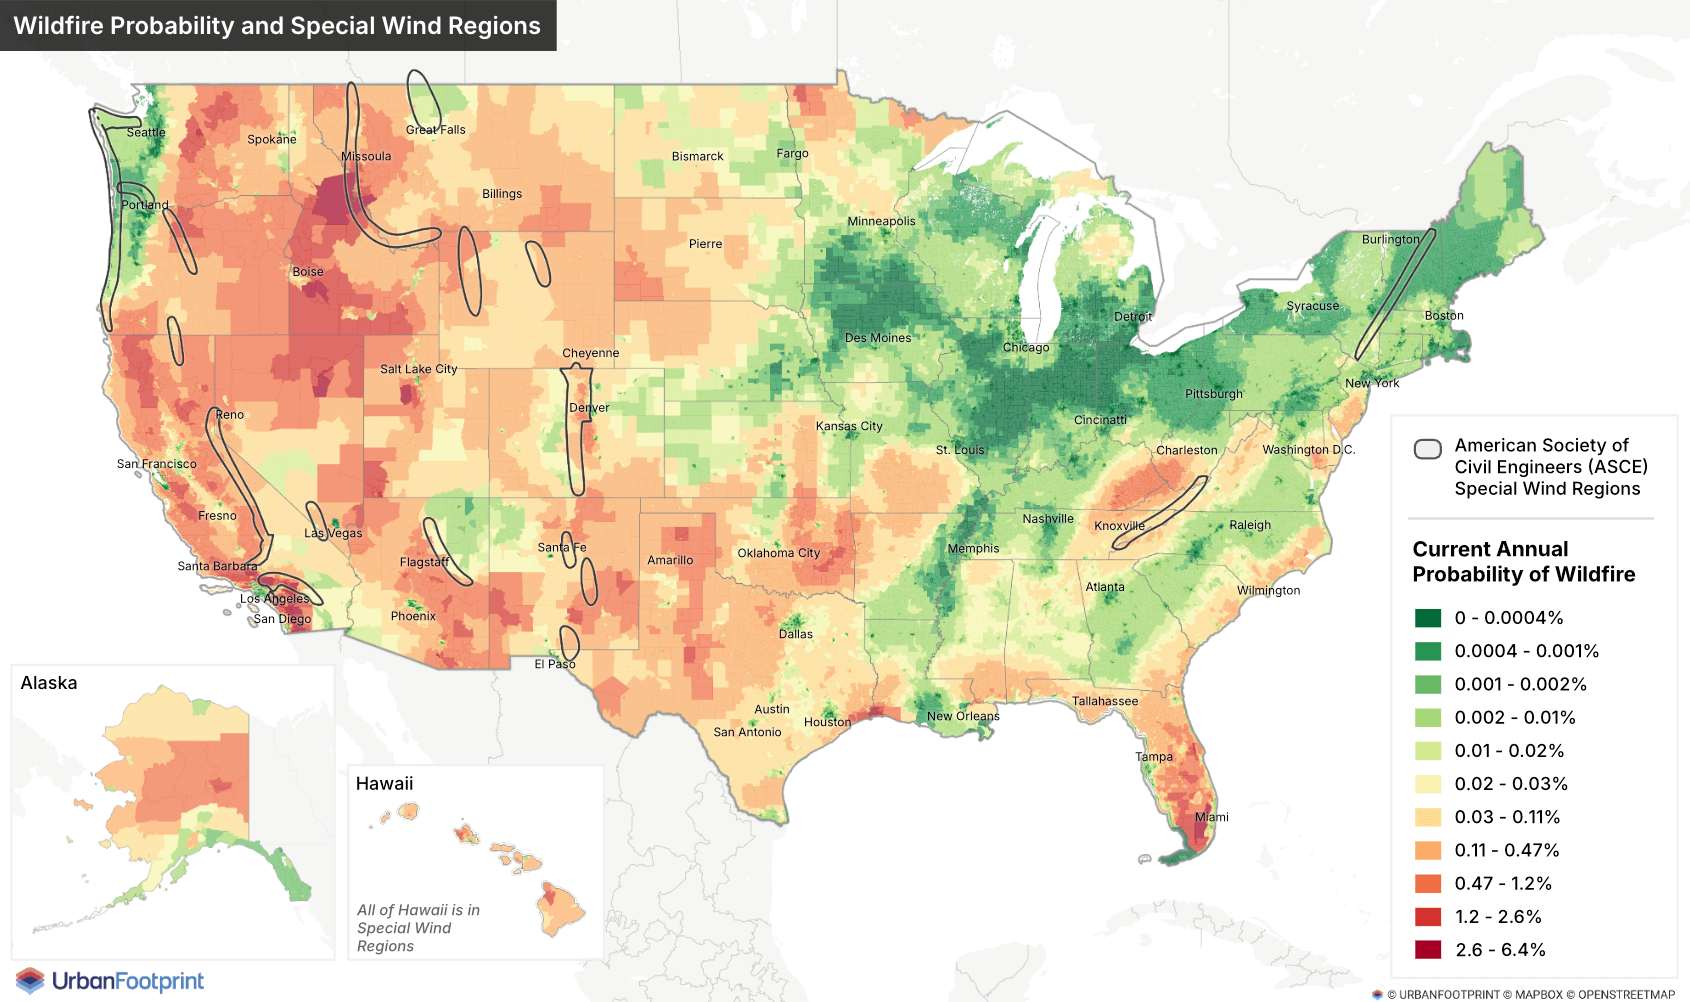
Downslope winds occur in very specific areas on the leeward side of mountain ranges, and have been identified by the American Society for Civil Engineers (ASCE) as special wind regions. The map below shows UrbanFootprint’s current wildfire burn probability at the census tract scale overlaid with the special wind regions. The Western U.S. has several areas of high burn probability within special wind districts, indicating regions with high damage potential. This applies now and into the future, according to UrbanFootprint’s modeling of wildfire risk under multiple climate scenarios.
Wet Then Dry Weather Conditions
Drought conditions make ignition and fire spread more likely. Dry conditions existed during each of the fires above: Marshall, Maui, and LA, and locations with a higher probability of drought conditions are more at risk of wildfires. However, all three of these fires also had anomalously wet conditions during the preceding growing seasons. Prior wet conditions have been shown to increase wildfire probability; one study of Hawaiian grasslands found that excess rainfall the year prior to a fire increases the probability of wildfire more than drought during the fire year.15
The Colorado, Maui, and Los Angeles County fires were not in primarily forested areas. They occurred in grass and shrub lands where major plant growth in a single growing season can dramatically change the relative fuel load. Because grass grows back annually, the return period of fires in grasslands can be much shorter than in forests. Thus, areas that recently burned from grass fires continue to have the potential for high fire risk the following year.
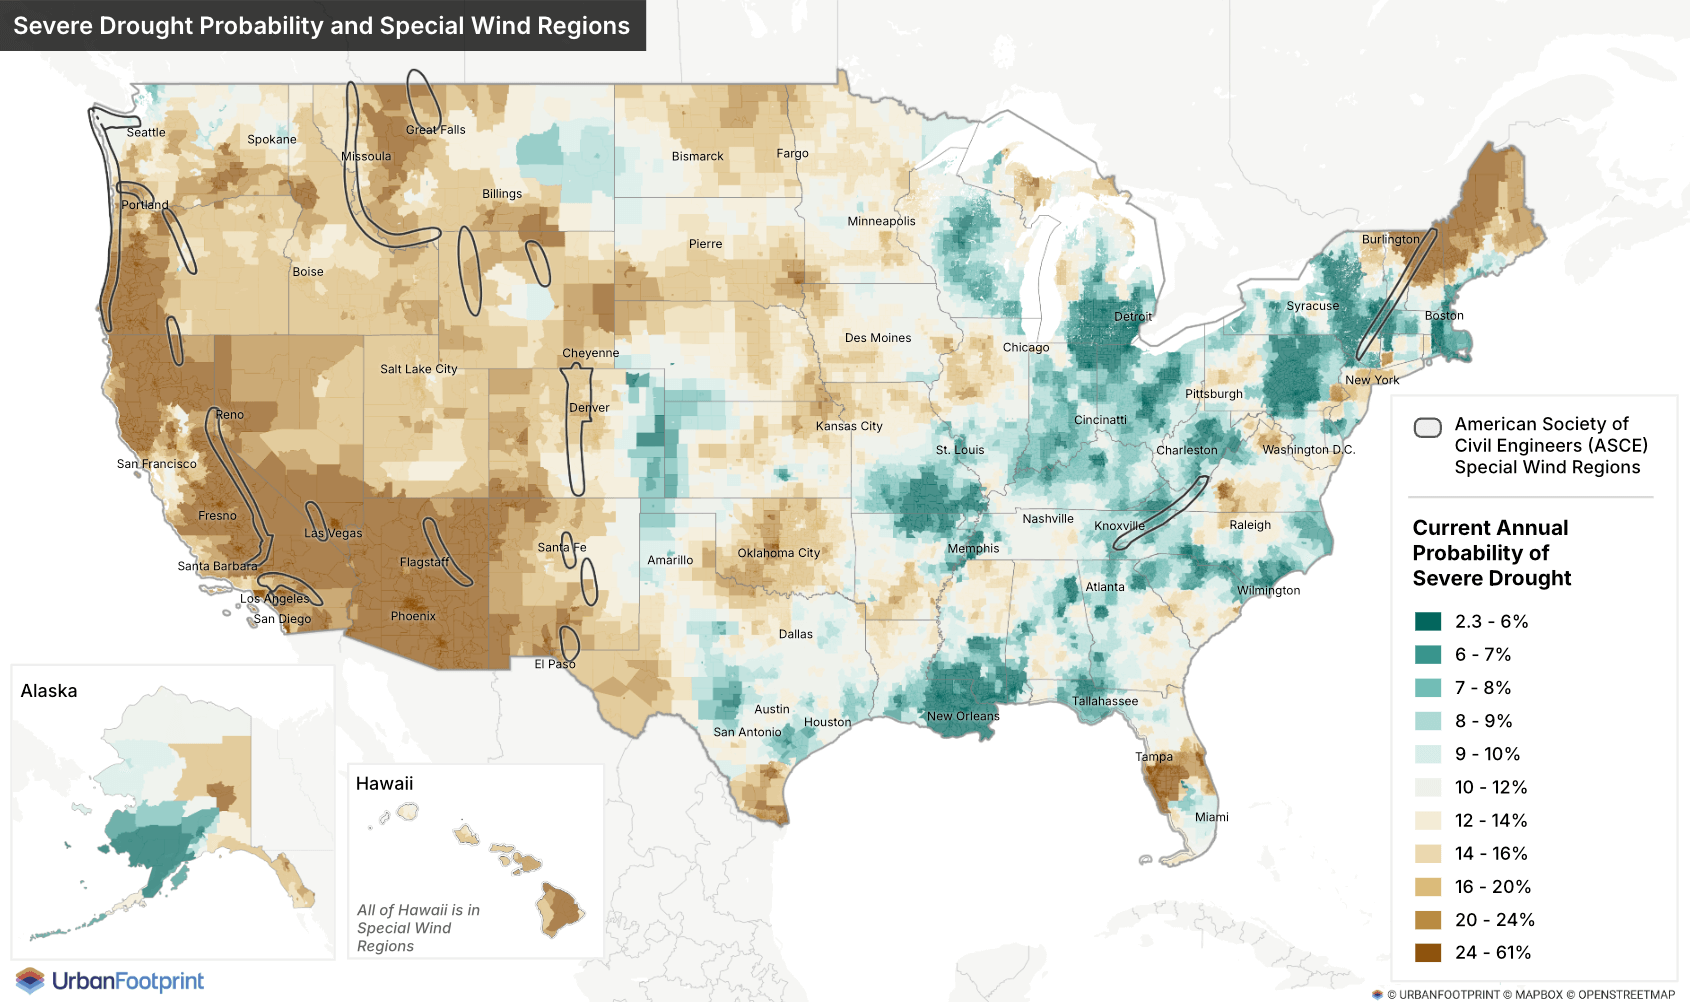
The map below illustrates UrbanFootprint’s modeling of the current annual probability of severe drought at the census tract scale, along with the ASCE special wind regions. Similar to the burn probability, the West has high drought potential, including within many special wind regions.
Other Locations at High Wildfire Risk
To pinpoint other urban areas that may also face this dangerous combination of downslope wind events, high fire risk, and drought conditions, we combined data on ASCE special wind regions, severe drought, and wildfire burn probabilities. Focusing on the western contiguous U.S., we then identified cities with populations greater than 15,000 within these high-risk areas. This analysis reveals several urban centers facing significant wildfire danger, including:
- Los Angeles and San Bernardino metro areas in California
- Palm Springs and surrounding areas in California
- Colorado Front Range including Denver, Boulder, and Fort Collins
- Reno in Nevada and the Lake Tahoe area in California and Nevada
- Klamath Falls and Redmond in Oregon
What sets these areas apart from the many western cities with high wildfire risk is the possibility of strong downslope winds that make fires much harder to control and much more destructive.
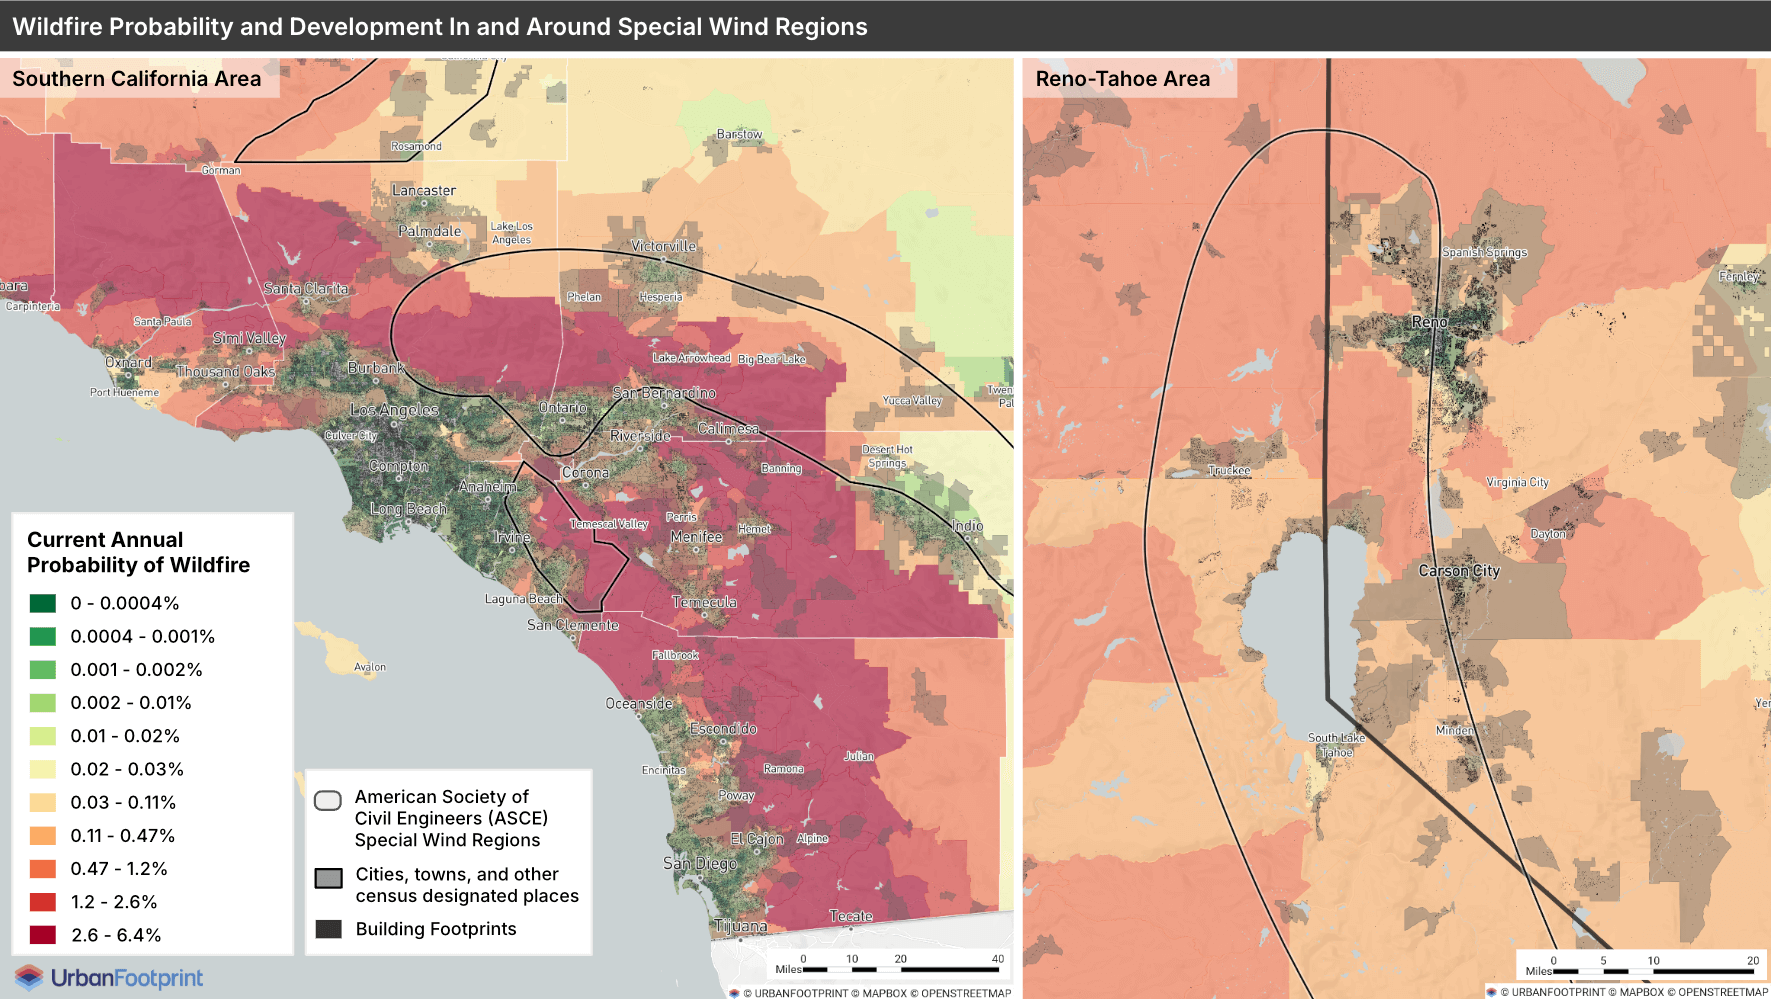
The maps below home in on the Southern California and Reno-Lake Tahoe areas, highlighting cities in ASCE special wind regions with high wildfire risk.
Growth in the Wildland-Urban Interface
Population growth in the wildland-urban interface (WUI), where development meets or is interspersed with undeveloped wildland, compounds the risk of wildfires. Today, 52 million Americans – one in six – live in these wildfire-prone areas, a result of decades of growth adjacent to natural and forest lands and at the far edges of urban areas. With continued development in the WUI, and the projected intensification of drought and extreme temperatures due to climate change, future wildfire probabilities are projected to rise, placing more people and property at risk.16 UrbanFootprint’s modeling of wildfire risk indicates a 20% increase in annual burn area over the contiguous U.S. by 2050. Such risk is slated to grow across the globe, with the United Nations forecasting a 30% increase in catastrophic fires worldwide by 2050.
What Can be Done to Mitigate Risk?
Combating escalating wildfire risk demands a blend of proactive solutions, beginning with data-driven insights to pinpoint high-risk areas and assess the exposure of people, property and businesses. This comprehensive risk assessment should guide the prioritization of both immediate and long-term adaptation and mitigation efforts. These efforts can include ignition reduction strategies such as home hardening and vegetation management, more proactive urban planning and policy to control growth in high-risk zones, and robust emergency management plans to ensure safe evacuations.
While it is impossible to predict where and when the next devastating wildfire will occur, it is possible to identify places at significant risk and take measures to reduce that risk. Contact us about how you can use data-driven insights to understand wildfire risk and inform planning and policy-making.
Footnotes
- https://wfca.com/wildfire-articles/deadliest-wildfires-in-us-history/
- https://www.epa.gov/climate-indicators/climate-change-indicators-wildfires
- https://wildfirerisk.org/
- https://droughtmonitor.unl.edu/Maps/MapArchive.aspx
- https://wwa.colorado.edu/resources/intermountain-west-climate-dashboard/briefing/compound-hazards-and-marshall-fire-january
- https://droughtmonitor.unl.edu/Maps/MapArchive.aspx
- https://research.fs.usda.gov/firelab/products/multimedia/webinars/meteorology-2023-maui-wildfire
- https://droughtmonitor.unl.edu/Maps/MapArchive.aspx
- https://www.weather.gov/wrh/climate?wfo=lox
- https://storymaps.arcgis.com/stories/83af63bd549b4b8ea7d42661531de512
- https://research.fs.usda.gov/firelab/products/multimedia/webinars/meteorology-2023-maui-wildfire
- https://www.nytimes.com/interactive/2025/01/18/us/los-angeles-fires-palisades-eaton-timeline.html
- https://ascehazardtool.org/
- https://agupubs.onlinelibrary.wiley.com/doi/full/10.1029/2022EF003471″
- https://www.sciencedirect.com/science/article/abs/pii/S0048969718333187
- https://www.unep.org/resources/report/spreading-wildfire-rising-threat-extraordinary-landscape-fires
