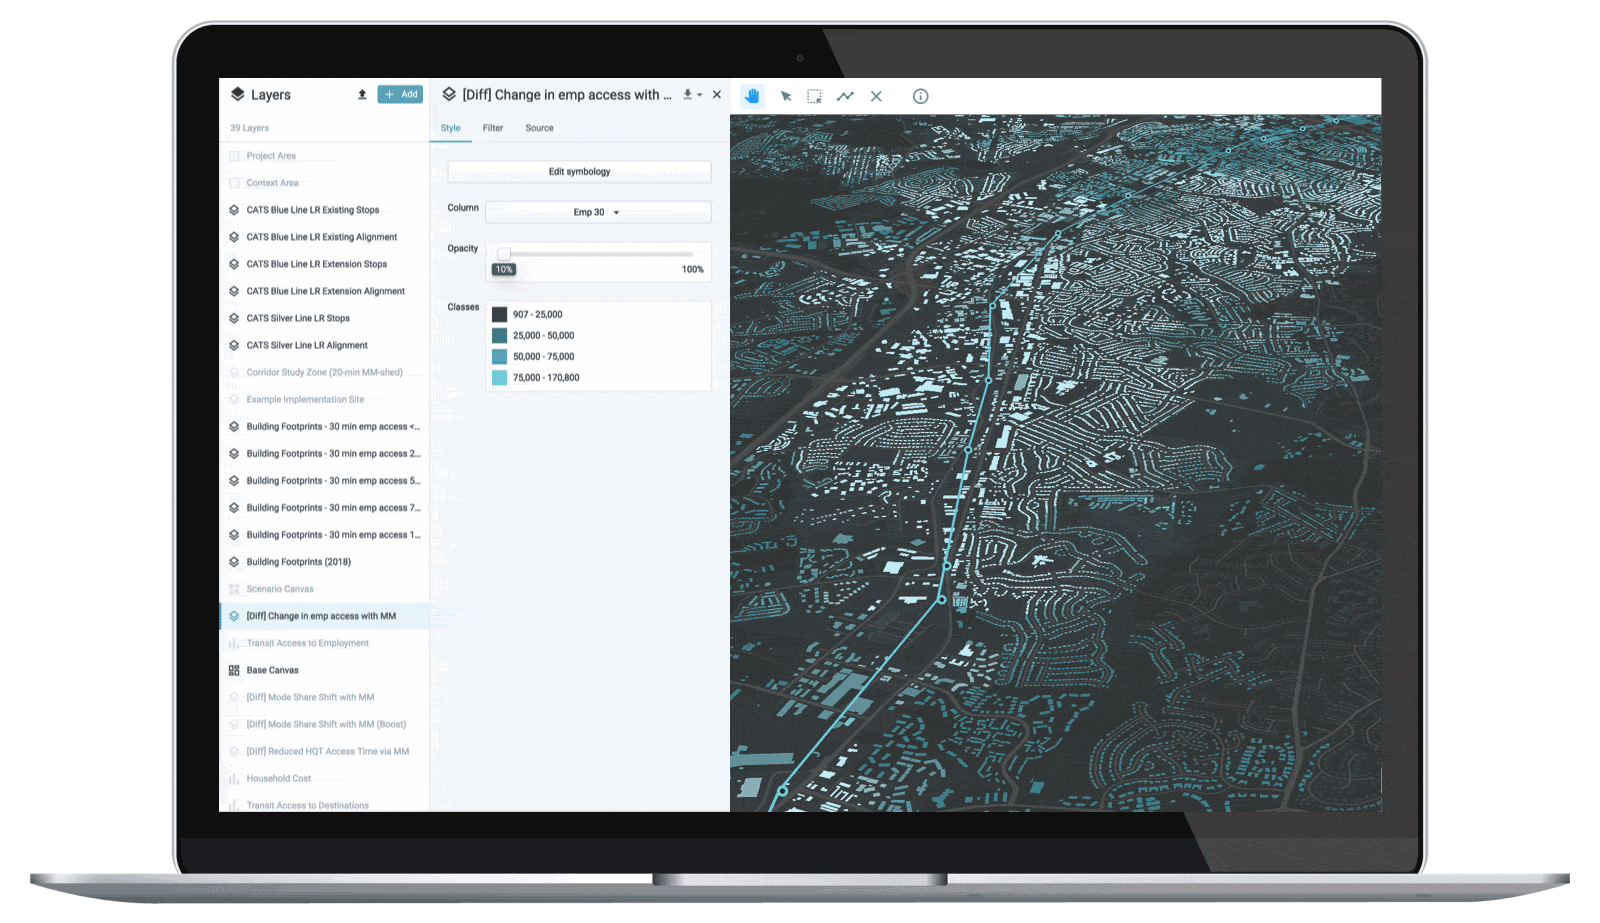
Up-to-date, consistent, unified, and 100% ready-to-use parcel data for smarter, faster, and more efficient planning.
Say goodbye to the headaches of gathering and using parcel data! UrbanFootprint delivers instant access to the most detailed, up-to-date land use and property information across the U.S. Whether you’re mapping existing conditions or evaluating development impacts, our data layers make it faster and easier to get the insights you need.
At the heart of UrbanFootprint’s parcel data capabilities are two game-changing datasets: the Base Canvas, your foundation for land use and building insights, and Parcel Reference Data, your gateway to detailed property information from more than 3,000 U.S. county assessors. In this post, we’ll explore these two powerful datasets, dive into common planning workflows they support, and highlight the key parcel attributes every planner needs to know.
The Base Canvas features four levels of standardized land use classifications (L1 to L4) that allow you to assess and map land use at different levels of detail.
Base Canvas: The Foundation of UrbanFootprint
UrbanFootprint’s Base Canvas is a one-of-a-kind dataset that unifies land use, building, and demographic metrics for the entire U.S., including over 20,000 cities and towns and the areas around them, into a single consistent language. Incorporating data from dozens of public and commercial data sets, it leverages cutting-edge data science, machine learning, and over 30 years of deep domain expertise to present the most detailed and up-to-date view of site conditions across 160 million parcels.
The Base Canvas serves as the underpinning for UrbanFootprint, aligning key metrics for existing conditions and forming the basis for scenario planning and robust, multi-dimensional analysis in one unified digital parcel landscape.

The Base Canvas is supplemented by the Parcel Reference Data, which provides additional site, building, and economic data, as well as key metrics from the primary parcel data as maintained by county assessors.
Parcel Reference Data: Your Instant Connection to County Assessor Information
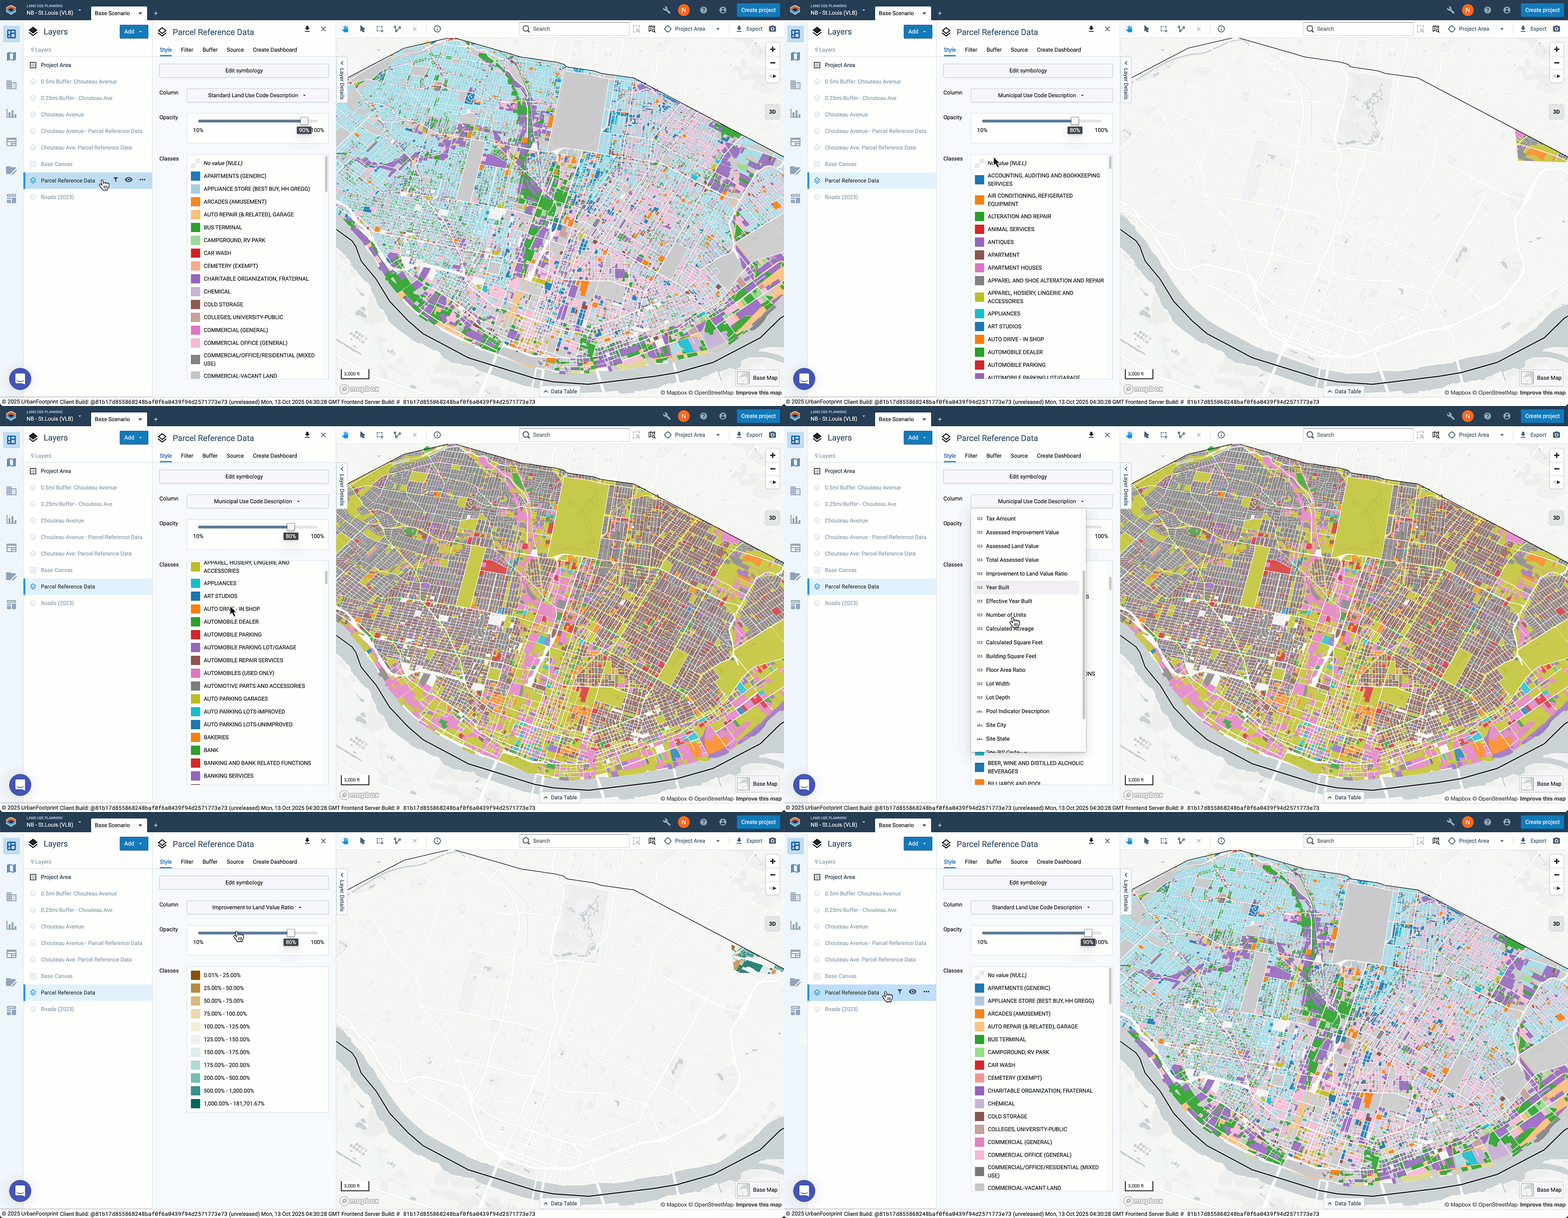
The Parcel Reference Data layer contains property information sourced from more than 3,000 county assessors’ offices. It goes hand-in-hand with the Base Canvas: both layers use the same parcel geographies so they can easily be used together. UrbanFootprint updates these datasets at the same time every quarter so they are always in sync when you use them in a project.
You can use the Parcel Reference Data on its own, or use the layer in tandem with the Base Canvas for a range of analyses and planning workflows.
Putting Parcel Data to Use in Common Planning Workflows
Together, the Base Canvas and Parcel Reference Data facilitate a range of core planning workflows, including for existing conditions reporting, housing needs assessment, transit-oriented development planning, economic impact analysis, identifying redevelopment opportunities, and more. Advantages to using these parcel data in UrbanFootprint include:
- Time savings. You can bypass the process of gathering local parcel data and get to work right away.
- Standardized and aggregated data. Access a consistent set of key attributes standardized across jurisdictions, ready to support mapping and analysis.
- Up-to-date information. The Base Canvas and Parcel Reference Data are updated quarterly, so you always get the latest available data when creating a project.
- Easy filtering and integration. The Base Canvas and Parcel Reference Data use the same parcel geometries, making filtering and selecting parcels based on criteria across layers seamless. Both layers use the same geometry IDs to facilitate joining data.
Existing Conditions
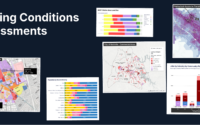
Map land use by standardized categories to show residential, commercial, employment, and other areas across planning areas, cities, and regions. Compute acreage, housing units, and floor-area-ratio and other key metrics by land use category – residential, commercial, mixed-use, industrial and more.
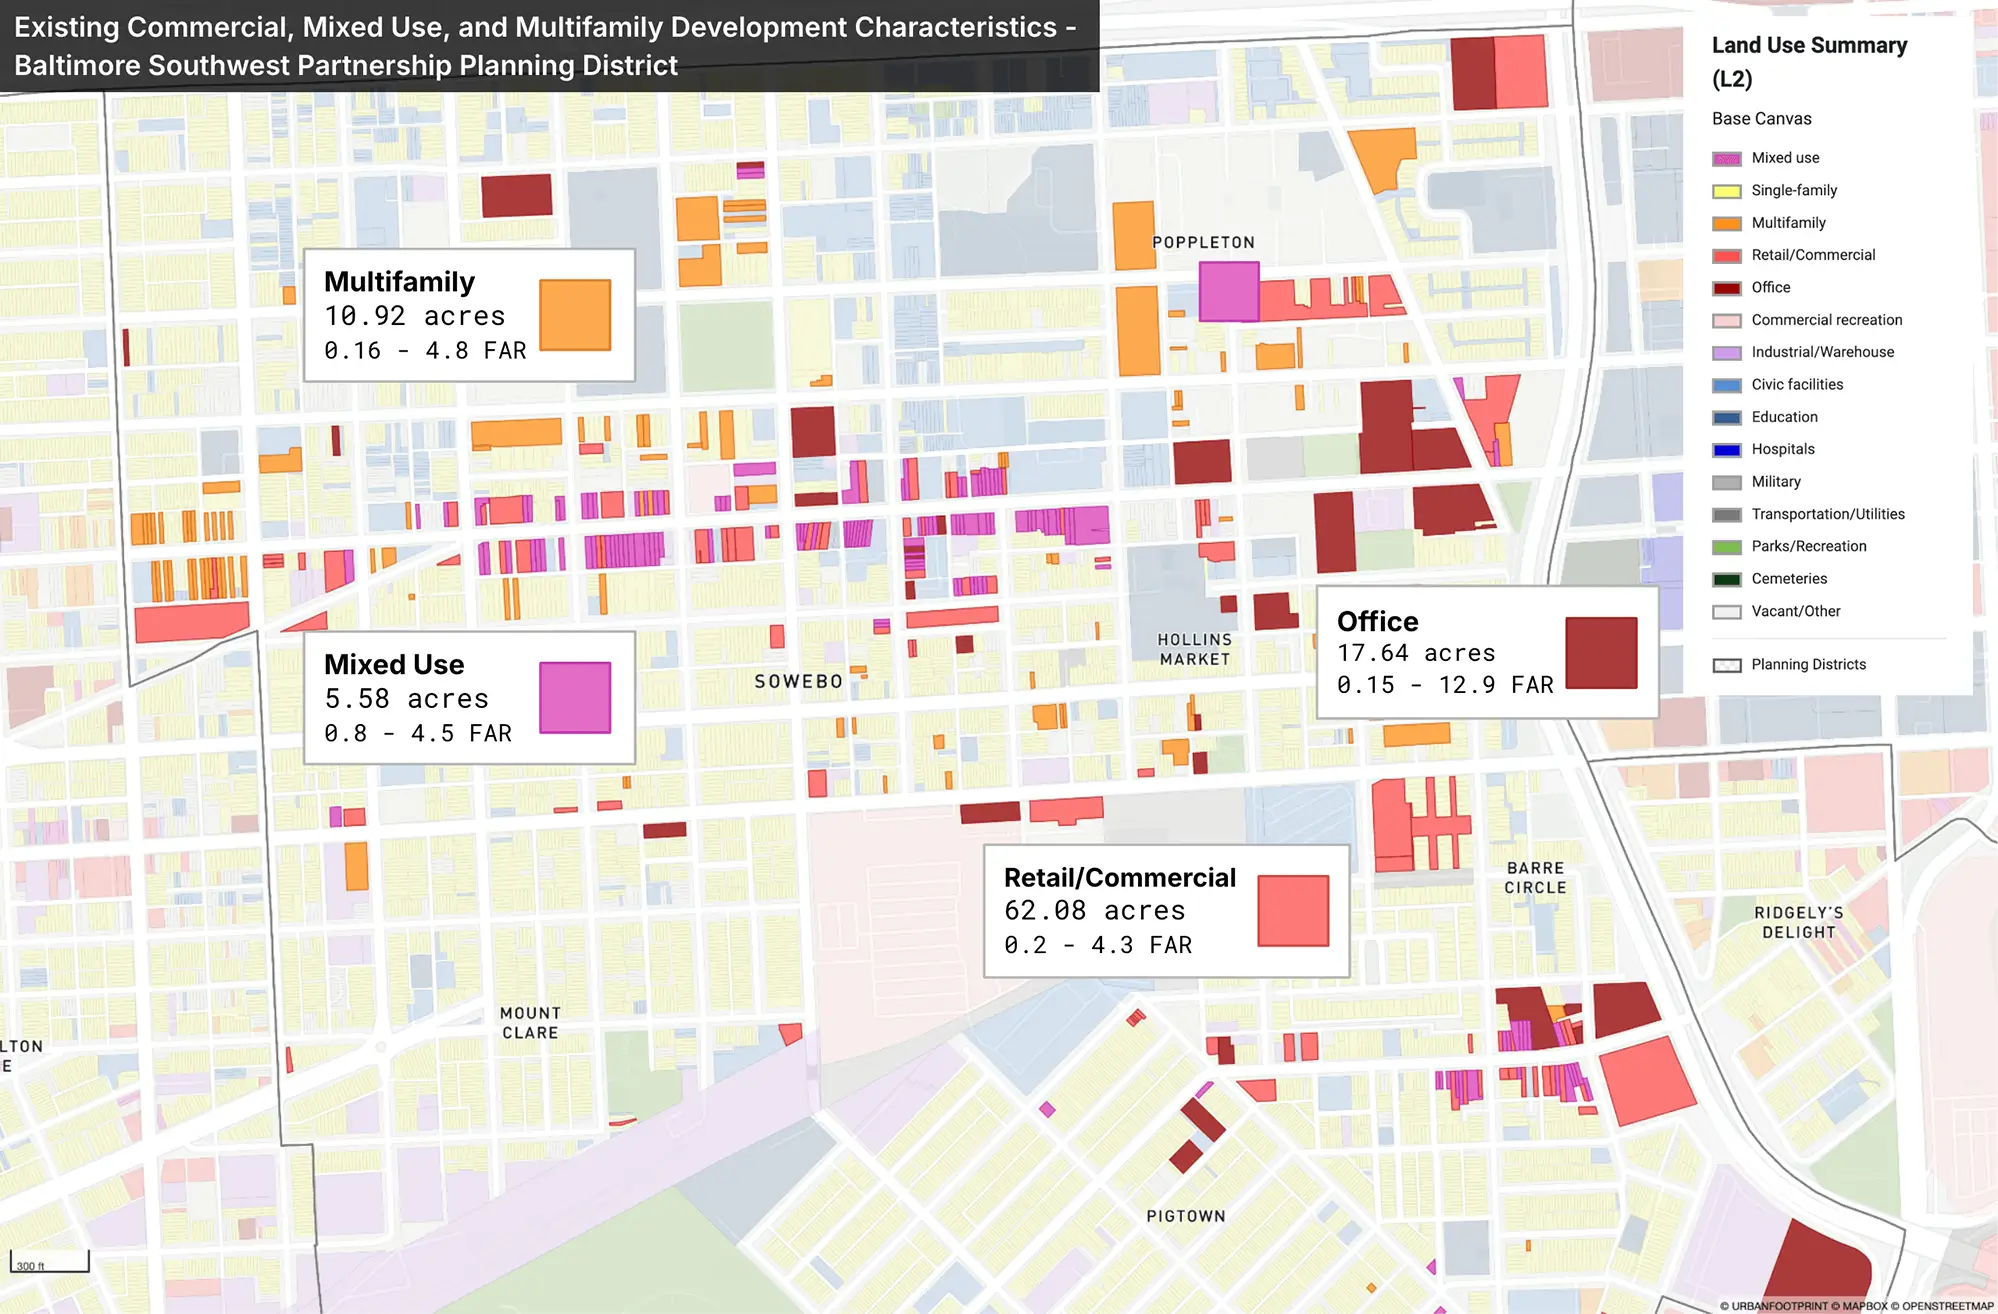
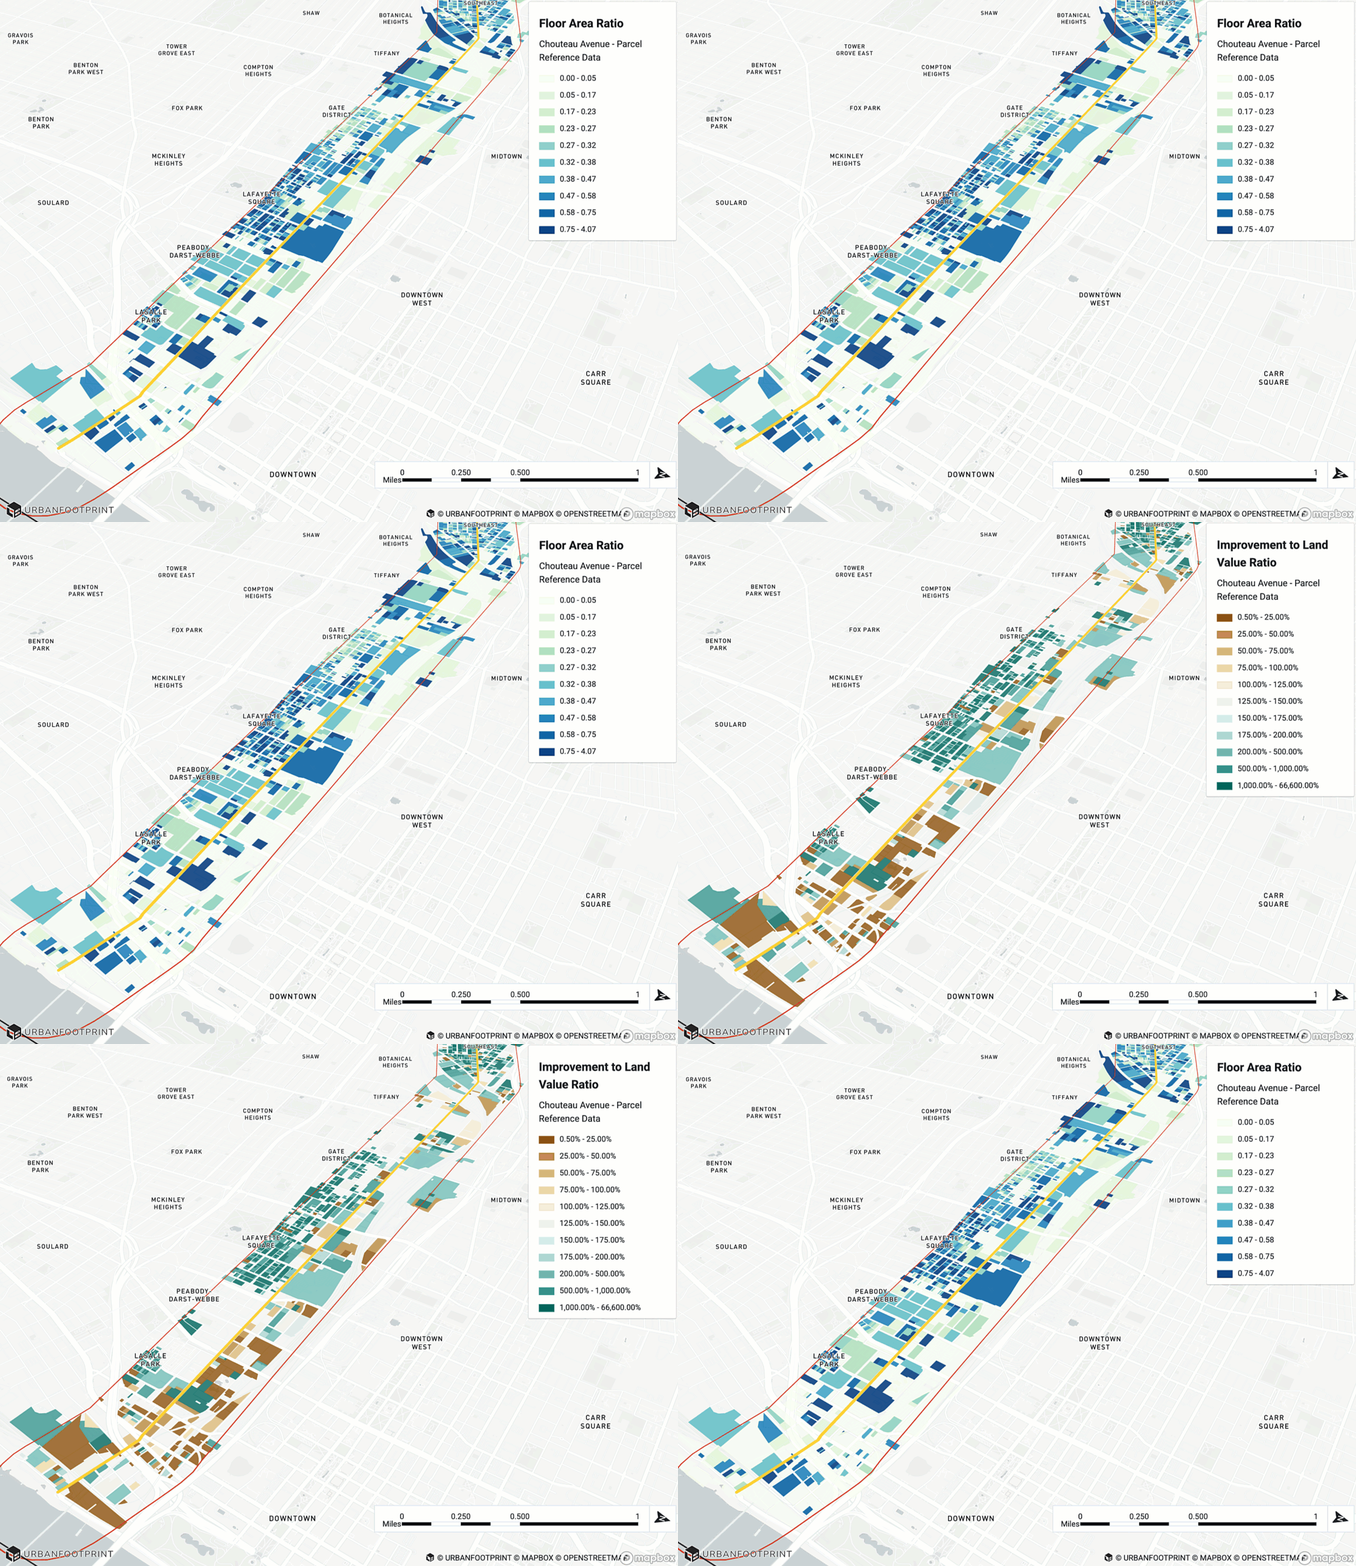
Identifying Potential Redevelopment Sites
Identifying sites that present opportunities for redevelopment is core to many planning efforts. Together, the Base Canvas and Parcel Reference Data support evaluation of redevelopment potential with respect to multiple criteria, including vacancy and underutilization according to existing land use (such as parking lots or outdated shopping centers), development intensity, floor-area ratio (FAR), and economic value as represented by improvement-to-land-value ratio.
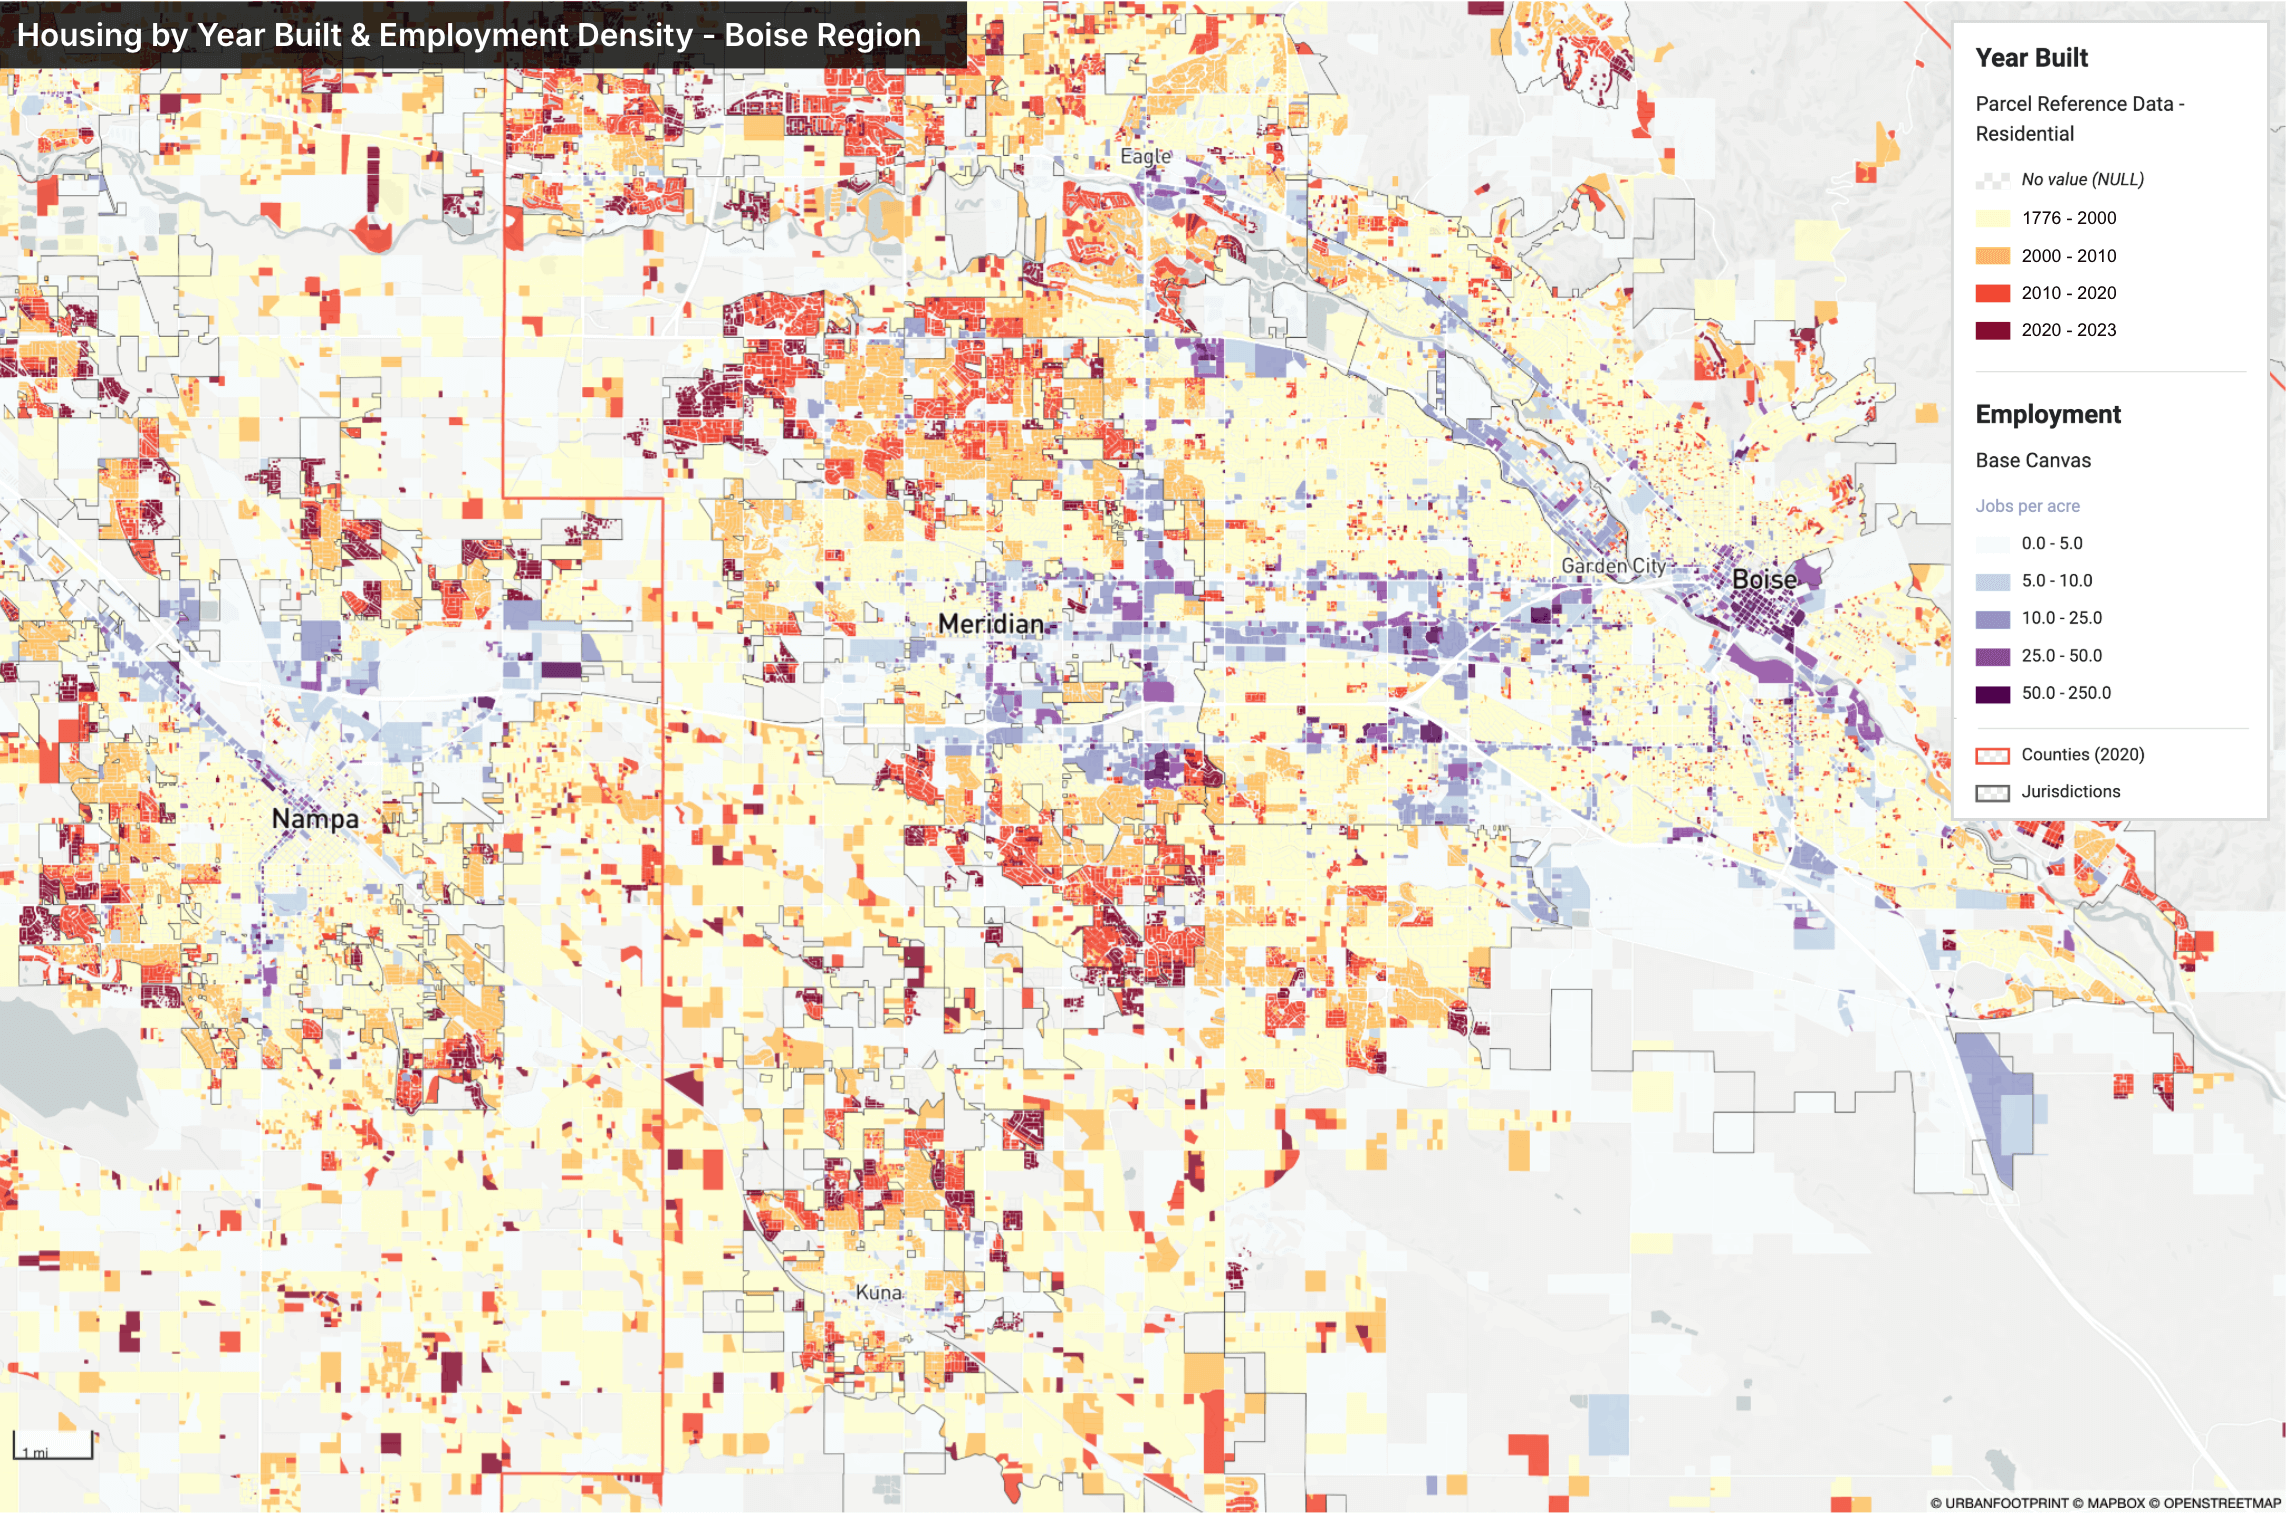
Housing Needs Assessments
Quickly evaluate and visualize the distribution of housing by type (including single family detached units by lot size, single family attached, and multifamily units). Summarize key metrics like average home or lot sizes by type or housing densities for project areas or sub-areas. Assess jobs-housing balance, housing values, or construction year information to describe and assess development patterns over time.
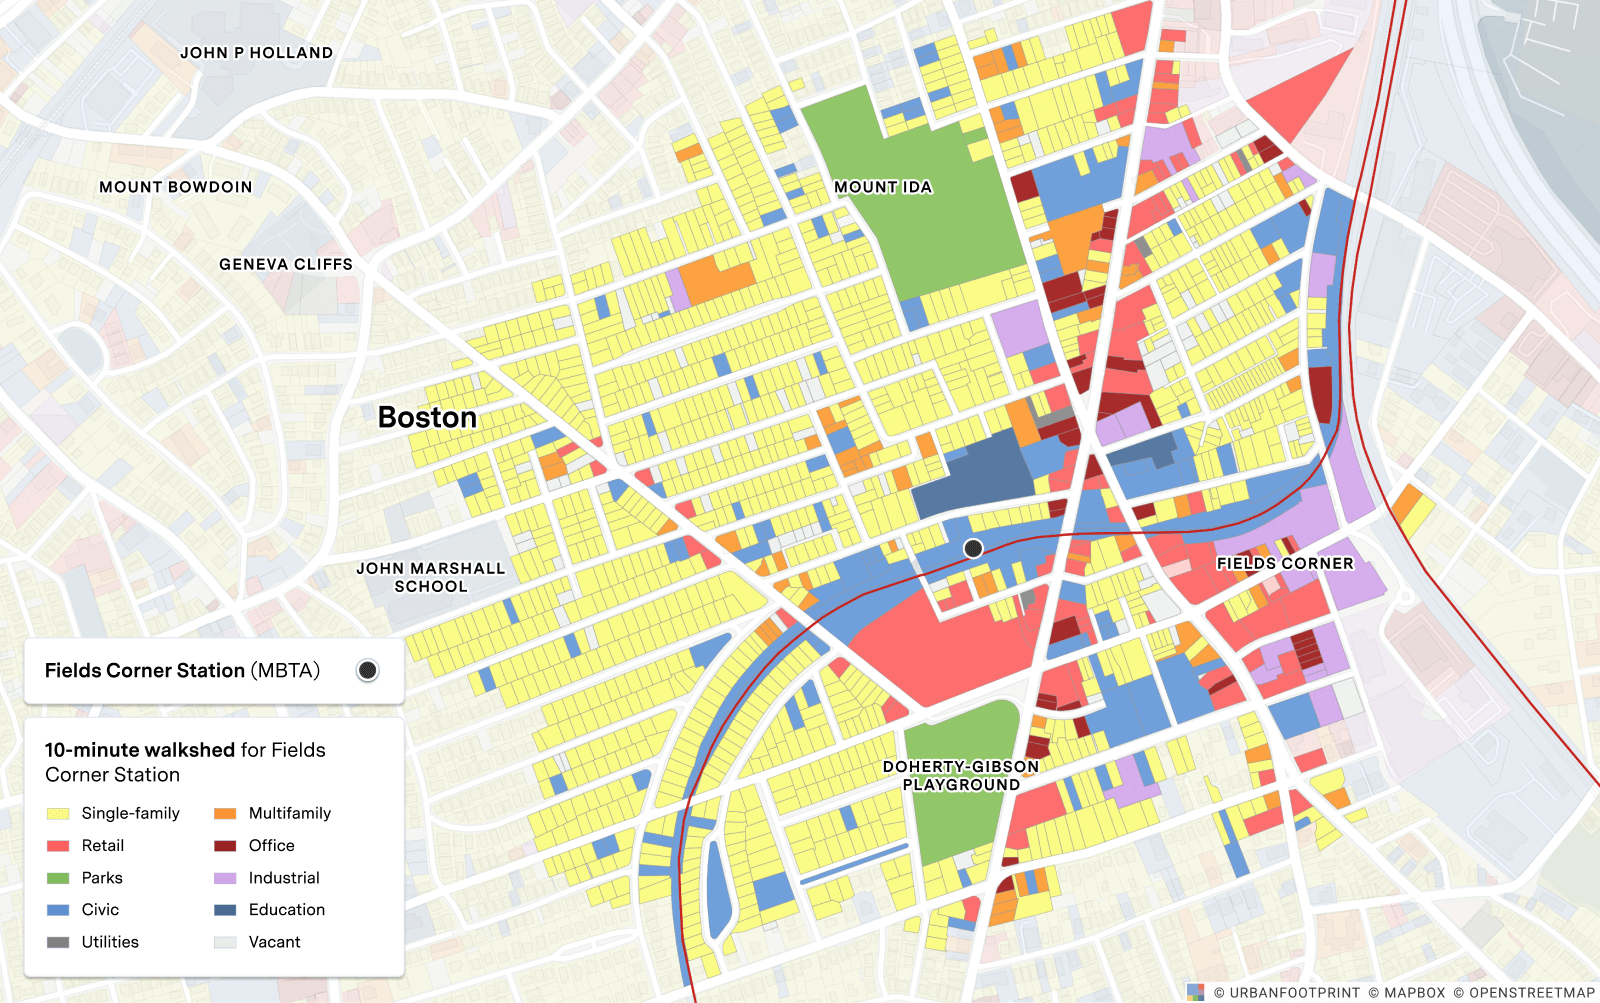
Transit-Oriented Development Planning
In combination with walk and bike accessibility analyses to identify parcels within station access areas, use UrbanFootprint’s parcel data to evaluate existing development characteristics, current zoning, property values, property taxes, and more to inform planning, guide upzoning decisions, and prioritize investments. Use key metrics like floor area ratio (FAR) and improvement-to-land value ratio to assess sites for redevelopment potential.
Economic Impact Analysis
Property values and taxes are essential for fiscal and economic impact analysis with respect to land use and development. Within UrbanFootprint, you can run analysis to summarize average housing and commercial real estate values, or calculate residential and commercial tax bases by jurisdiction or for individual planning areas. You can also connect these property data with the parcel-level outputs from the Risk & Resilience analysis module to gauge property value and tax revenues at risk to flooding, wildfire, and sea level rise.
For analysis that requires property values or tax data as inputs to further calculations or modeling, for example to project revenues from a planned TIF district, you can export the data in CSV format.
Key Parcel Attributes for Every Planner
The Base Canvas and Parcel Reference Data contain a wealth of information to support existing conditions assessments, focused land use and market analyses, and scenario development. Here are a number of key attributes and how they support common planning needs.
Land Use and Building Characteristics
Standardized Land Use – Map and evaluate land use for existing conditions reporting and scenario development using the standardized UrbanFootprint land use classifications, which represent land use at four levels of detail. For further reference, you can look to the land use and property indicators included in the Parcel Reference Data.
Local Zoning – Identify local zoning designations to assess currently allowable development or evaluate potential changes. The Parcel Reference Data includes local zoning codes where provided by the county or other local jurisdiction.
Parcel Area – Find parcel acreage in the Base Canvas.
Building Floor Area – Use the Base Canvas to find residential and commercial square footages originally derived from assessors’ data, or imputed where the local data is missing values. You can also find building area attributes in the Parcel Reference Data.
Floor-Area Ratio (FAR) – Assess urban form and development intensity, and identify parcels that may be underutilized. Found in the Parcel Reference Data, FAR is the calculated ratio of the total floor area of buildings on a parcel to the land area of the parcel.
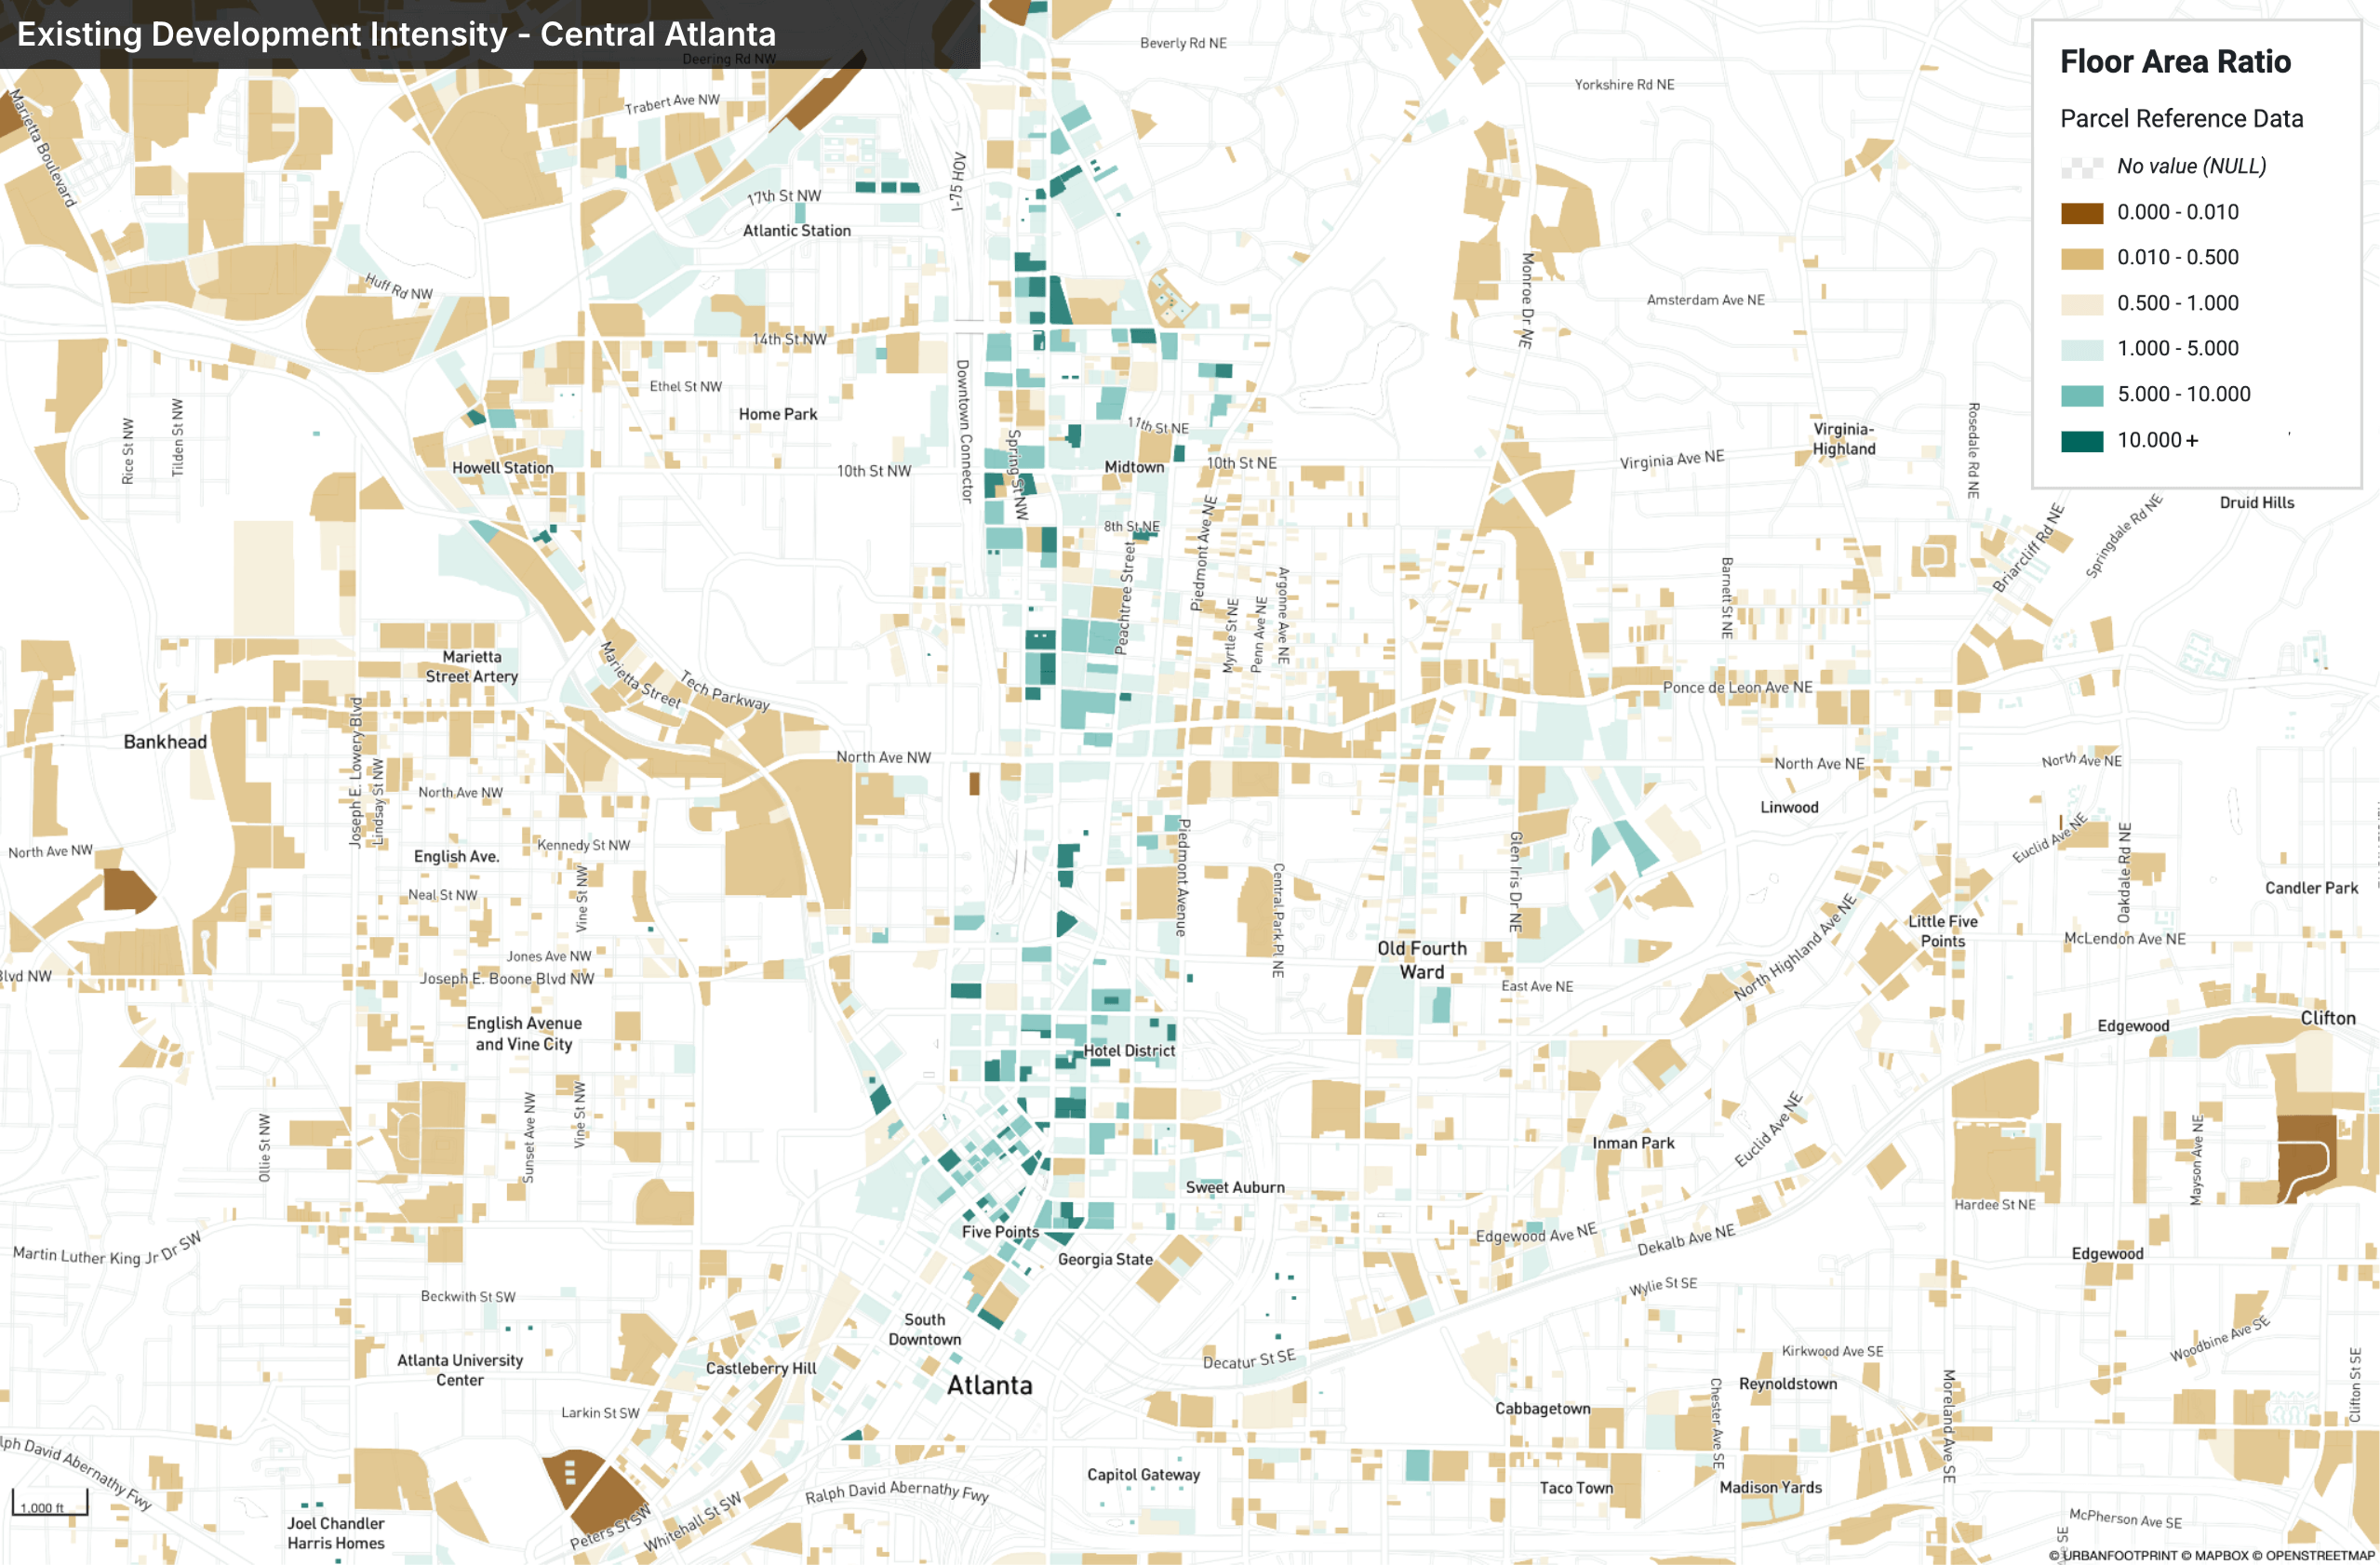
Units – Find numbers of residential or commercial units within parcels according to county assessors in the Parcel Reference Data.
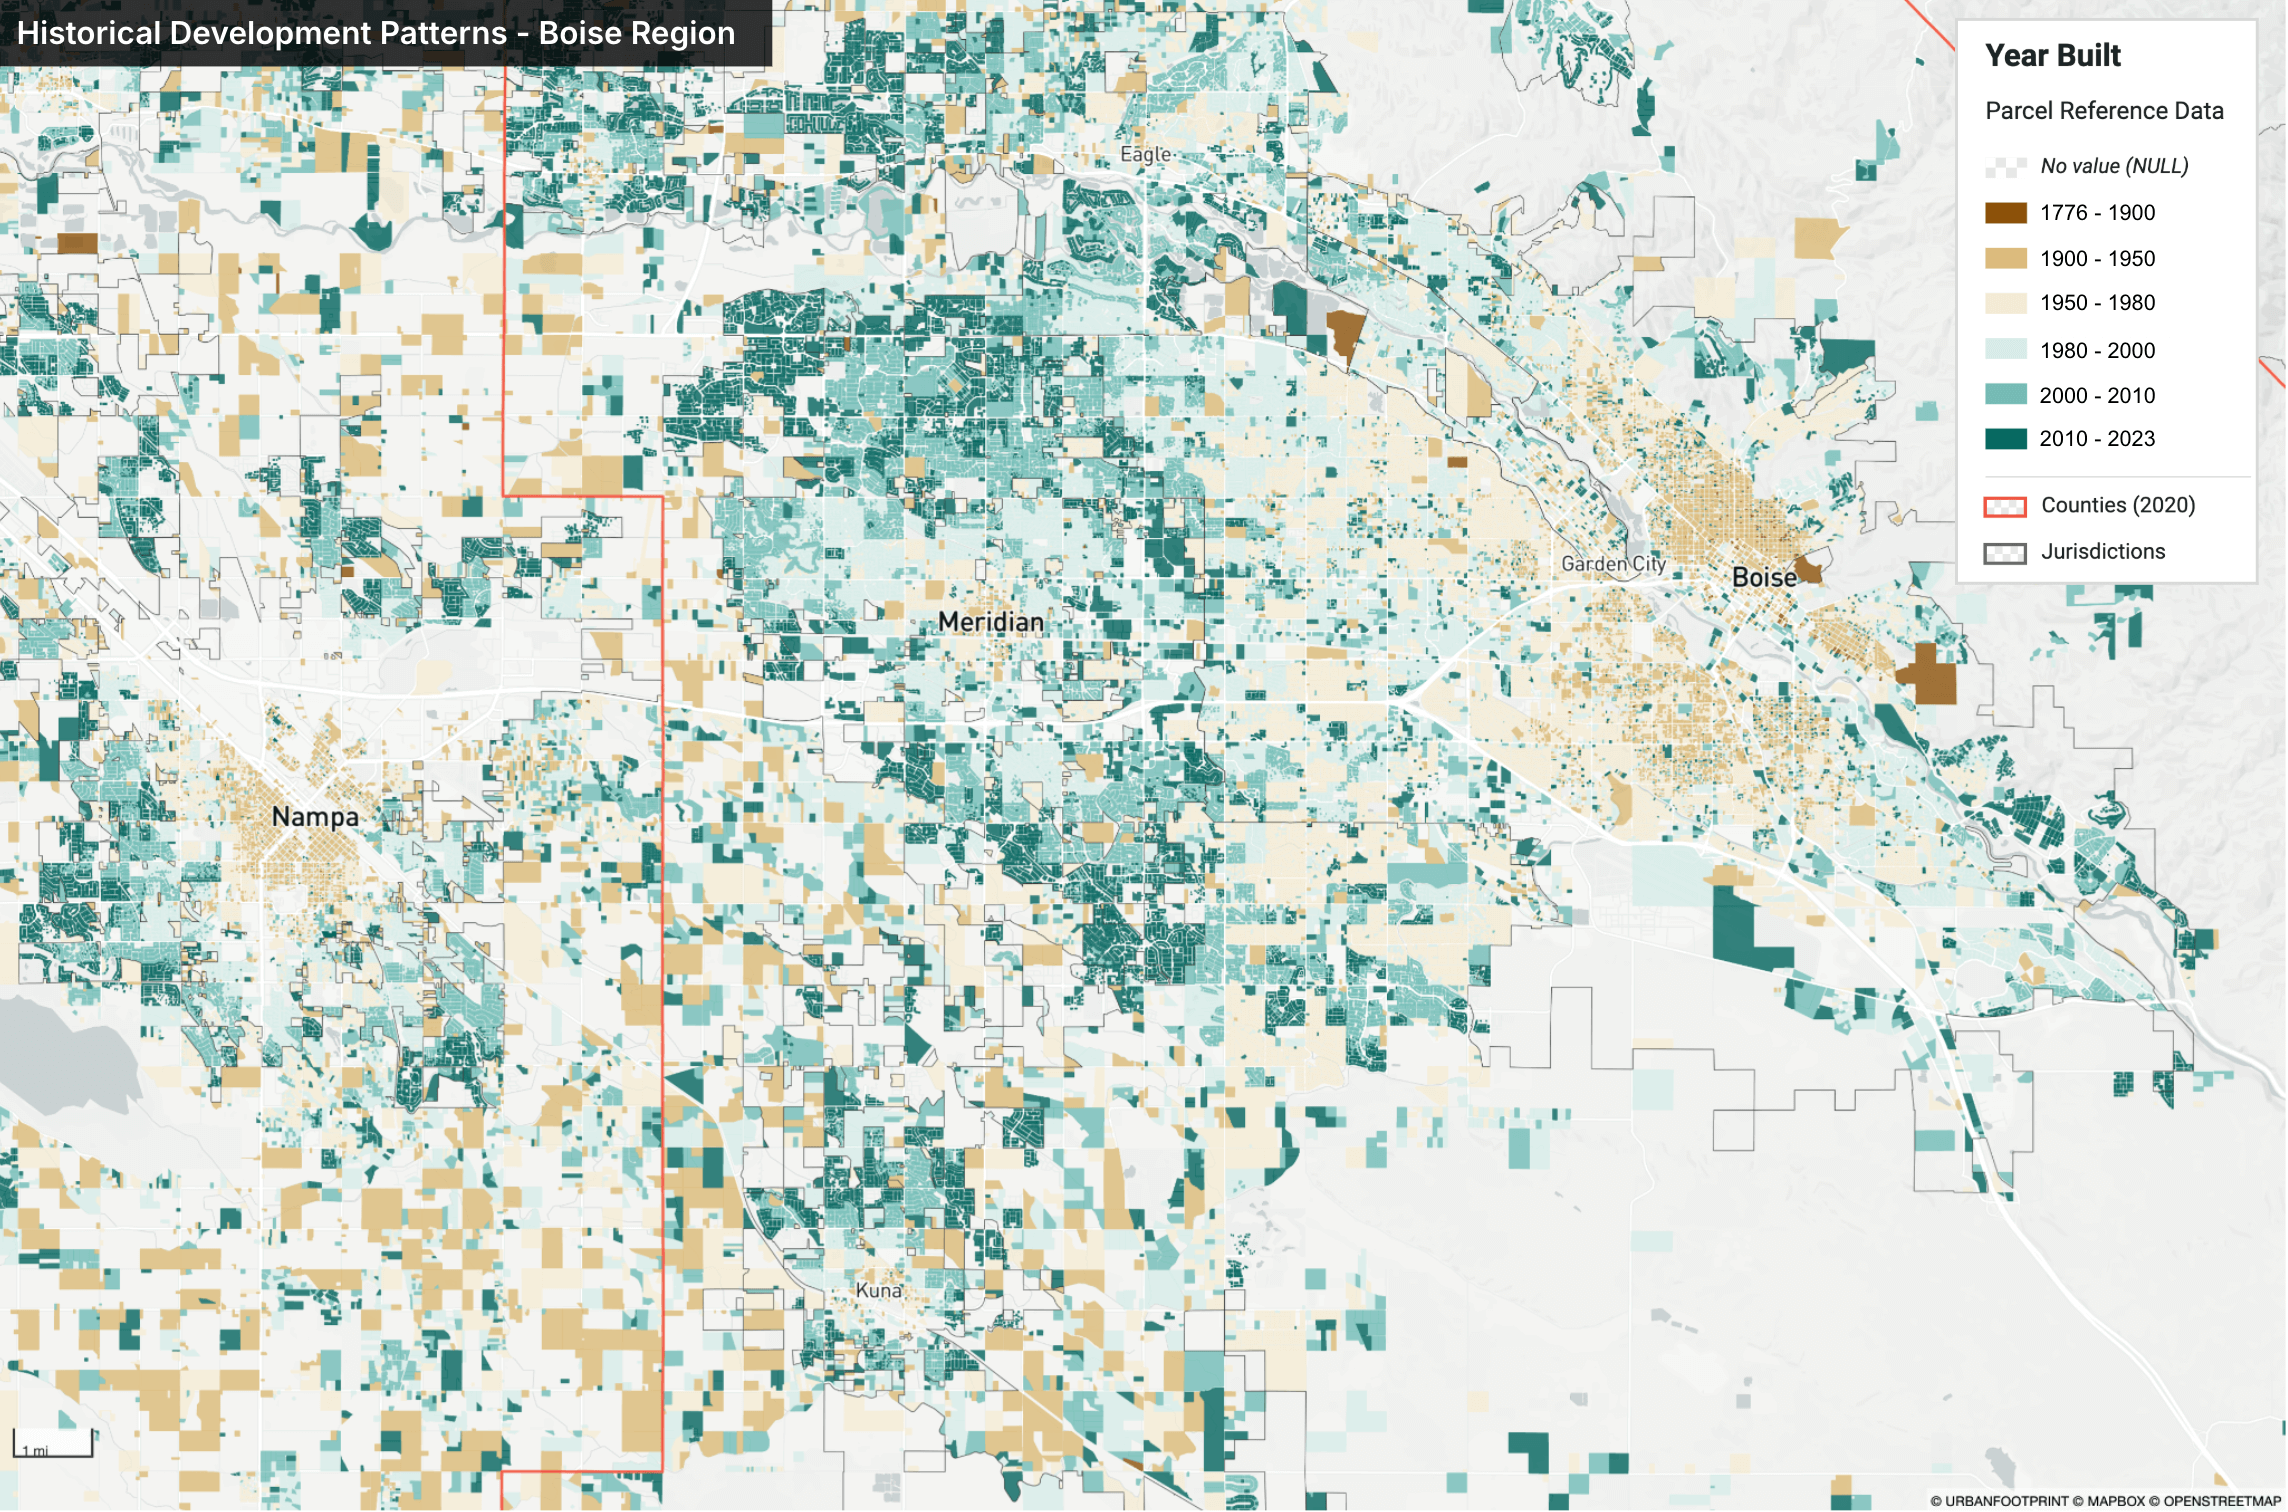
Year Built – Use construction year information in the Parcel Reference Data to analyze historical development patterns, or inform building energy efficiency program or policy planning.
Vacancy – Identify parcels that may have infill or redevelopment potential using the Vacant land use classification in the Base Canvas, or see the classifications available directly from county assessors in the Parcel Reference Data.
Assessor’s Parcel Number (APN) – Identify or locate specific parcels for further reference using the APNs in the Parcel Reference Data.
Address – Find parcel addresses in the Parcel Reference Data.
Property Value and Taxes
Property Values – Use market and/or assessed property values in economic or local fiscal impact analyses, or to inform tax increment financing (TIF) or special assessment district planning. The Parcel Reference Data includes current market and/or assessed values for improvements, land, and their total as provided by the county or local taxing/assessment authority.
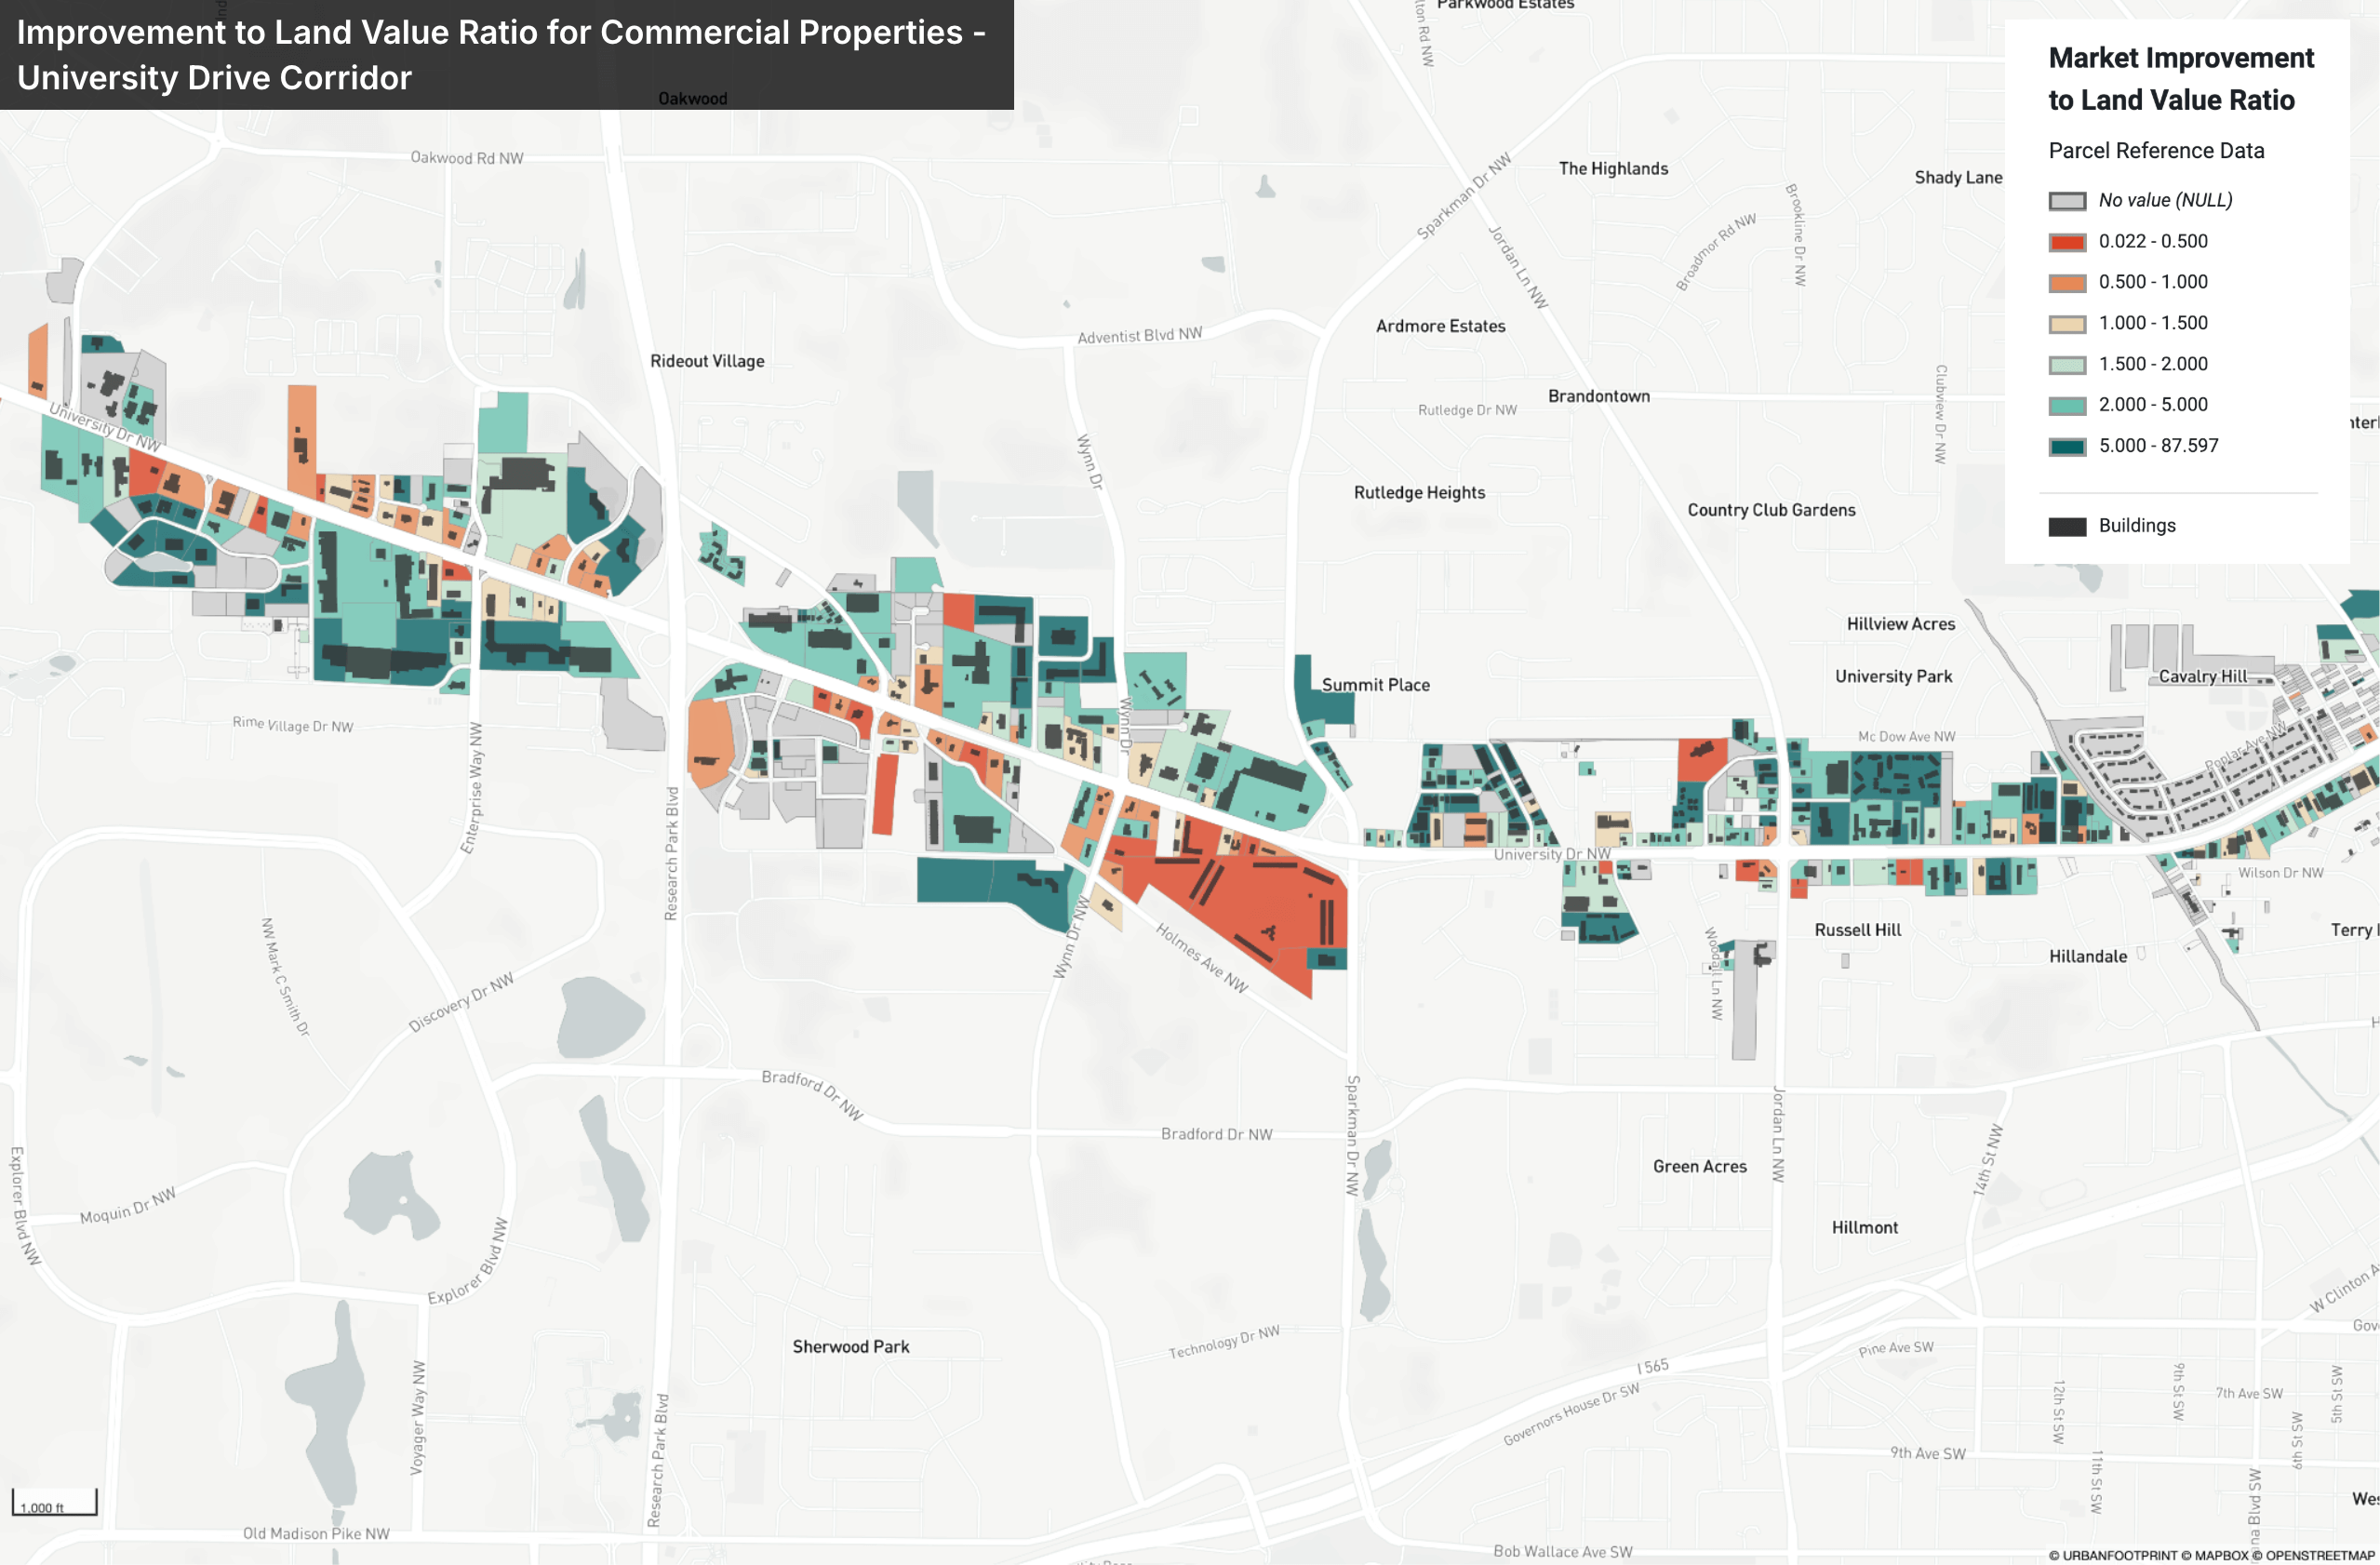
Improvement-to-Land Value Ratio – Identify parcels that may be underutilized according to their improvement to land value (or I/L) ratio. This is a calculated indicator of the value and condition of buildings or structures on a parcel compared to the underlying land, using market or assessed values.
Discover the Value in Your Parcel Data
UrbanFootprint’s Base Canvas and Parcel Reference Data empower planners to get to work quickly with essential parcel information all in one place. From land use planning to economic analysis, these data provide the foundation from which to draw valuable insights and guide smarter planning and decision-making.
Ready to up your planning game? Schedule a demo or training session with UrbanFootprint today.
