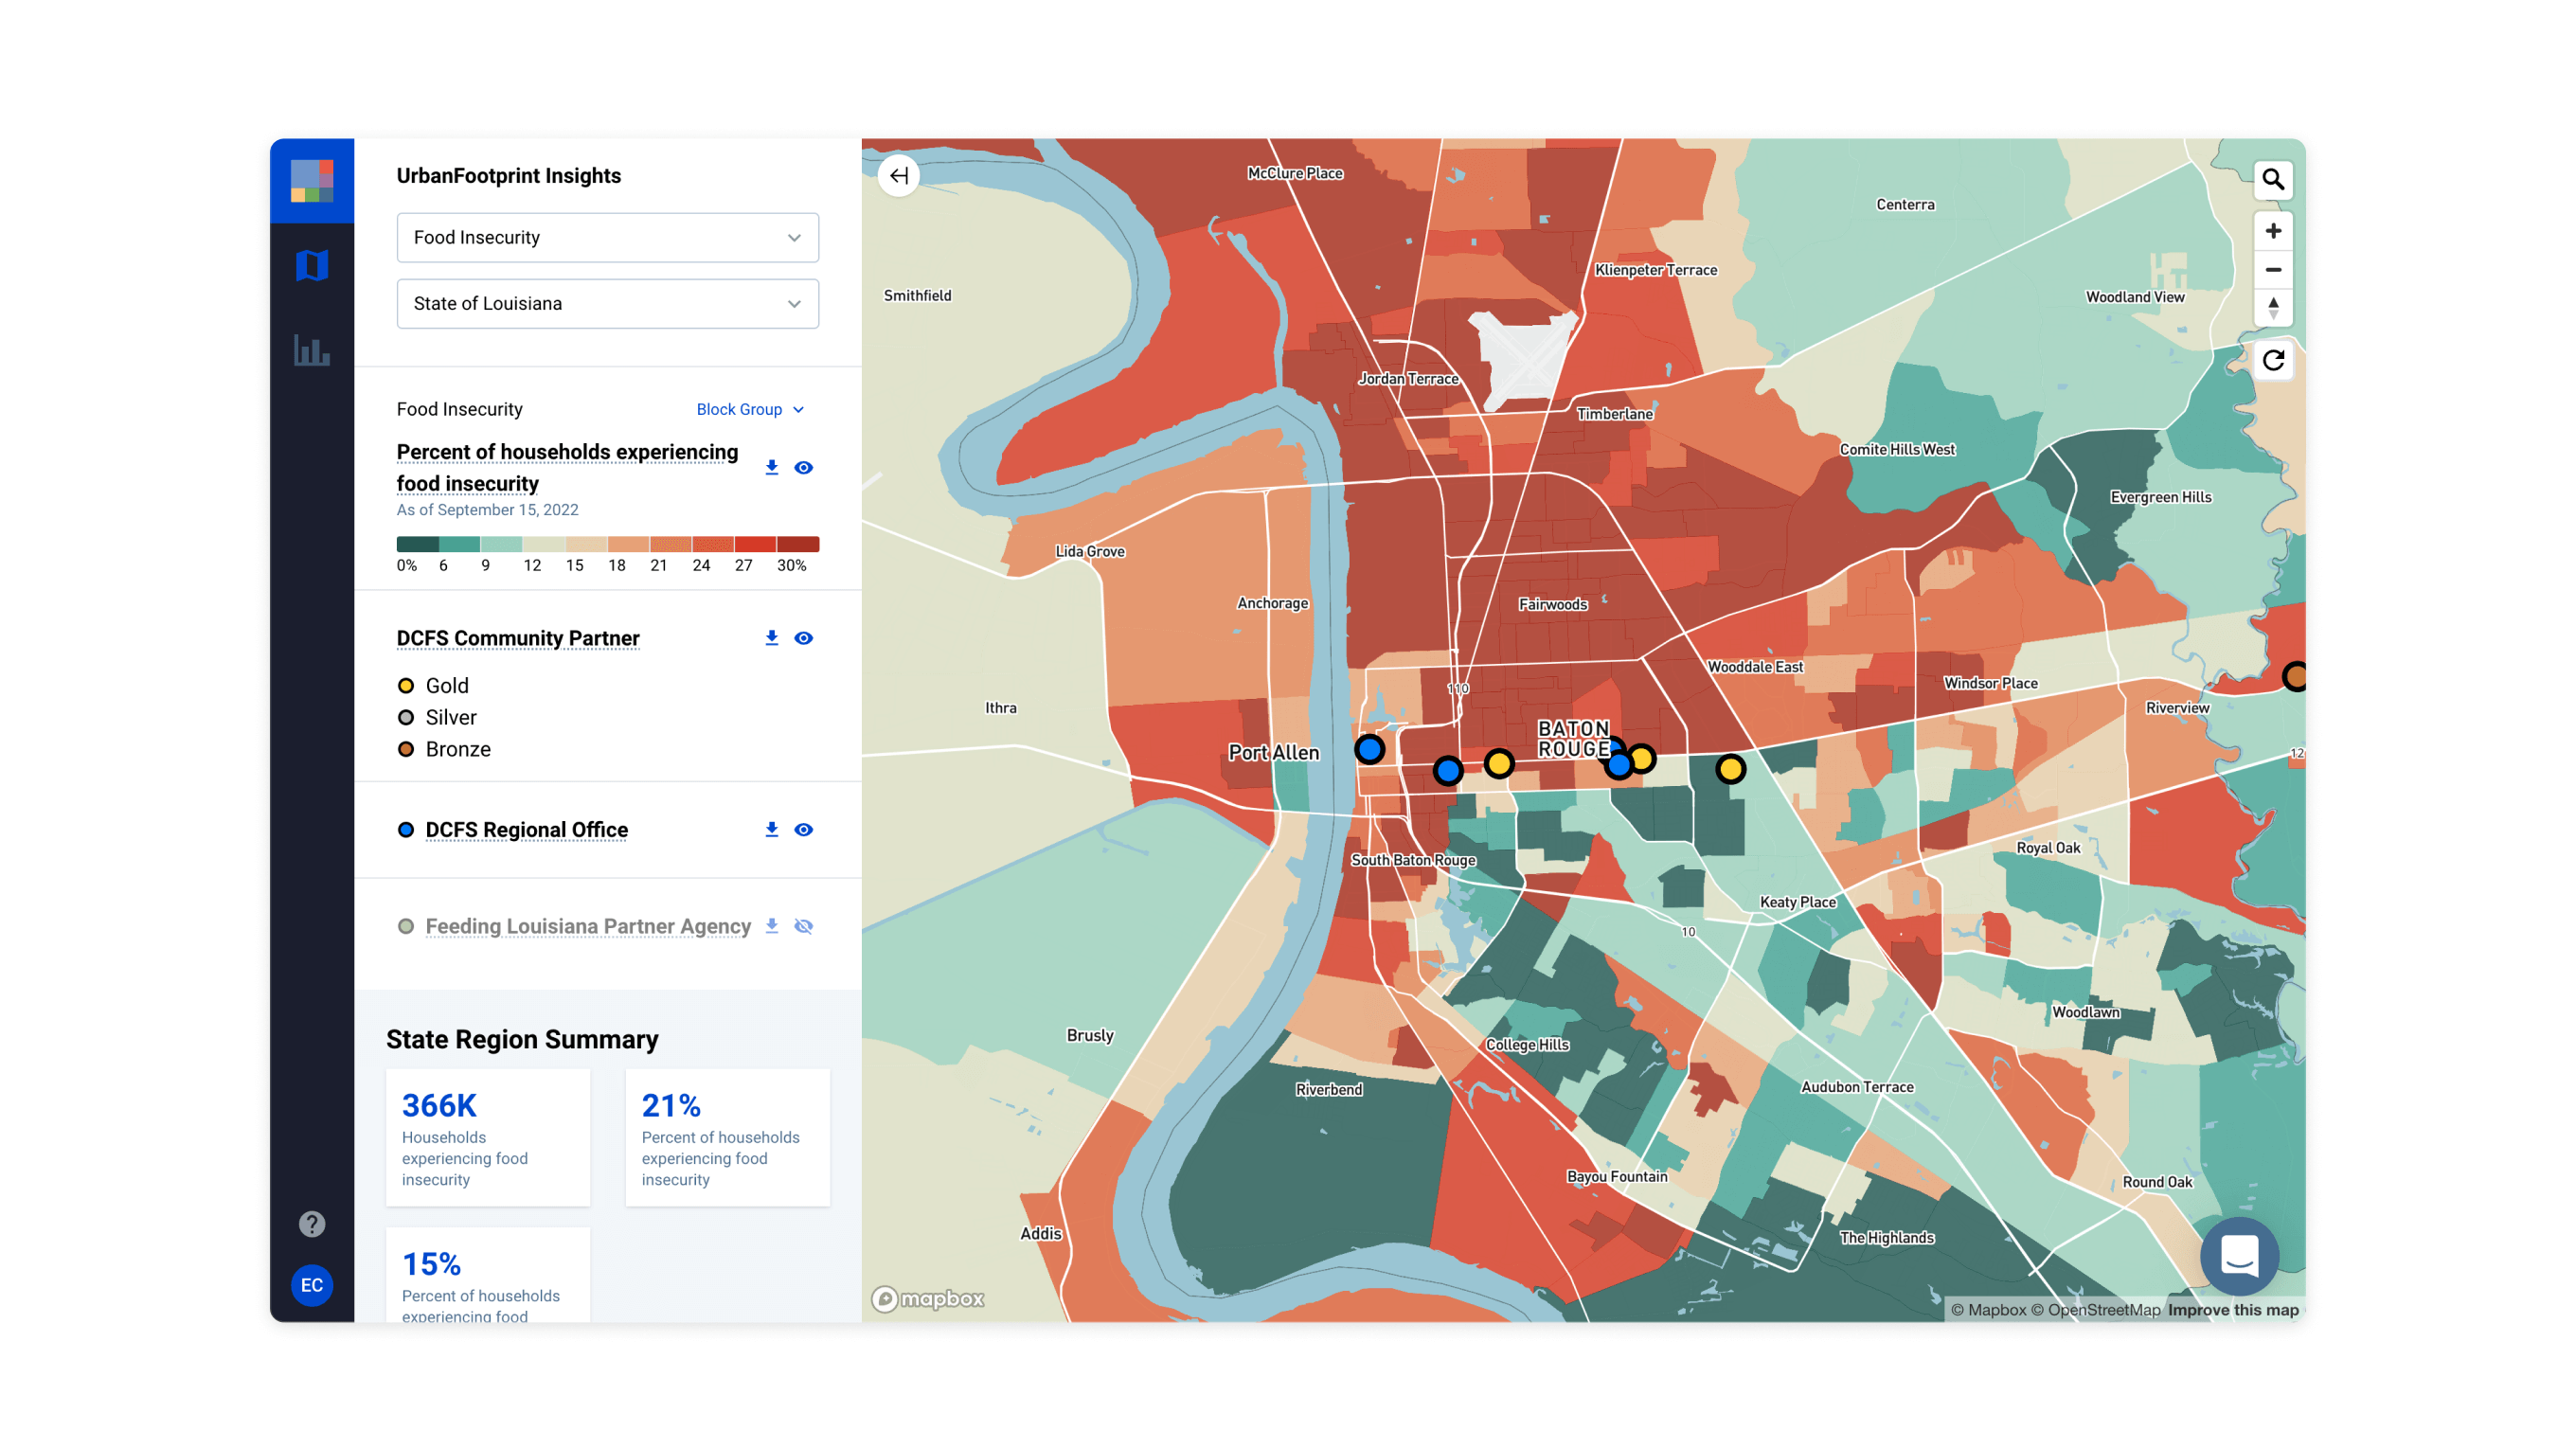
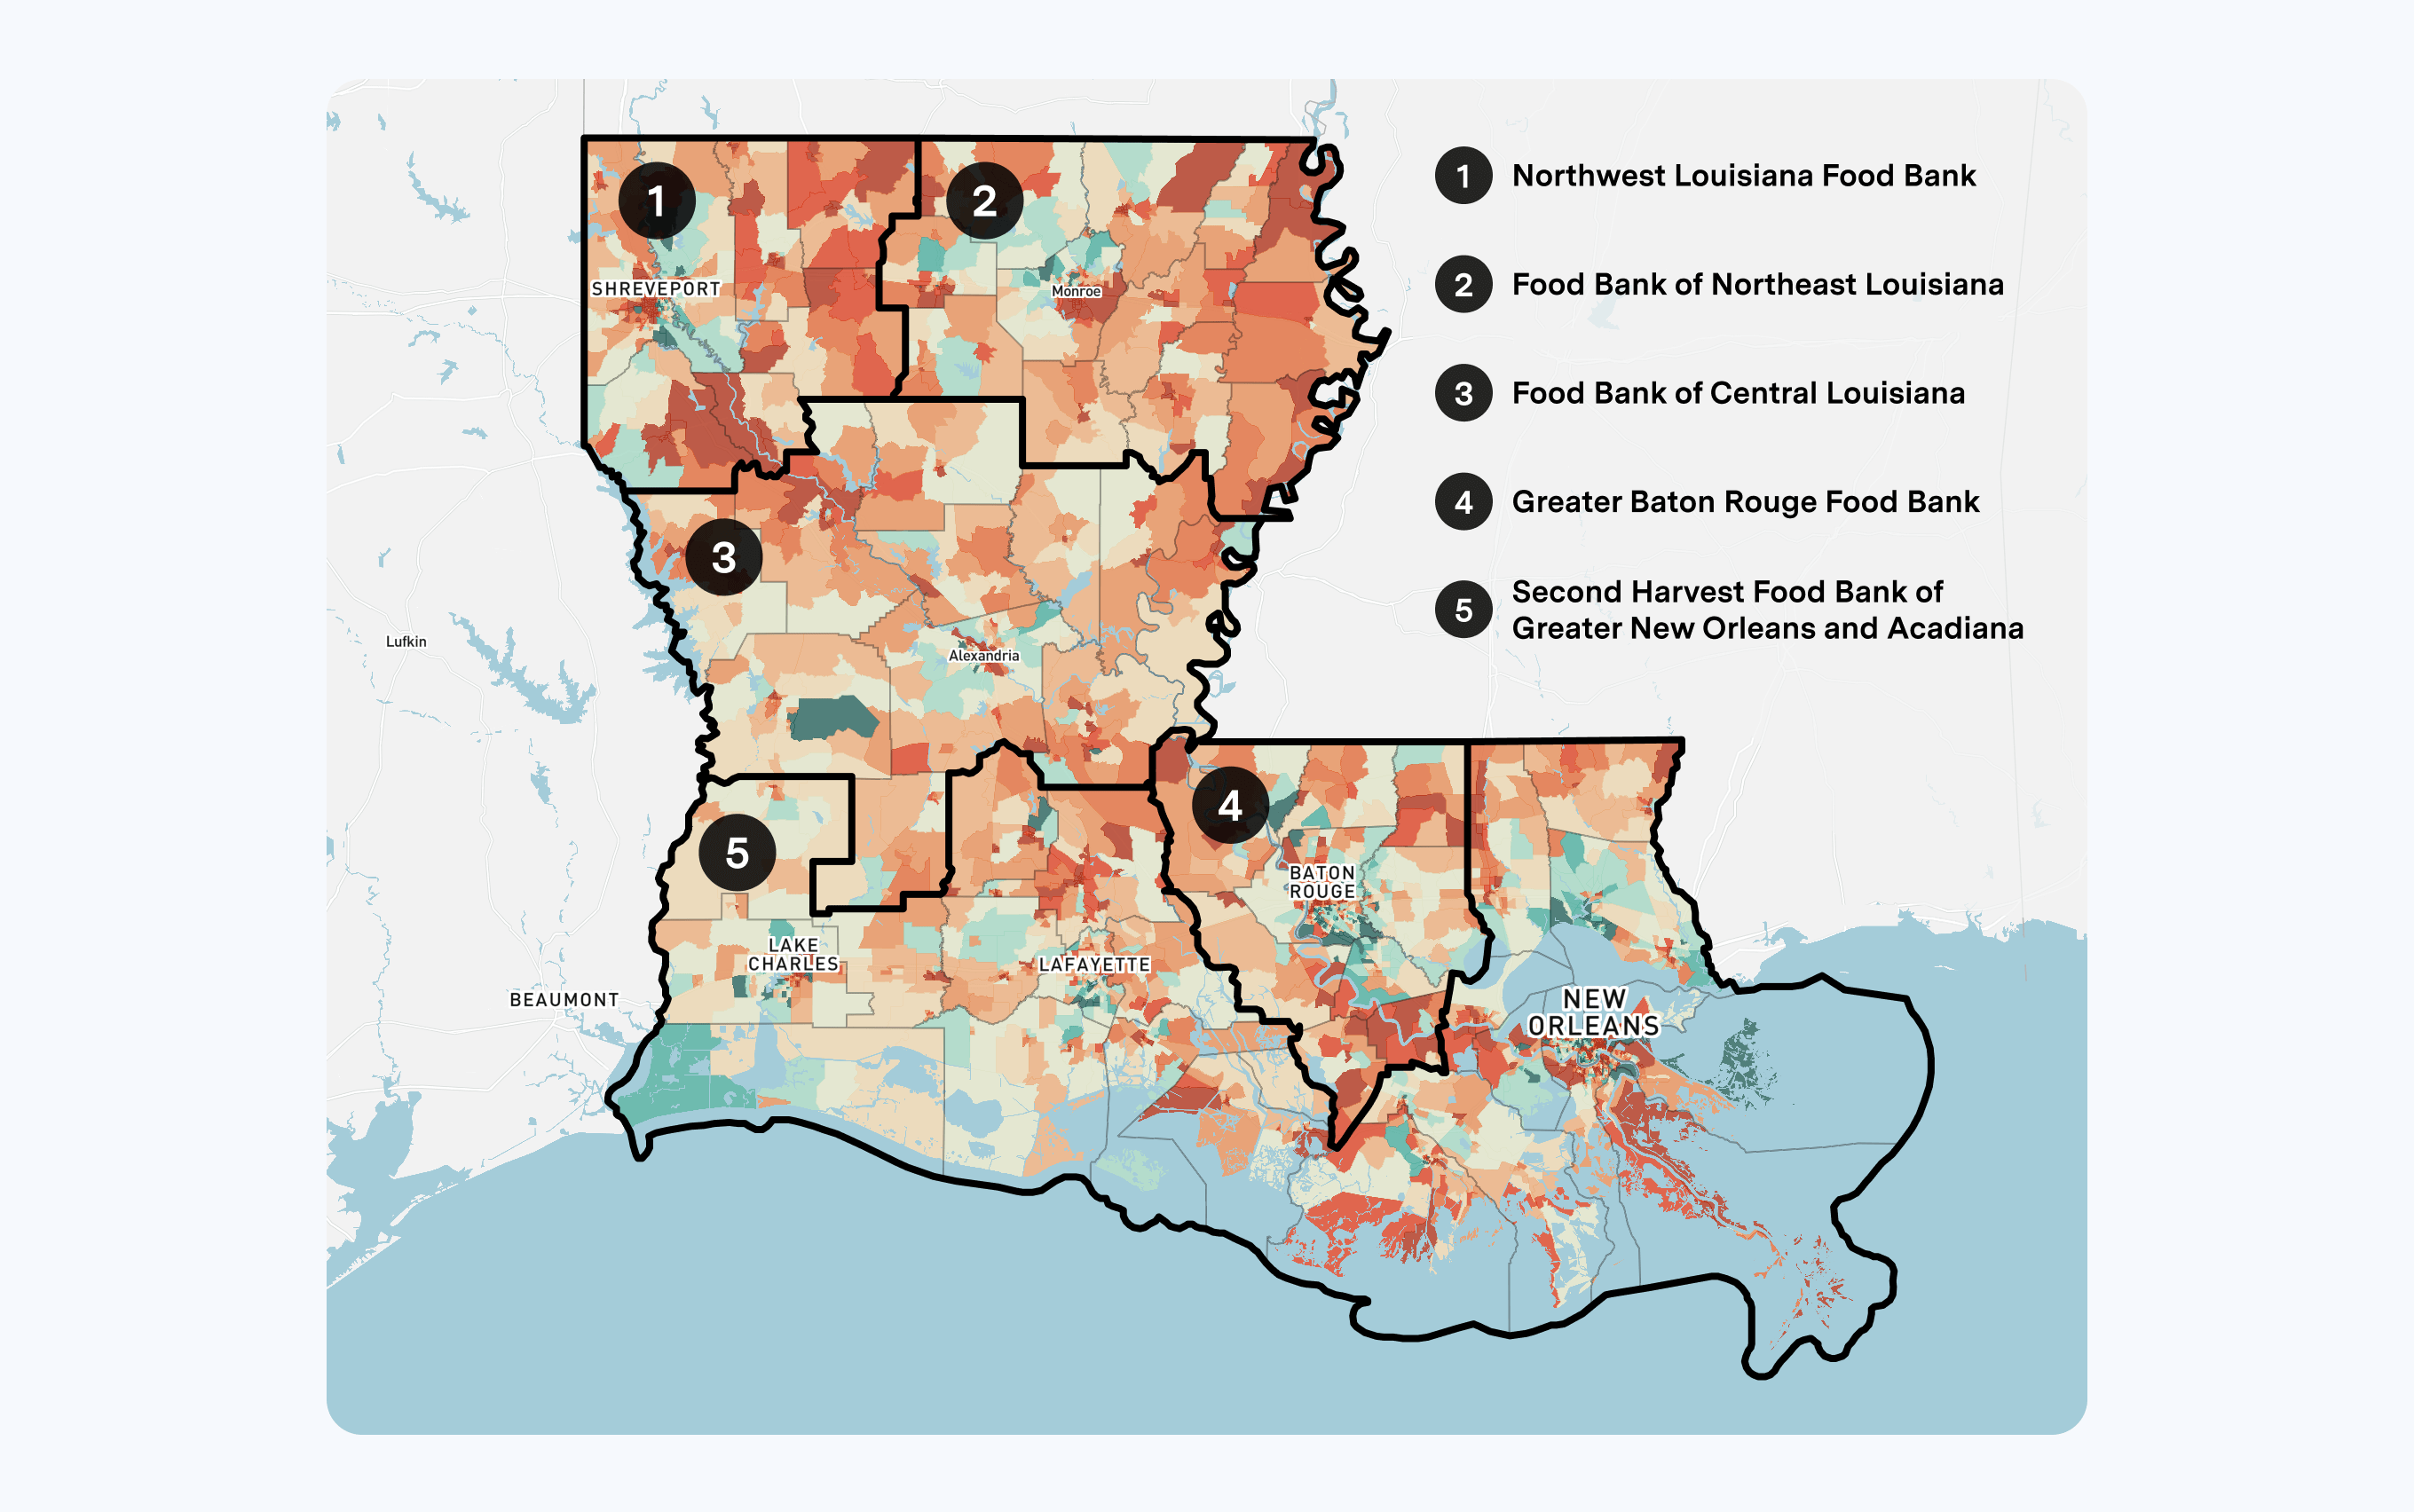
Actionable data visualization for central and regional offices
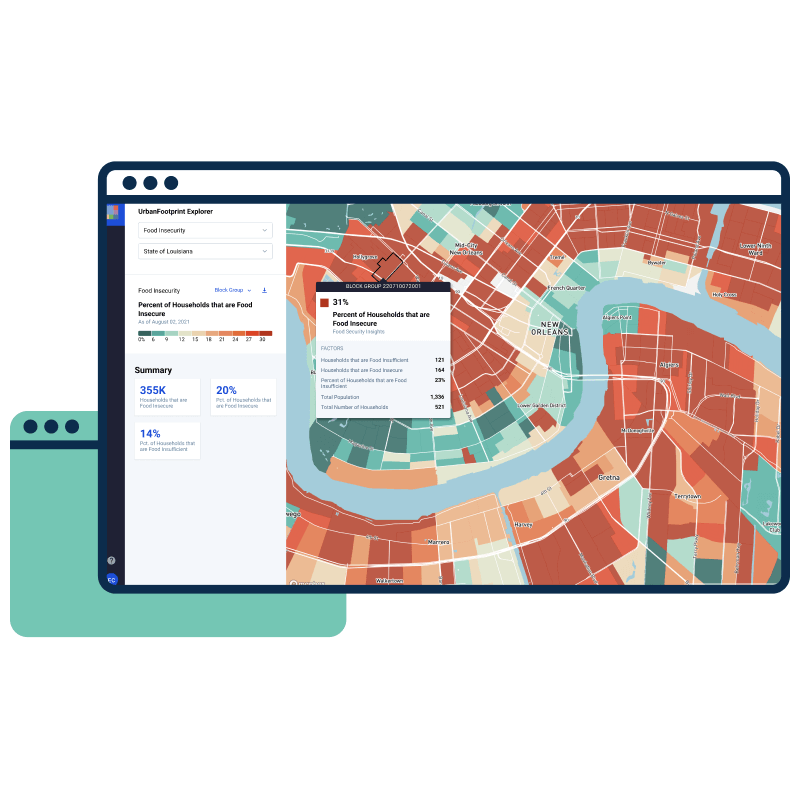
There are multiple stakeholders involved in SNAP program administration. Information sharing at DCFS had long been challenging, as is the case with many assistance programs that comprise multiple regional offices with localized community objectives. Knowing which communities were most in-need relied on local knowledge keepers and informal communication networks. And in the case of DCFS, each was operating with different systems and data (or in some cases incomplete data). This made collaboration significantly more difficult as all stakeholders were not coming to the table with the same ‘source of truth’ for how they should work together. The lack of alignment also delayed critical and time-sensitive action.
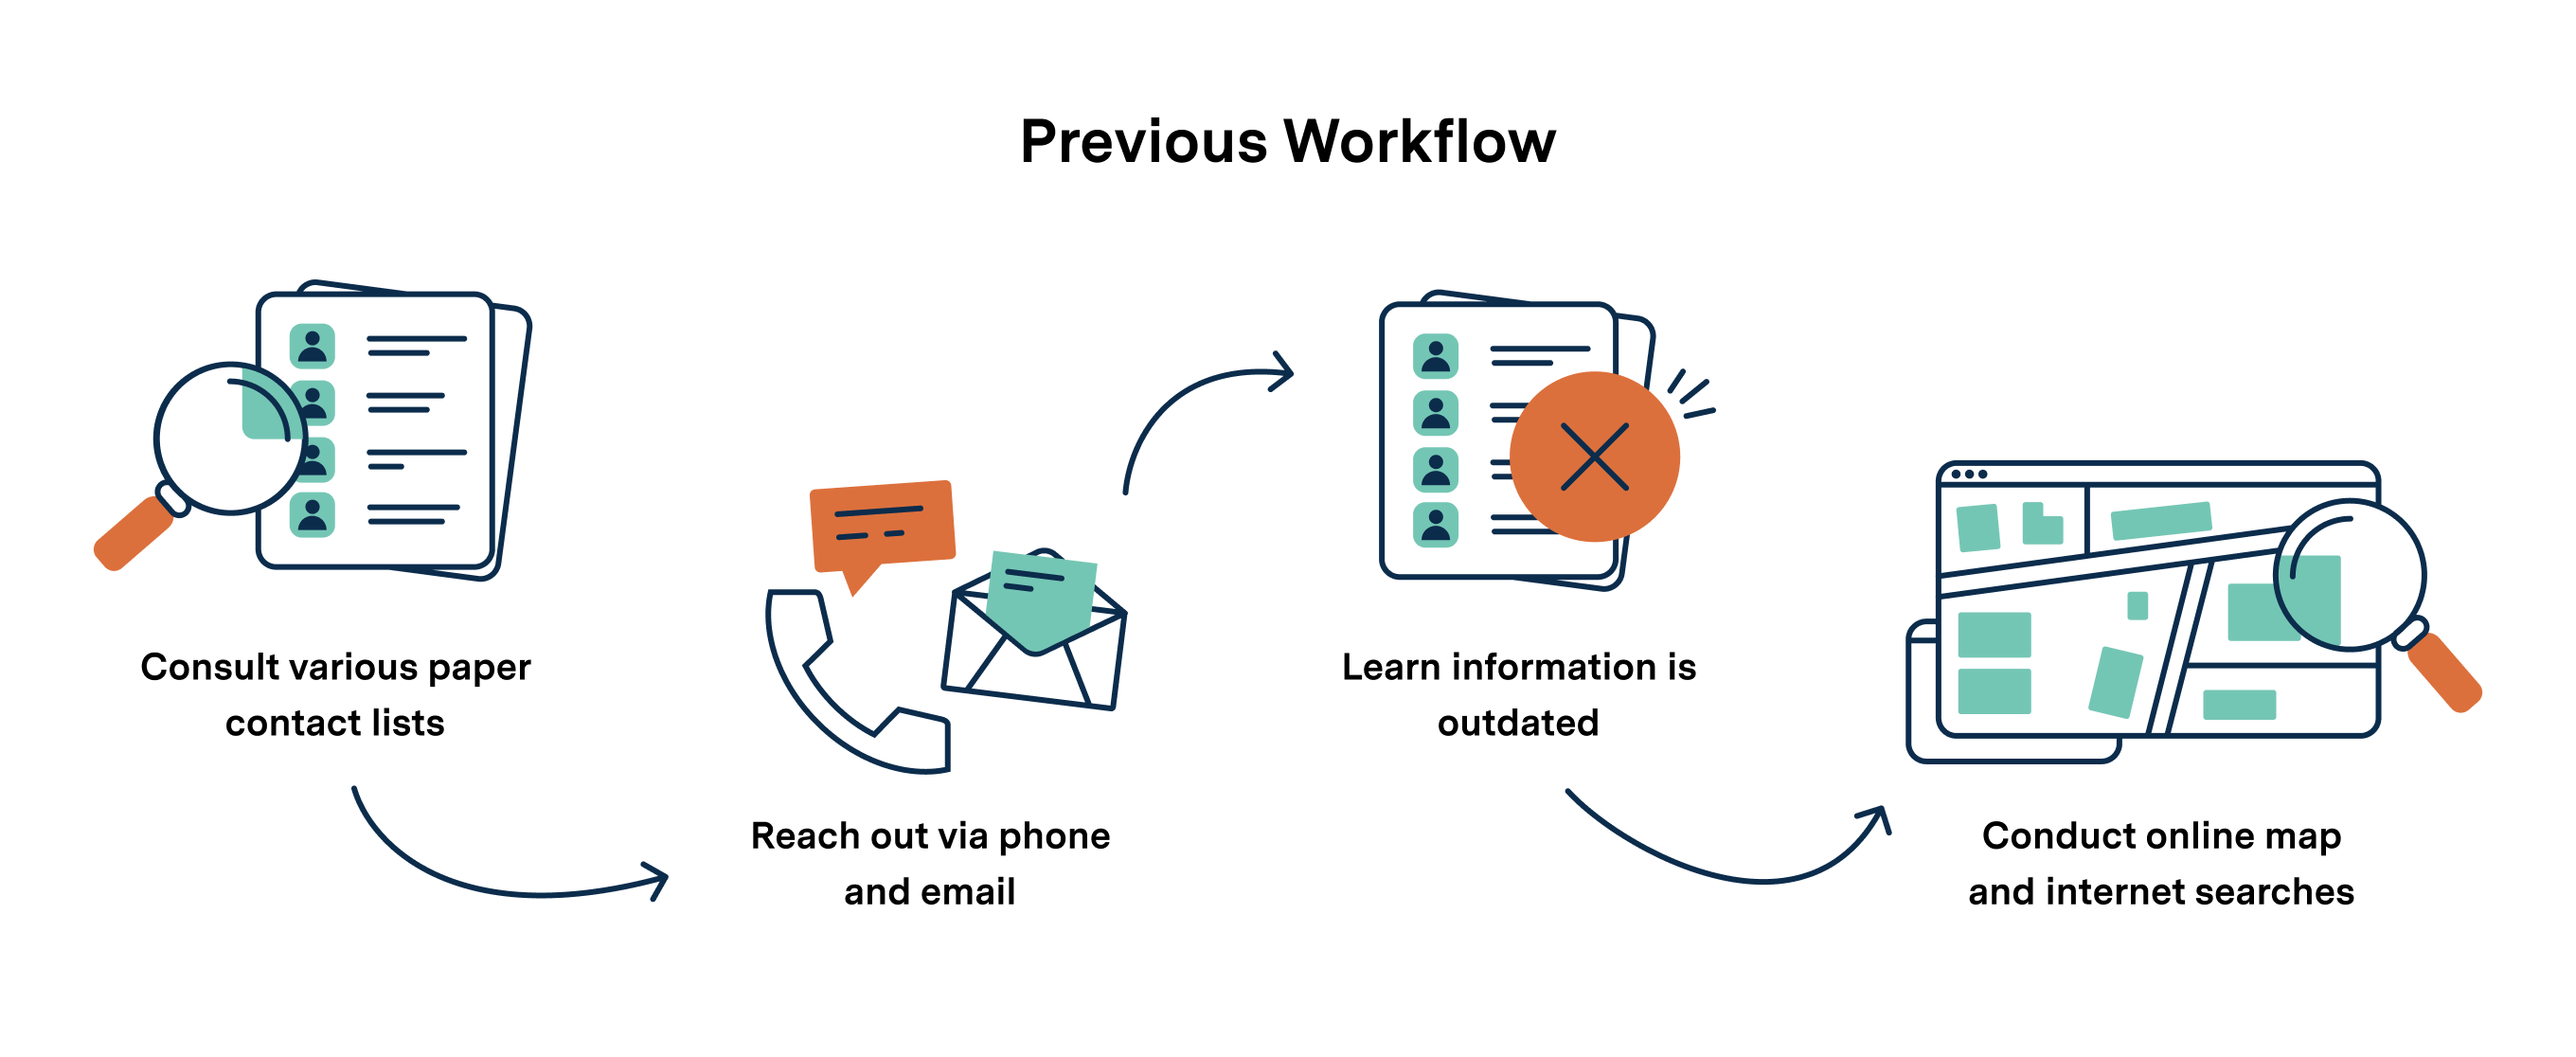
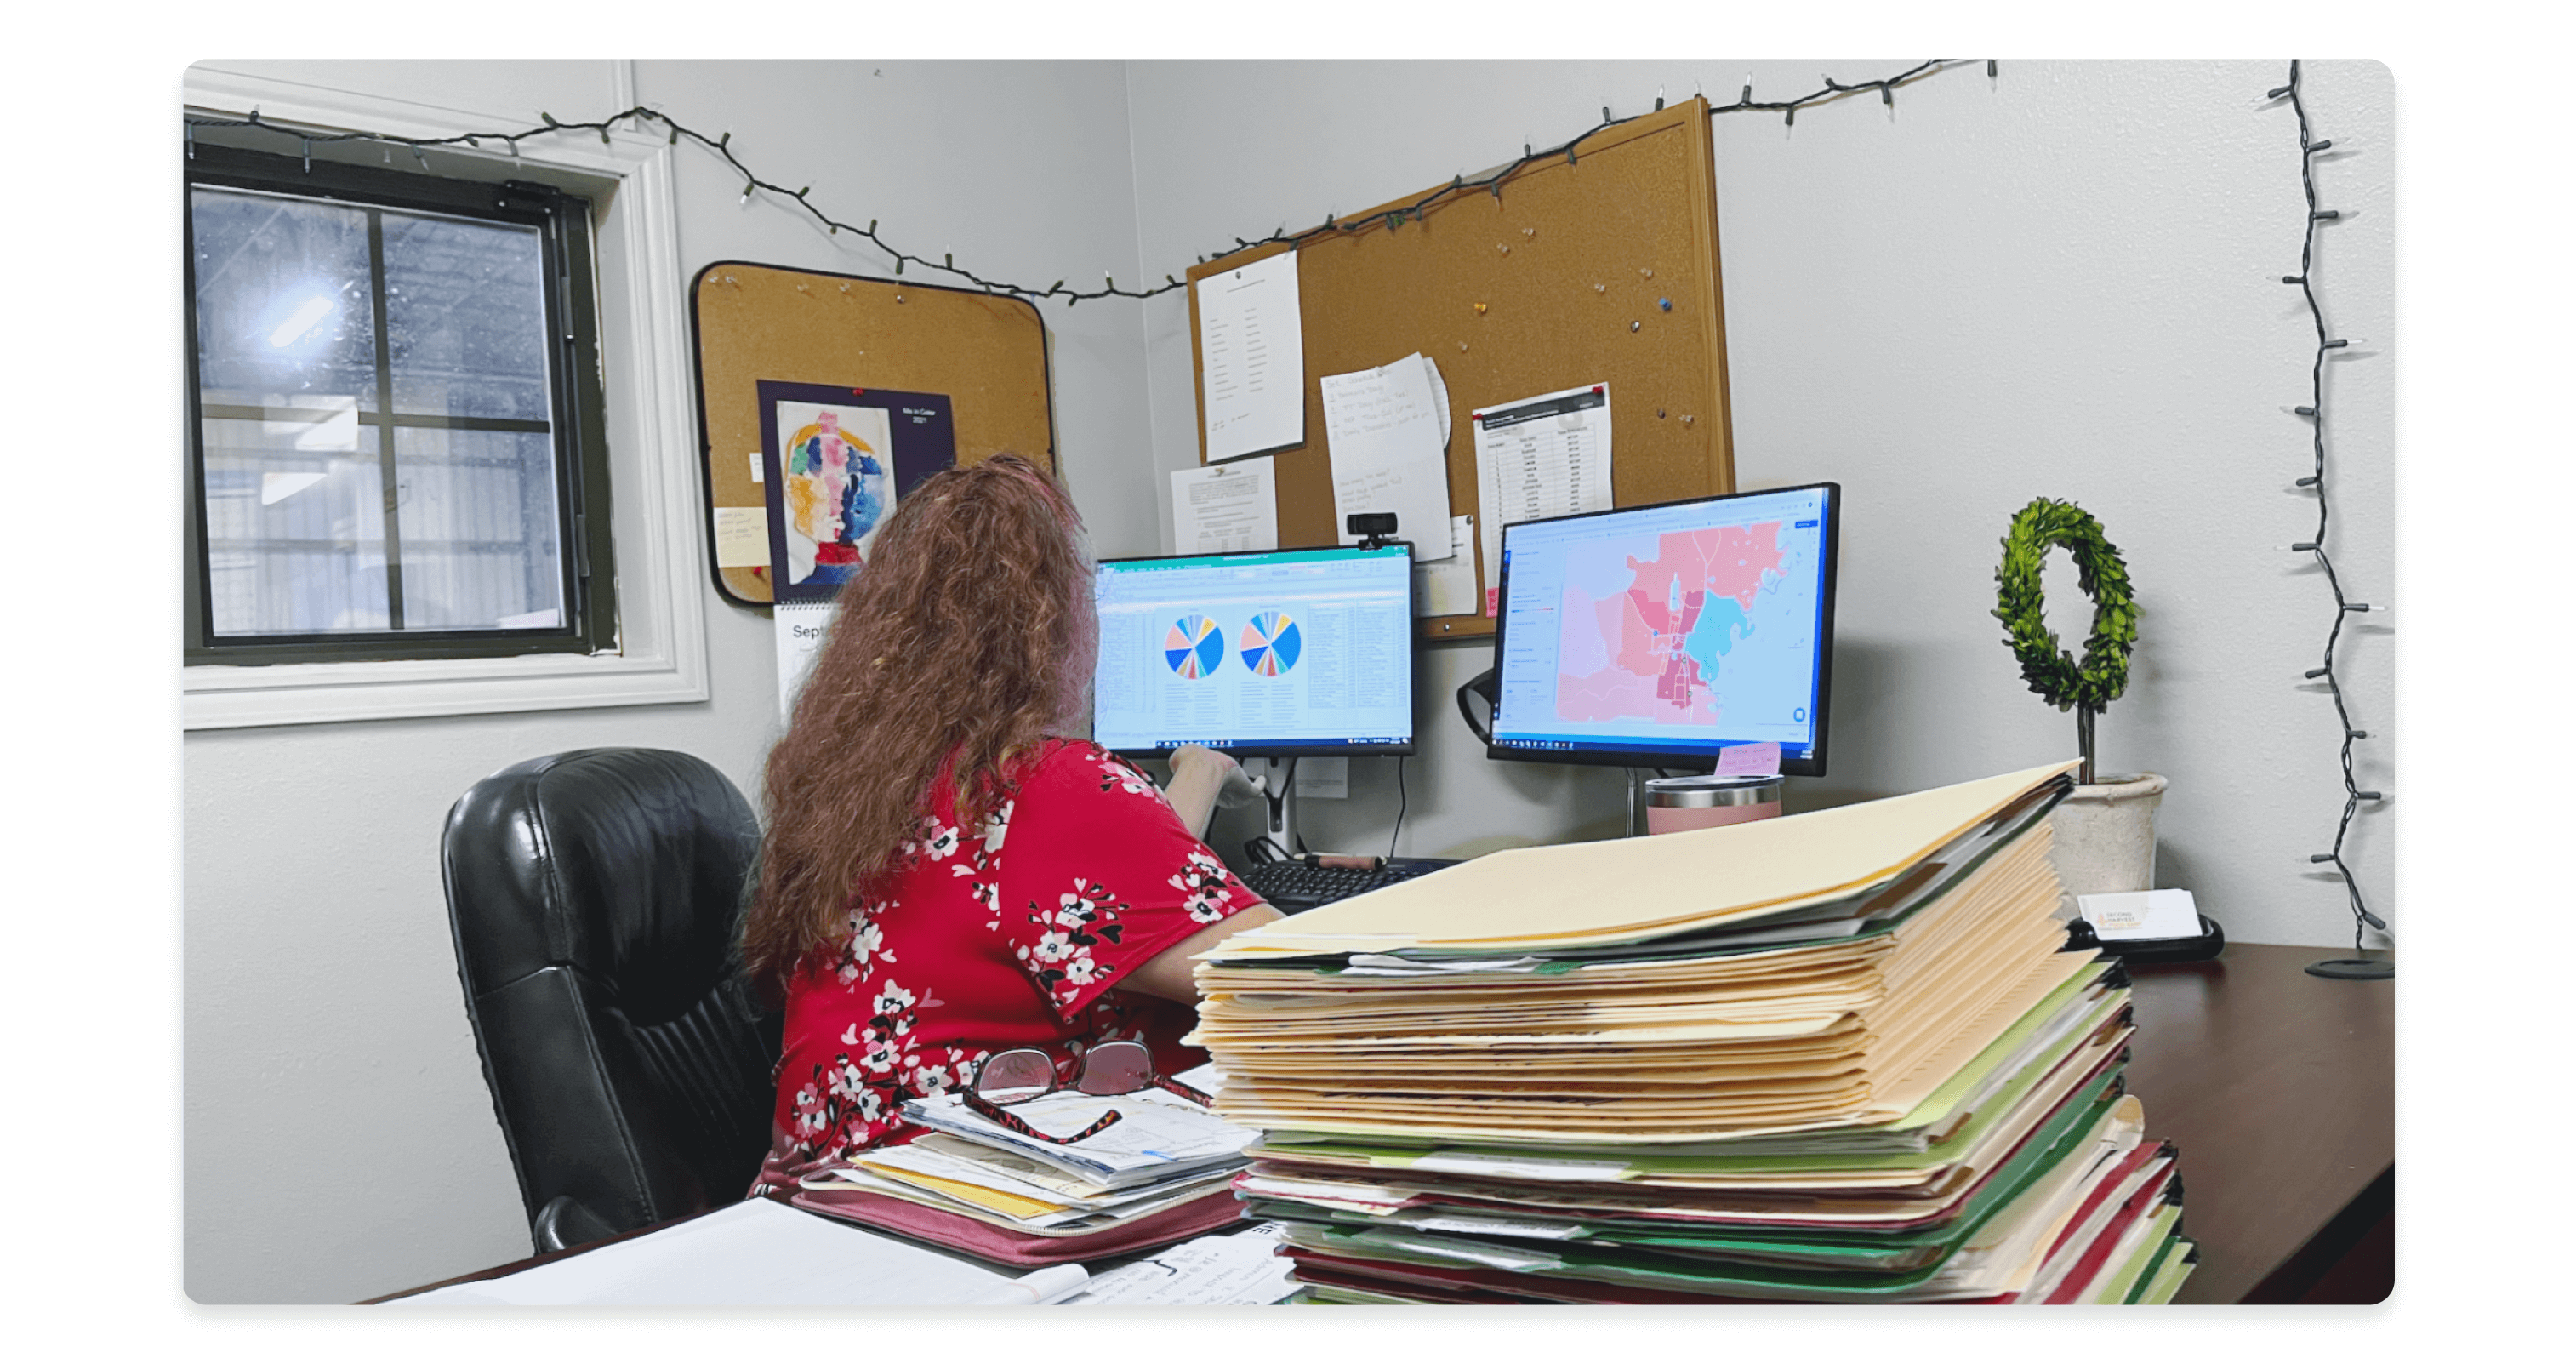
Food bank project managers, for example, who are committed to their communities but spread thin across multiple responsibilities, are constantly making the most with what they have. In a traditional workflow when they wanted to coordinate with a local CBO, such as a church or school, they would consult contact lists, various online maps, and internet searches to align delivery and distribution locations. This information was often outdated, limited, and part of a piecemeal and time consuming process, taking hours and days to operationalize. Working across multiple parishes, they often canvassed in cycles once per year rather than targeting areas that might be most in need at a given time. This resulted in resource limitations that lowered event impact, despite the extensive efforts of project managers, their teams, and volunteers.
