UrbanFootprint
Login
Request Demo
  • Solutions
        • Resilience Insights

          Power decision making with curated data and models assembled and intersected to surface insight

        • INSIGHT TYPES

        • Infrastructure & MobilityPhysical infrastructure, modernization, and the transition to electric vehicles
        • Public Service & AdministrationCommunity assistance, resource distribution, and program management
        • –

        • Climate Risk & SustainabilityClimate change, exposure to hazards, and impact analysis
        • Capital Markets & ESGInvestment evaluation, portfolio management, and ESG compliance
  • Technology
        • Our Technology

          The UrbanFootprint platform curates components of our Data Foundations to build Resilience Insights and deliver them through one or more Data Experience

        • DATA FOUNDATIONS

        • Built EnvironmentLand use, buildings, transportation, and infrastructure detail
        • People & VulnerabilitiesCommunity and household characteristics with modeled need
        • Climate & HazardsCurrent and future hazard risks plus land and assets impacted
        • DATA EXPERIENCES

        • AnalystCloud-based GIS mapping and analytics application
        • ExplorerCloud-based map visualization and dashboard application
        • Direct DataFlexible data integration and feeds to customer systems
  • Resources
        • RESOURCE TYPE

        • Case Studies
        • Solution Overviews, eBooks, and Whitepapers
        • LEARN MORE

        • Community Resilience
        • Climate Resilience
        • ESG
        • Social Equity
        • TECHNICAL SUPPORT

        • Product Documentation
        • Contact Us
  • Blog
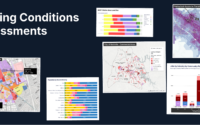
        • Existing Conditions Assessments Key
          Power Your Next Project with the UrbanFootprint Existing Conditions Dashboard
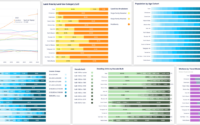
          Existing Conditions Dashboard Charts Key Image
          Launch Faster with UrbanFootprint’s New Existing Conditions Dashboard
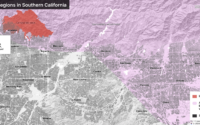
          Eaton Fire Area And Special Wind Regions In Southern California
          Spotlight on Wildfire Risk – How Wind, Weather, and Wildland Development are Fueling Extreme Events
          Sample view of updated transit data in San Francisco
          Fresh Data from UrbanFootprint
          Commercial Property Impacts in Altadena
          Impacts of the LA Fires: Setting the Context for Recovery
          SB6-SanJose@1200w
          Unlock the Powers of Unified Parcel Data with UrbanFootprint
        • View all blog posts
  • About
        • AboutLearn about our story and our mission statement.
        • Learn more

        • LeadershipMeet the faces behind the UrbanFootprint team.
        • Learn more

        • In the NewsNews and writings, press releases, and resources.
        • Learn more

        • CareersWe’re always looking for talented people. Join us!
        • Learn more

  • Login
    • Analyst  ↗
    • Explorer ↗
  • Contact Us

Climate Models and Methodologies

The data models developed by UrbanFootprint leverage trusted US government sources and authoritative private data providers to build peer-reviewed models and datasets built for actionable, real-world analysis and decision making.

Tropical Cyclone Wind Risk

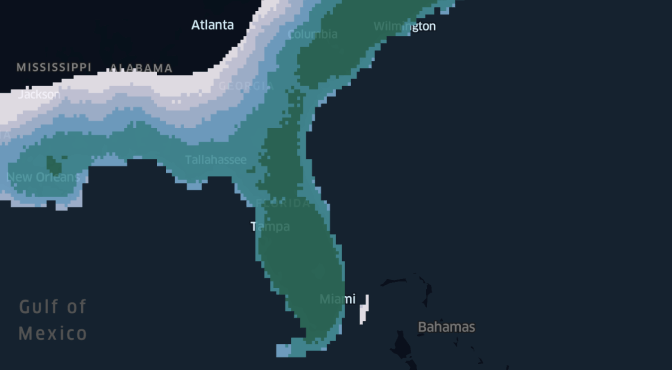
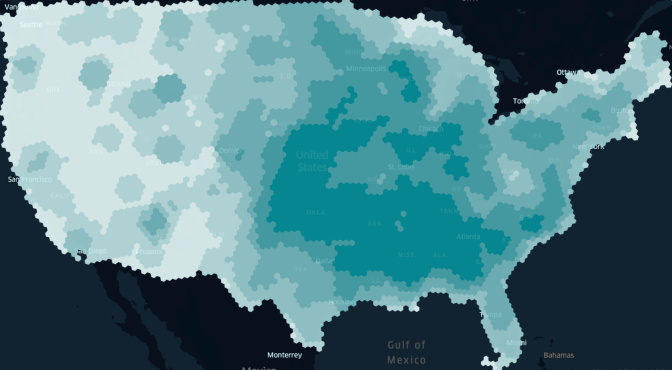
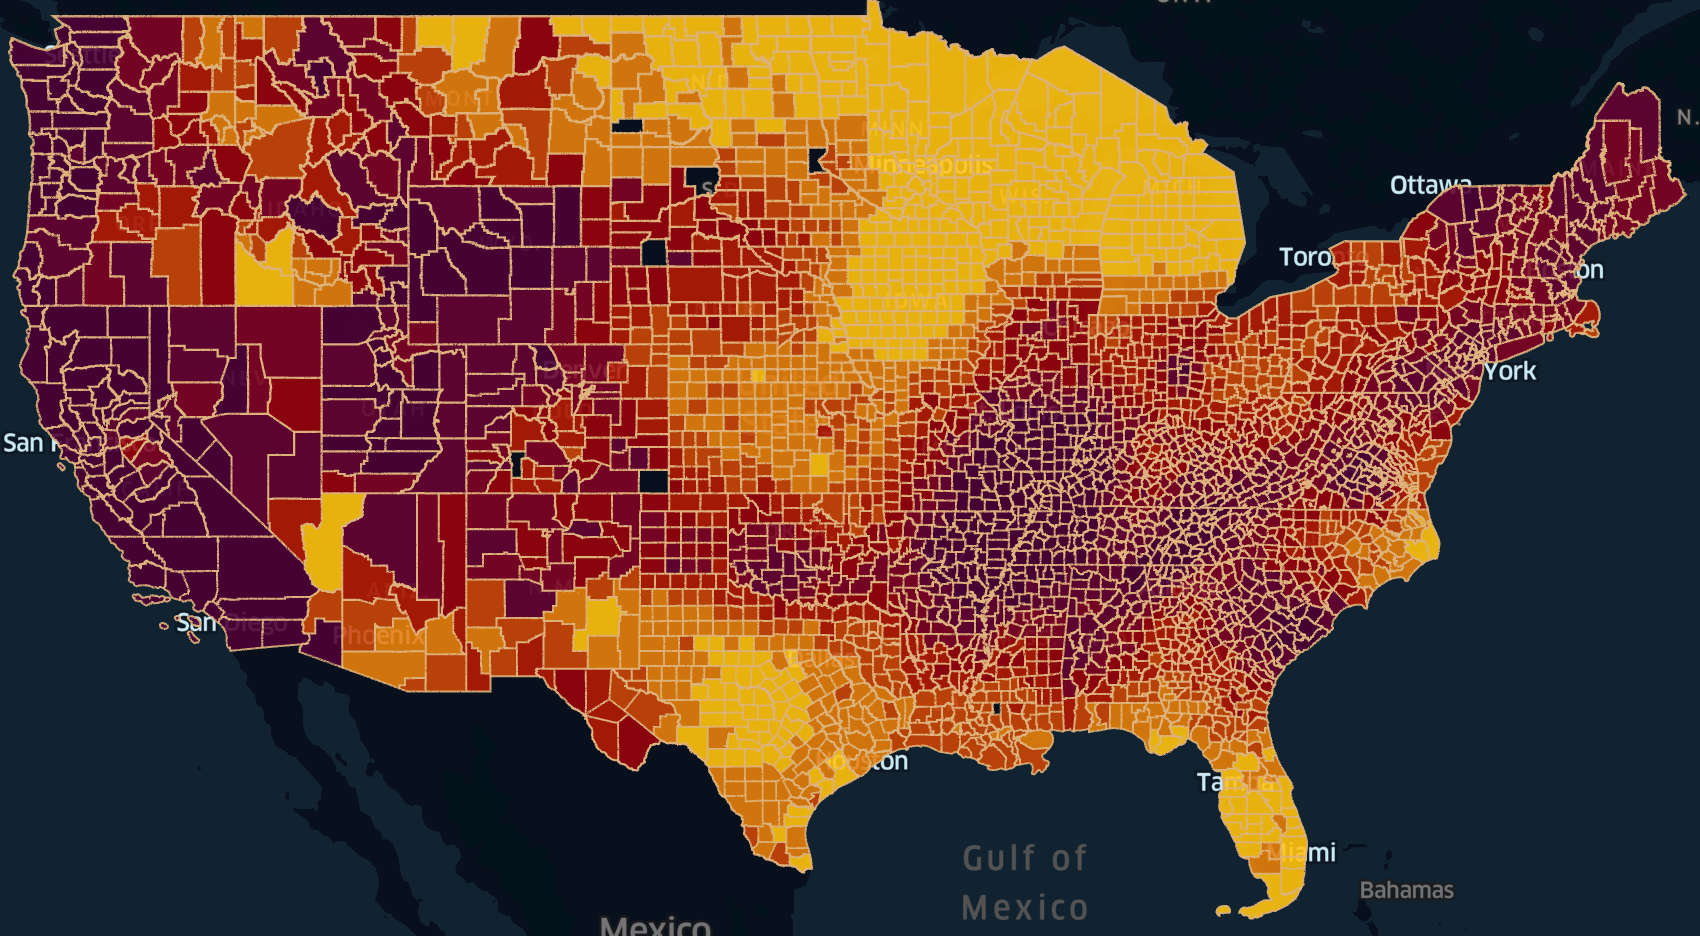
Hurricane Wind Risk

The UrbanFootprint Hurricane Wind Risk model estimates the rate of 1-min wind speed exceedance events per year on a 0.1 degree grid nationwide.

See Methodology ↗
Noncyclonic Wind Risk

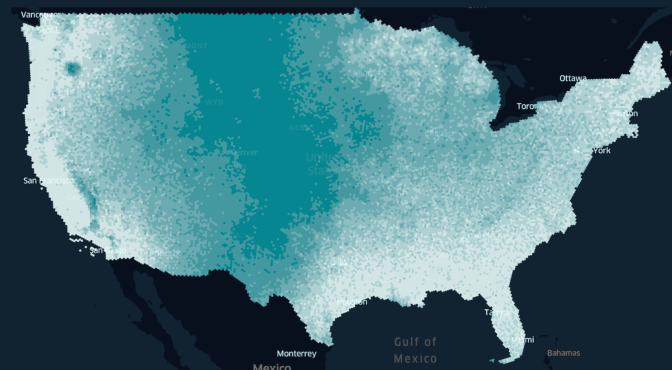
Strong Wind Risk

The UrbanFootprint Strong Wind Risk model estimates probabilities of exceedance at various wind speeds for CONUS on an H3 zoom level 5 grid.

See Methodology ↗
Tornado Wind

Tornado Wind Risk

The UrbanFootprint Tornado Wind Risk model generates probabilities of exceedance for CONUS on an H3 zoom level 4 grid.

See Methodology ↗
Coastal Flood Risk

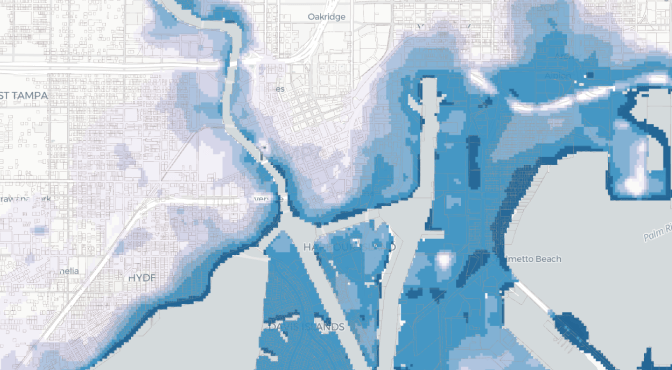
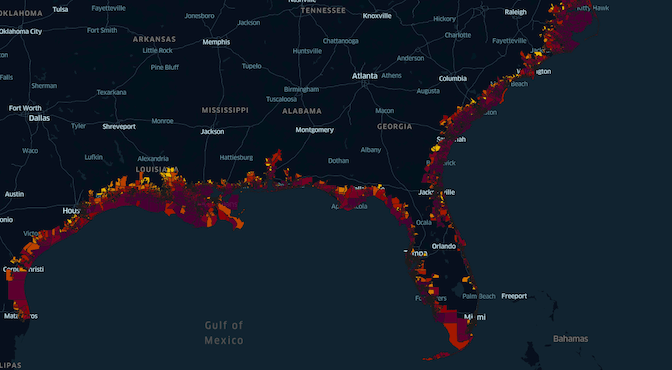
Coastal Flood Risk

The UrbanFootprint Coastal Flood Risk model estimates flood depth at the parcel geography for CONUS.

See Methodology ↗
Earthquake Risk

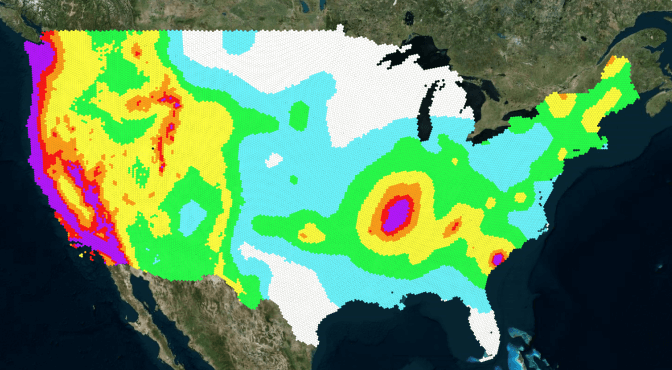
Earthquake Risk

The UrbanFootprint Earthquake Risk model produces a single seismic hazard map for CONUS that accounts for variability in Vs30 on an H3 zoom level 9 grid.

See Methodology ↗
Wildfire Risk

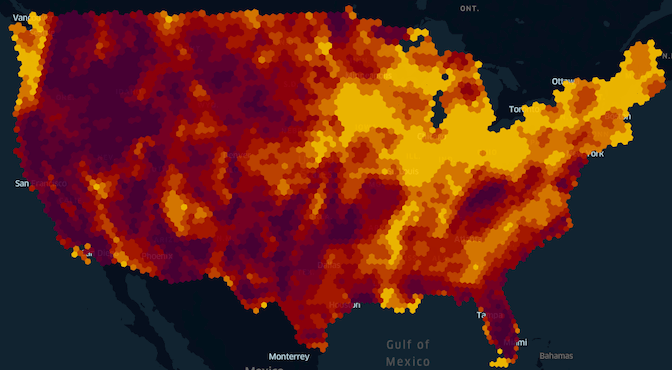
Wildfire Risk and Loss

The UrbanFootprint Wildfire Risk and Loss metrics provide parcel level exposure and structural loss across the US.

See Methodology ↗
Coastal Flood Loss

Coastal Flood Loss

The UrbanFootprint Coastal Flood Loss models provide conditional and annualized loss estimates at the structure level for areas exposed to hurricane-induced storm surge.

See Methodology ↗
Earthquake Loss

Earthquake Loss

The UrbanFootprint Earthquake Loss models provide conditional and annualized loss estimates at the structure level across the US.

See Methodology ↗
Tweet
Share
Share

Never wonder where

UrbanFootprint logo
Contact Us

    • SOLUTIONS
    • Climate Risk & Sustainability
    • Infrastructure & Mobility
    • Public Service & Administration
    • Capital Markets & ESG
    • FOUNDATIONS
    • Built Environment
    • People & Vulnerabilities
    • Climate & Hazards
    • EXPERIENCES
    • Analyst
    • Explorer
    • Direct Data Delivery
    • RESOURCES
    • Case Studies
    • ESG
    • Community Resilience
    • Climate Resilience
    • Technical Support
    • ABOUT
    • Careers
    • Leadership
    • In the News
    • Contact Us

©2025 All rights reserved.

  • Terms & Conditions
  • Privacy Policy