


With the California Eviction Moratorium set to end on September 30th, many Californians will undoubtedly have their lives impacted, as almost half of the state’s population rent their homes. At UrbanFootprint, we have been keeping a close eye on eviction risk across the country as we work to help state agencies and their partners better understand and respond to the ongoing housing crisis.
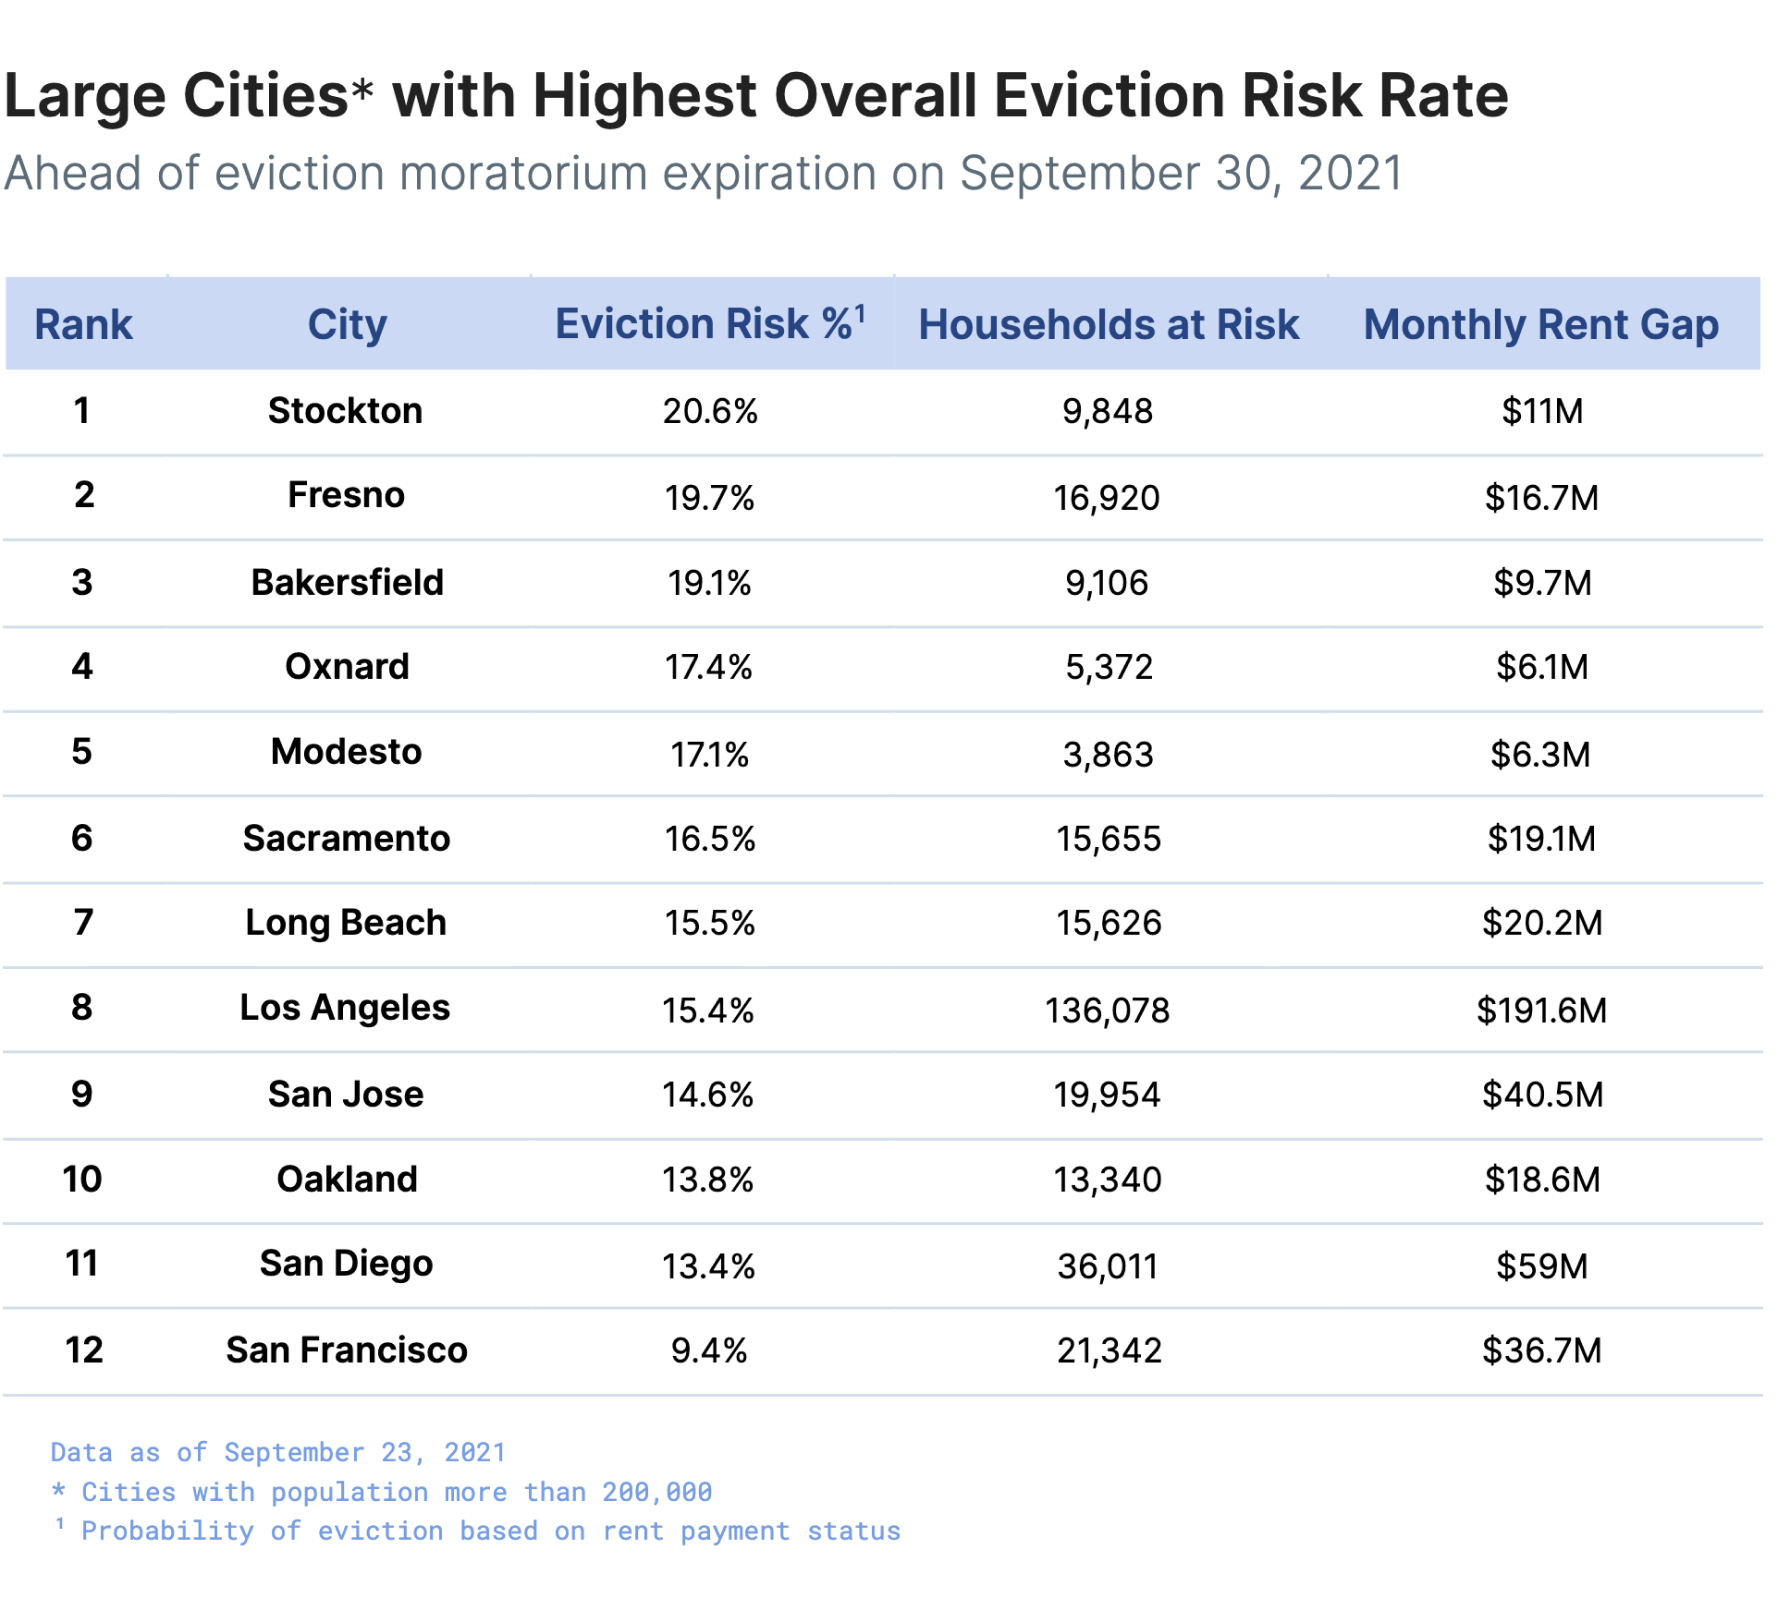
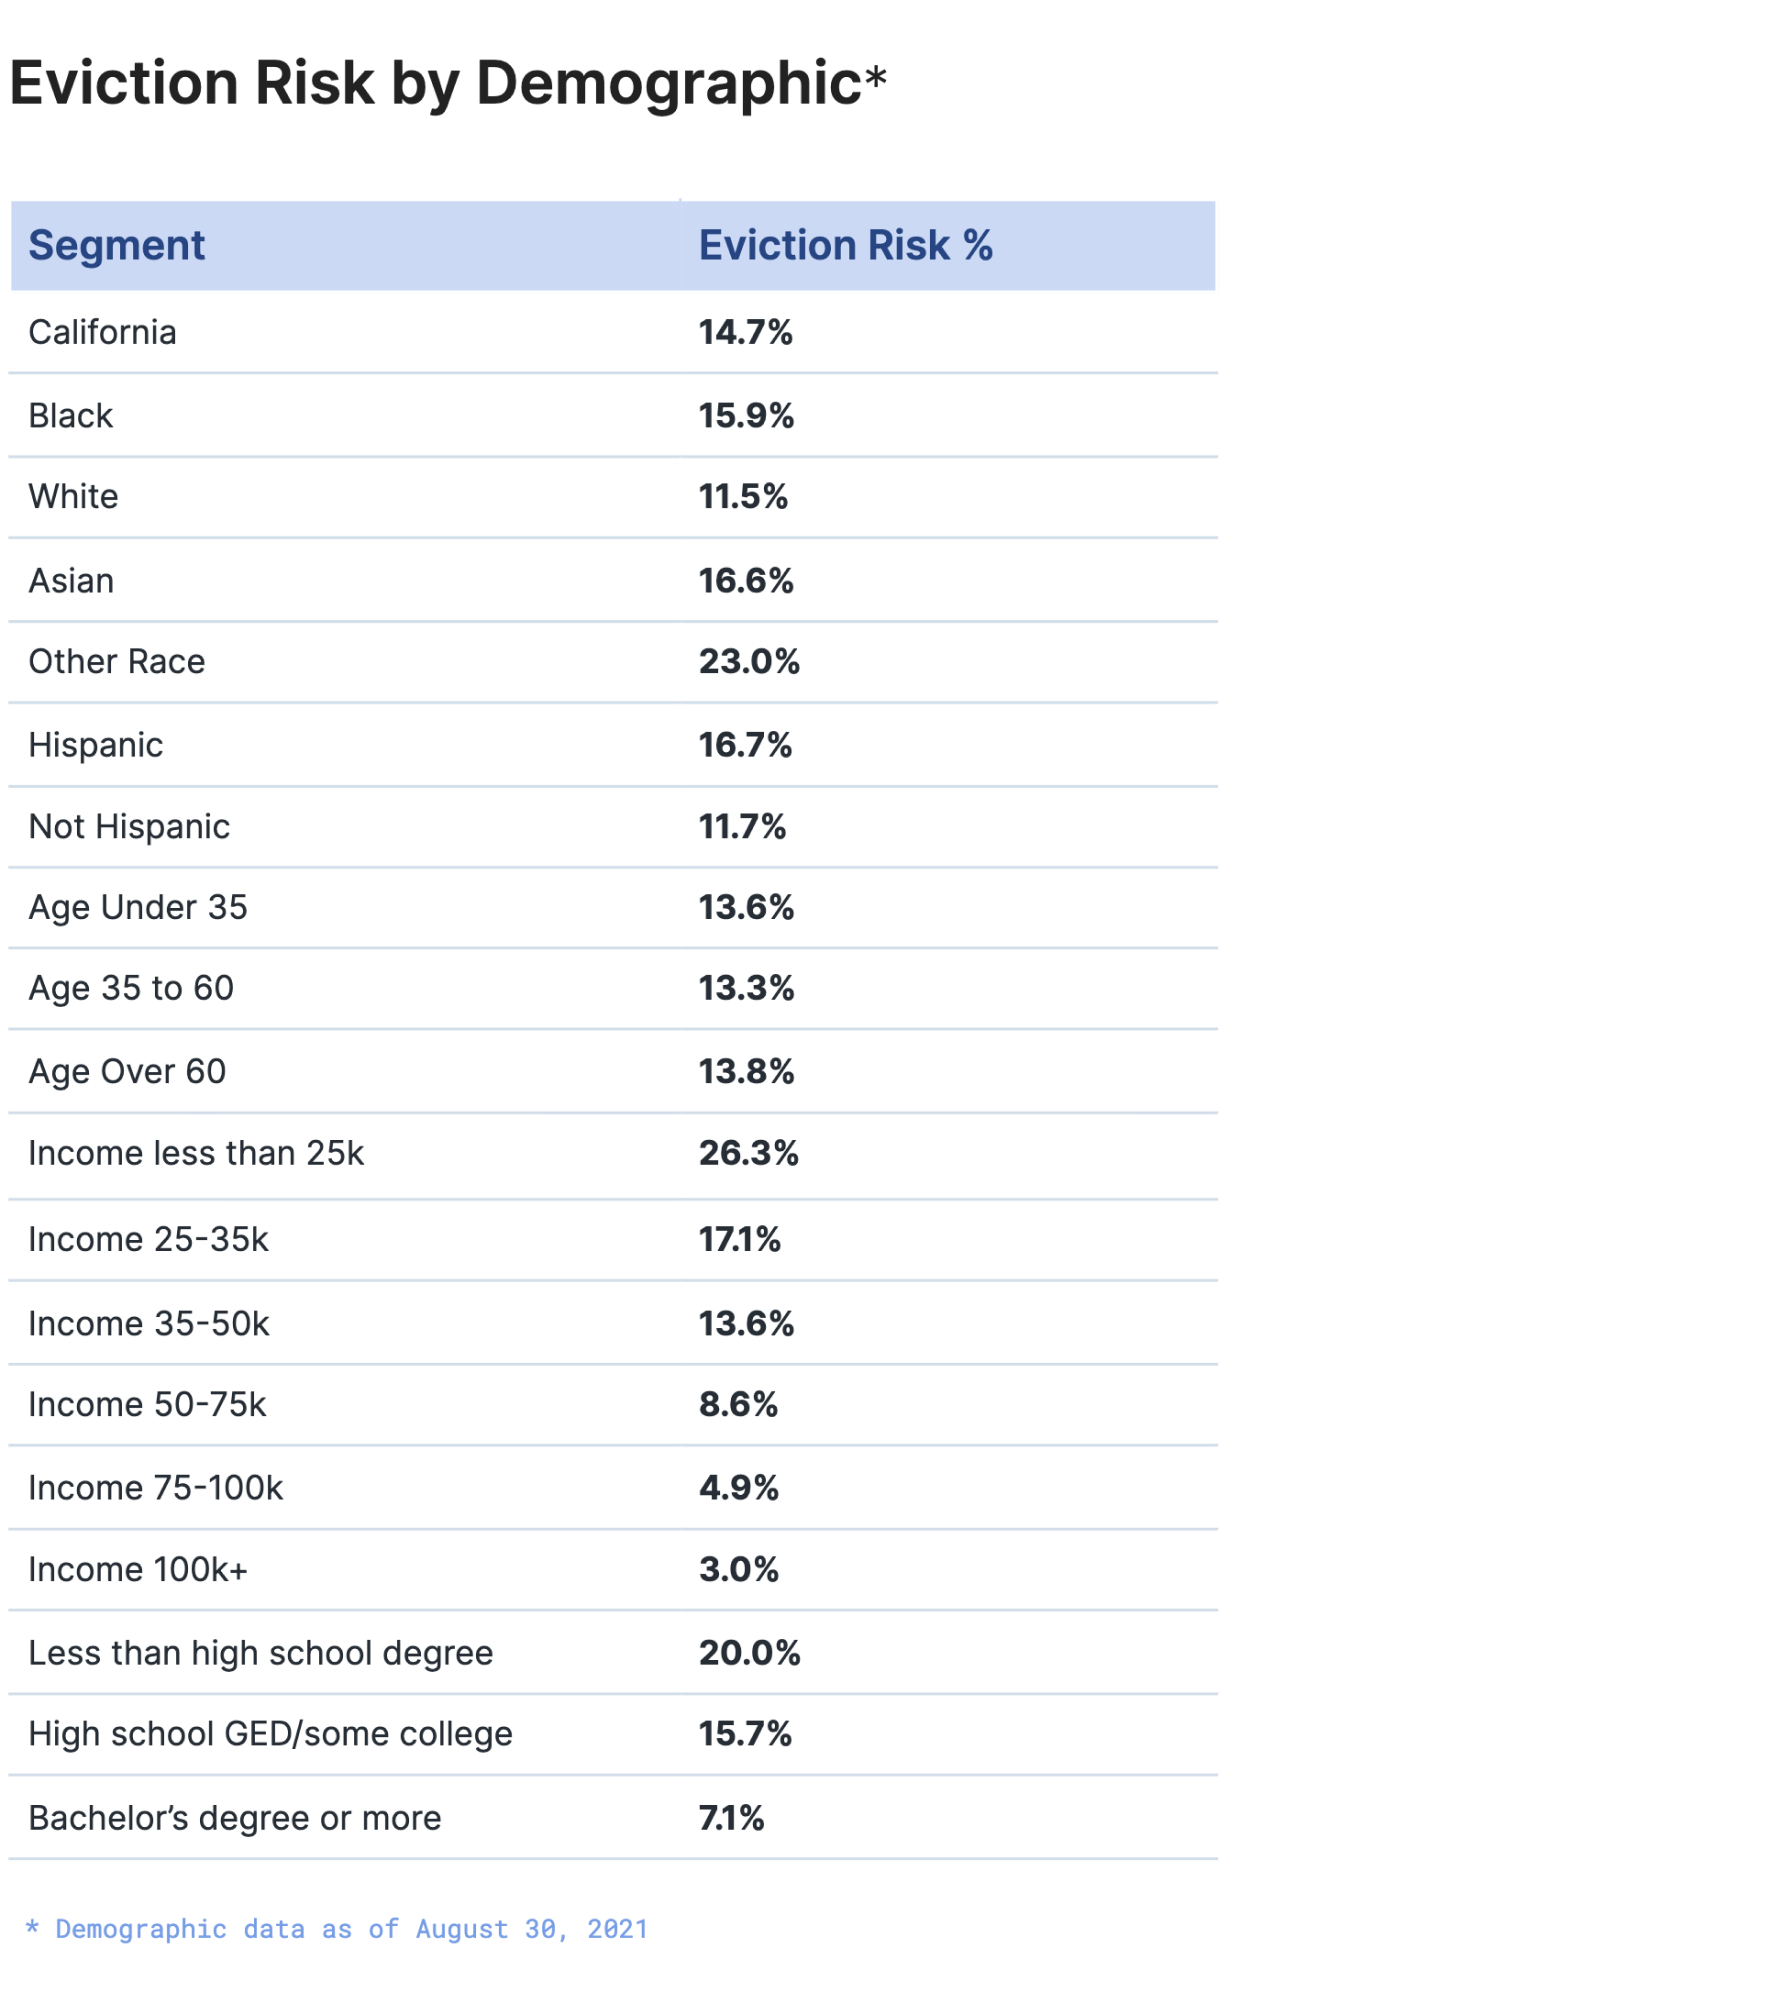
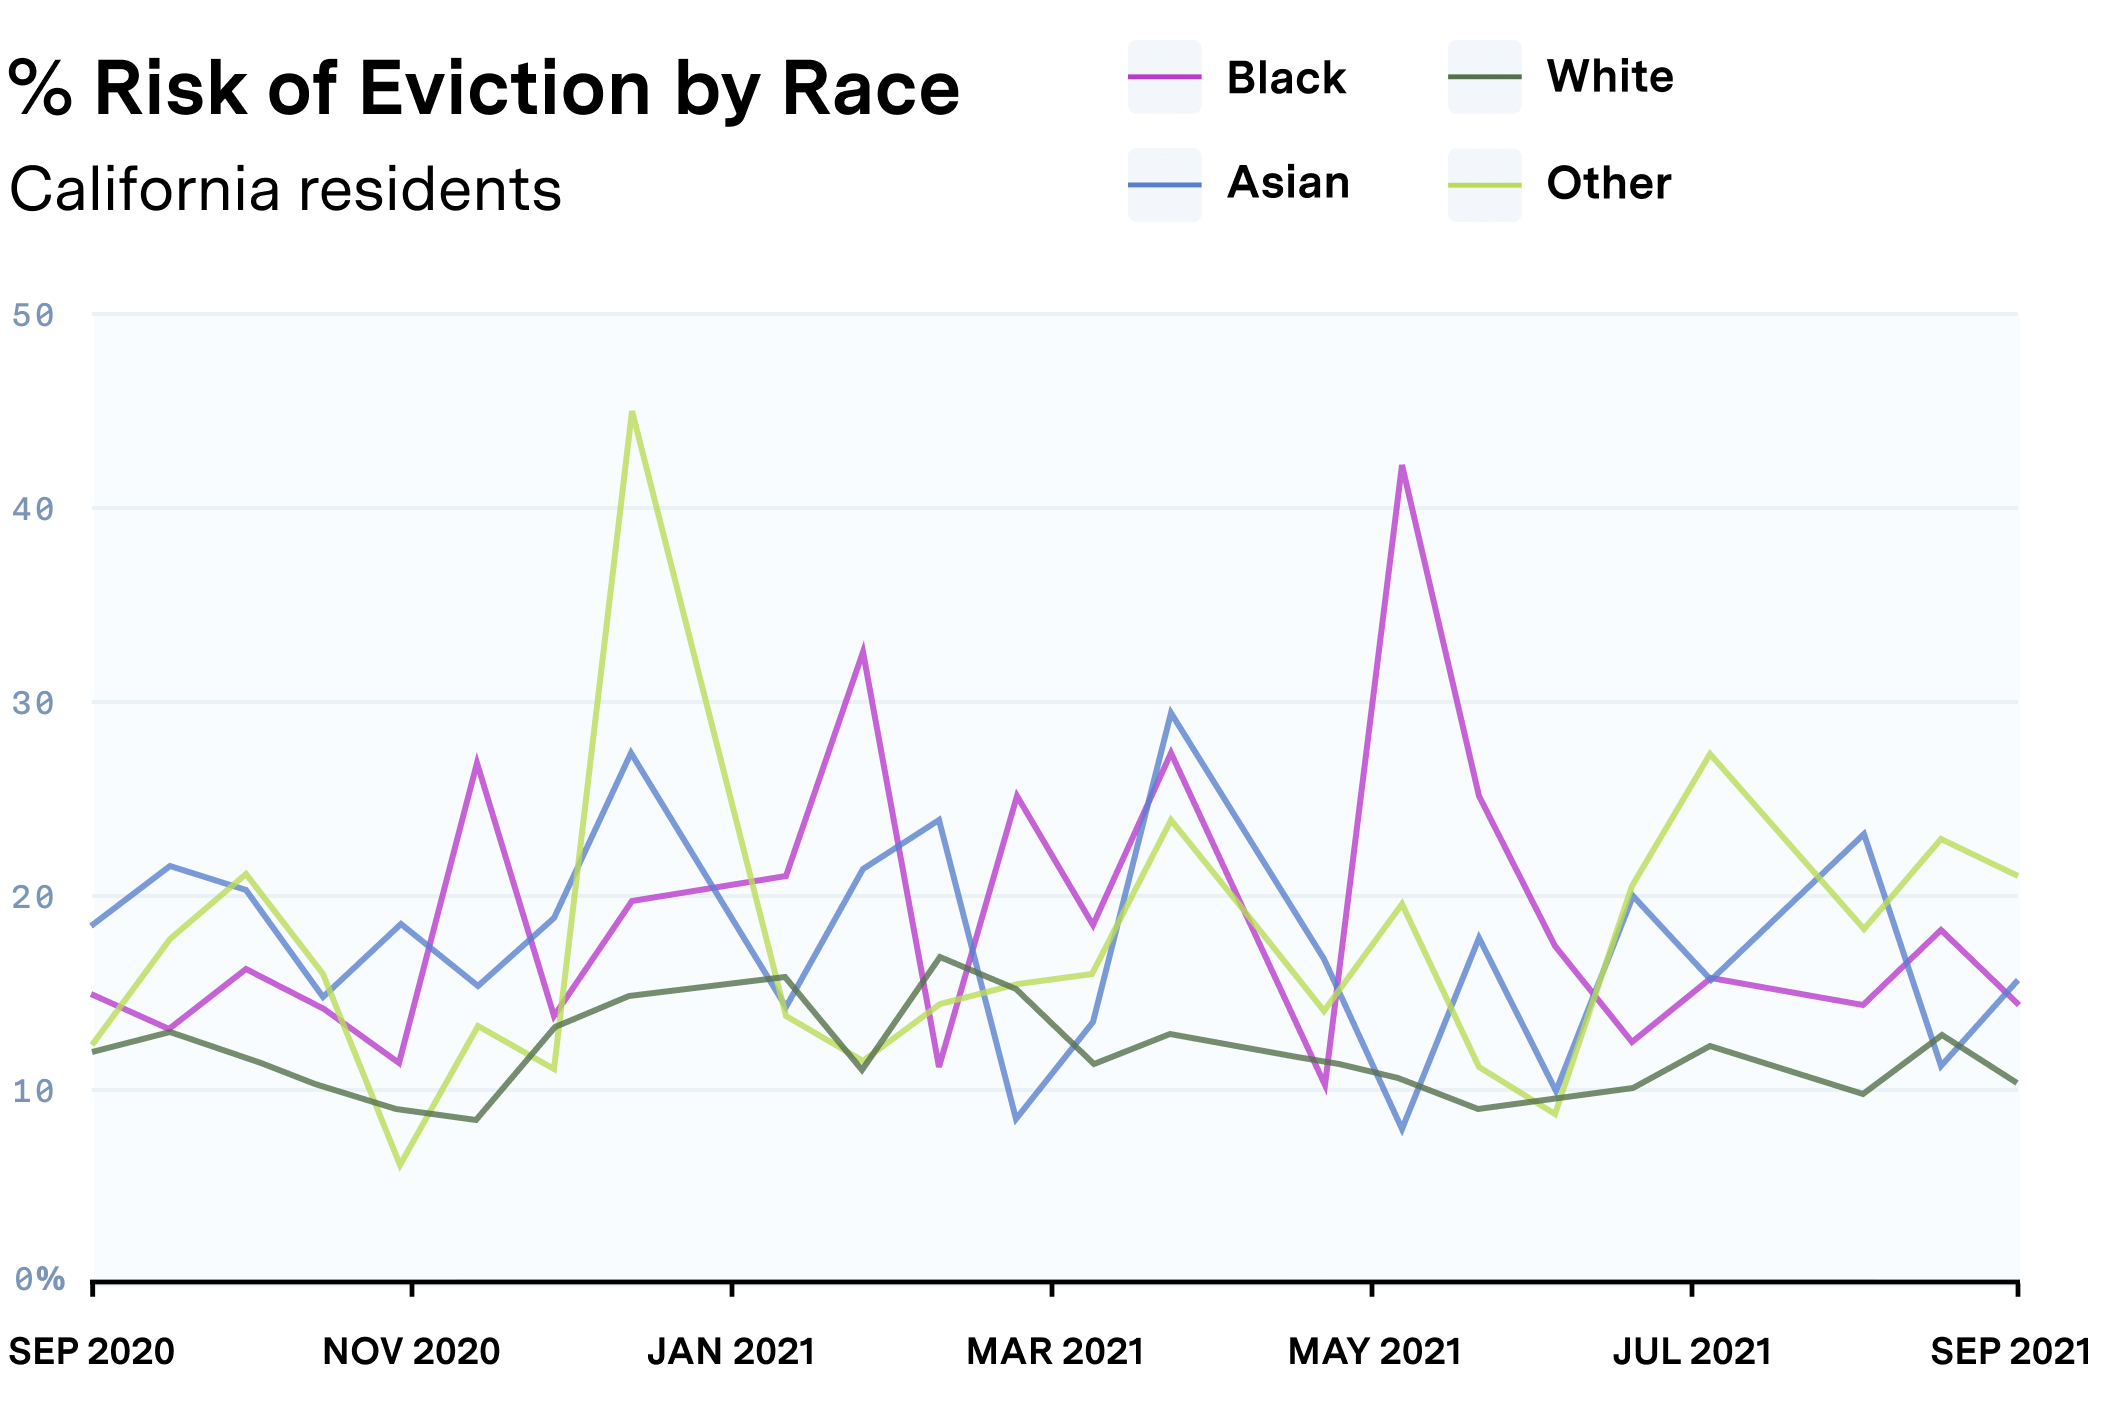
Our research has yielded some interesting findings about the current state of eviction risk in California. The end of the eviction moratorium will affect some cities much more than others. We estimate that almost 21% of Stockton’s renters are at risk of eviction, the highest number in California and 50% greater than the national average. The moratorium’s expiration will have a disproportionate impact across racial lines as well. For example, Asians are 44% more likely to face eviction than White Californians.
In order to evaluate any path forward, it is important to understand the scale of eviction risk within the state and the potential impacts of the moratorium’s expiration. We are helping state agencies better understand eviction risk, visualize the areas most in need, and improve and measure the effectiveness of rental assistance outreach.
So what have we found in our work in California? Let’s take a look.
Current Eviction Risk Statewide
We evaluate eviction risk by building a statistical model to approximate the characteristics of a household at risk of eviction. We utilize the Census Household Pulse Survey, which provides a bi-weekly snapshot of household experiences, including data on the difficulty of affording rent.
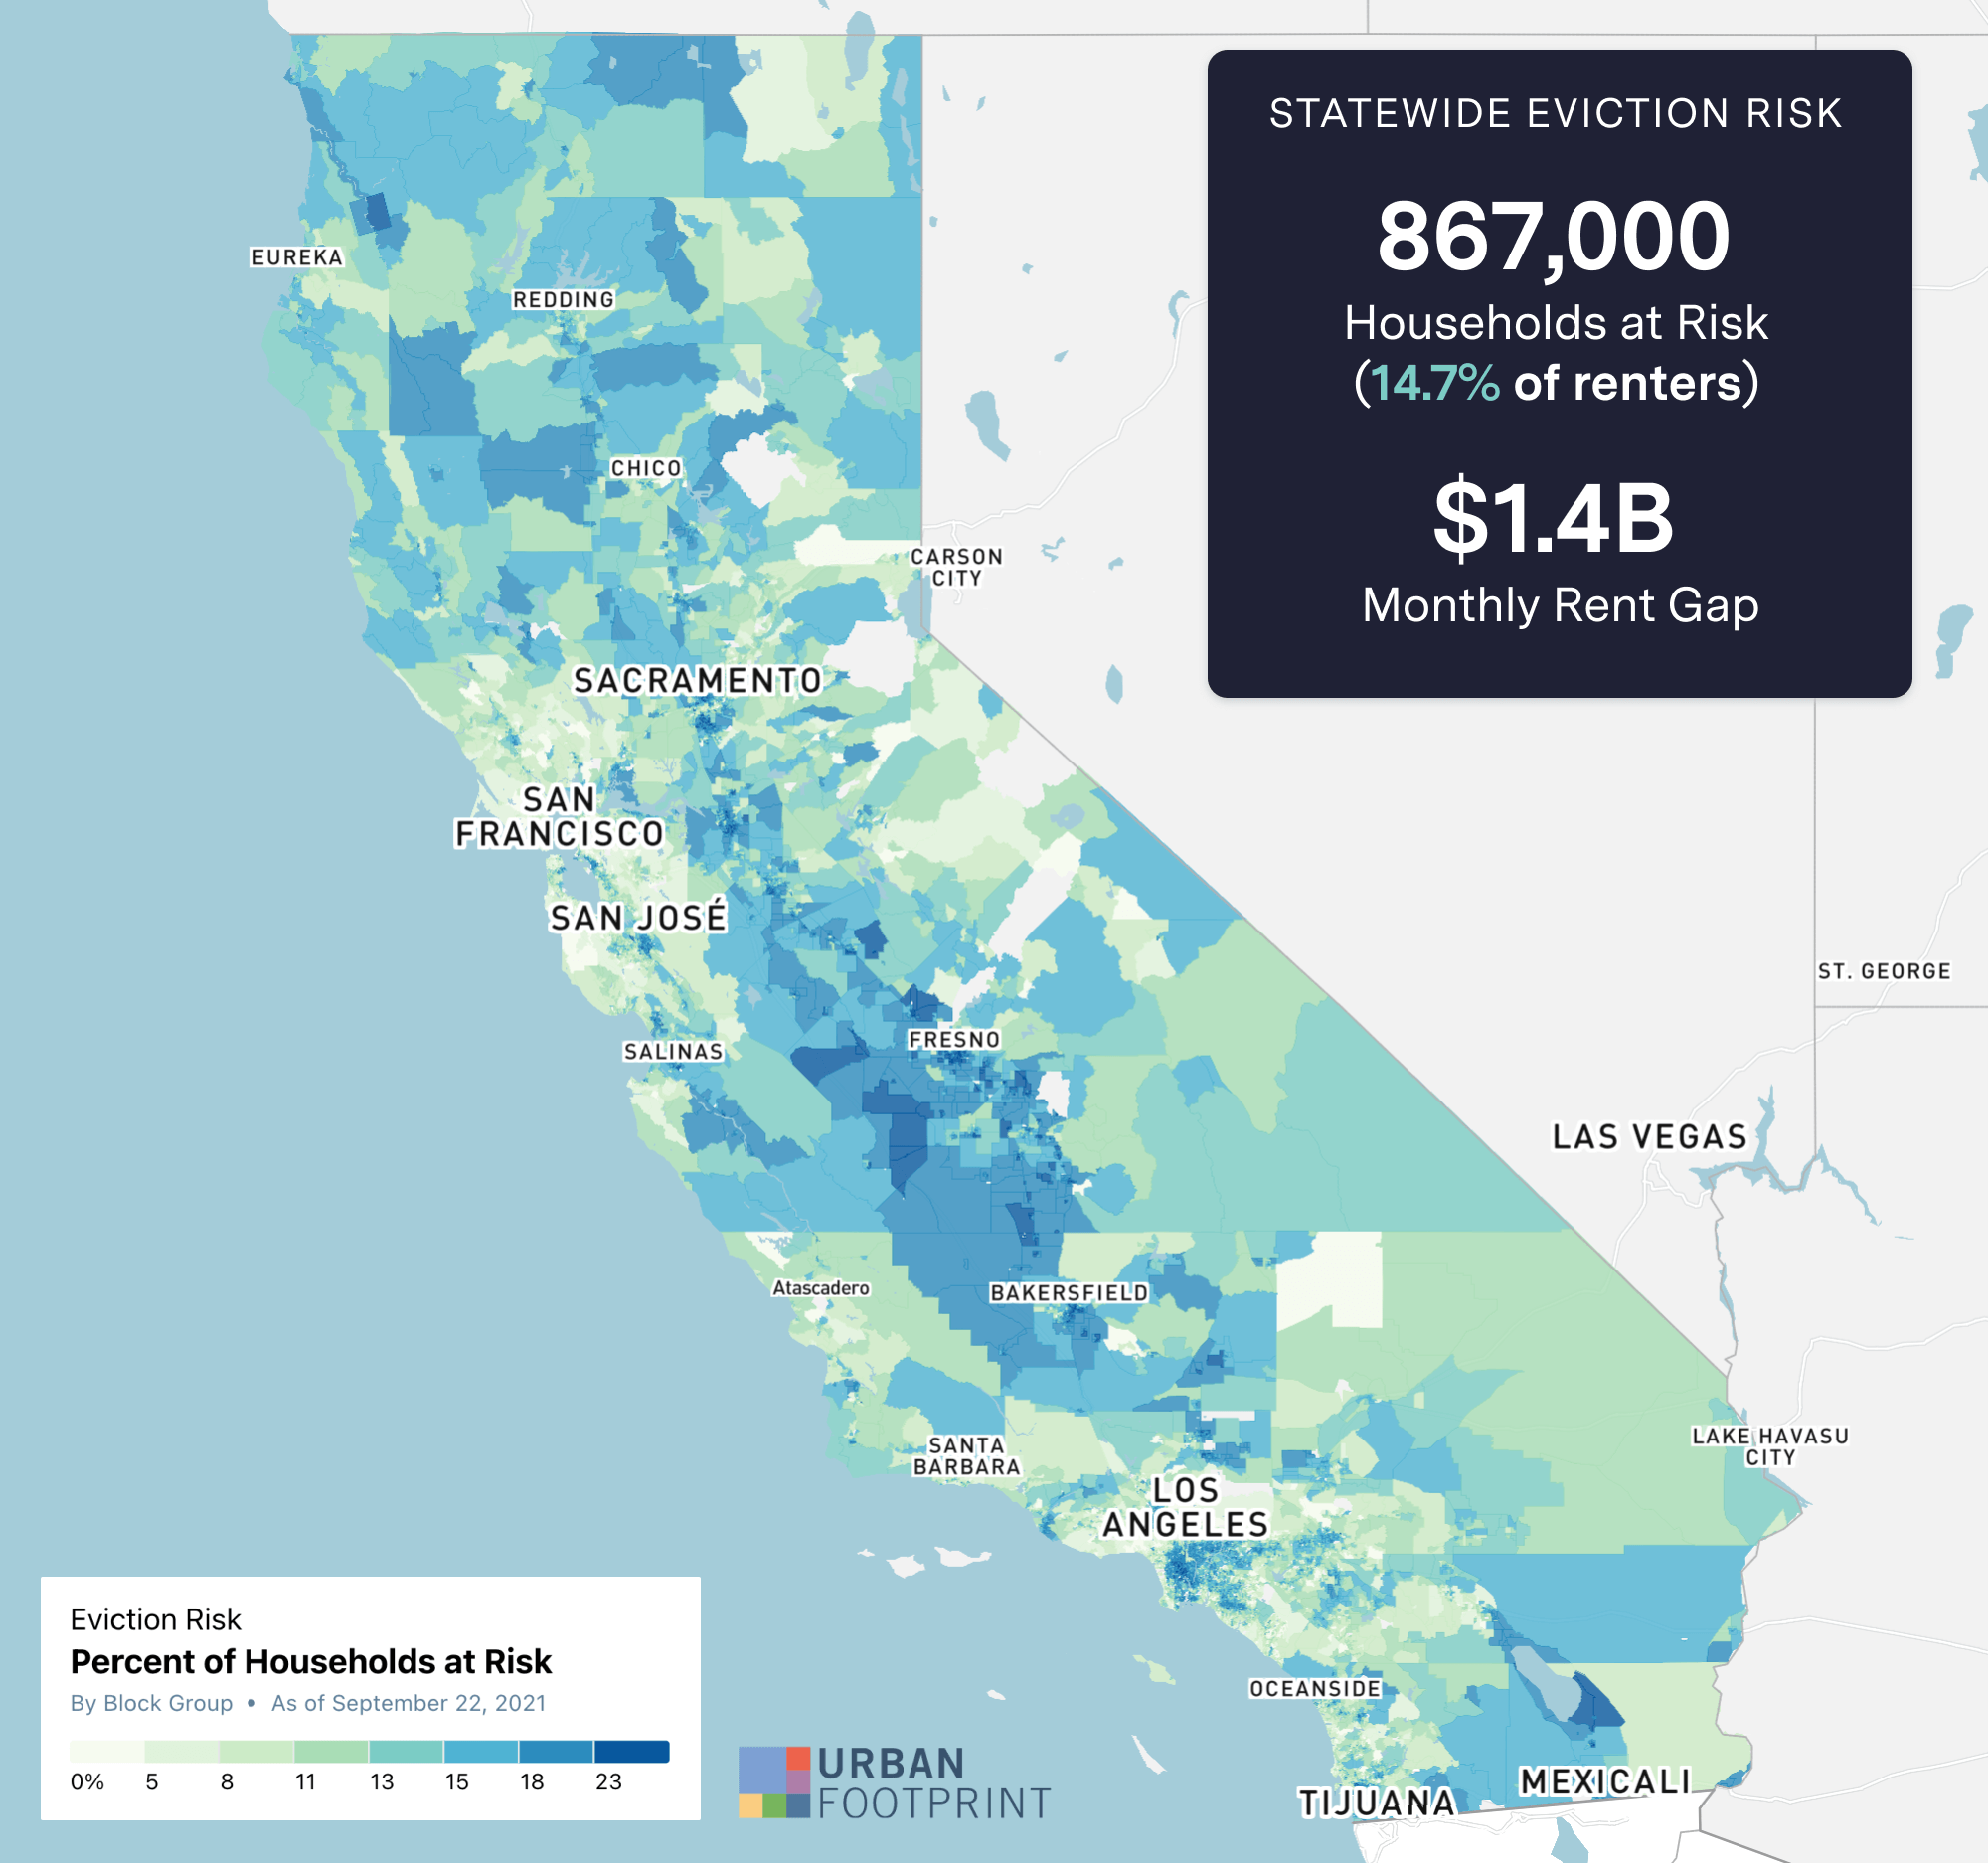
Across California, we estimate that 867,000 households are currently at risk of eviction once the moratorium ends. This represents 14.7% of renter households and around 6% of all households in the state.
For comparison, 13.7% of households were at risk of eviction nationally at the beginning of September, down from 15% mid-August.
Statewide, there is currently a total monthly rent gap of approximately $1.4 billion. That means on average, at-risk households fall behind by an additional $1,615 in rent each month.
The Pulse Survey breaks down responses by demographics (e.g. age, gender, race, ethnicity) and household characteristics (e.g. size, income, education level, marital status) and publishes results for each state.
We are able to combine these responses with additional datasets to create an eviction risk index. Factors that affect index are income, race, gender, education level, household size, and employment status.
In California, we can see the breakdown for certain demographic characteristics as follows:
This data is interesting, but it isn’t exactly actionable. In order for the State to effectively protect the well-being of its citizens, it needs to know where people need help the most.
That is where UrbanFootprint excels. We are not only able to bring these previously siloed datasets together, but we can also map them. This gives state agencies and their partners a clear picture of the most current conditions around eviction risk, allowing them to pinpoint and predict the households most in need – down to the block group level.
Eviction Risk Insights at Work in California
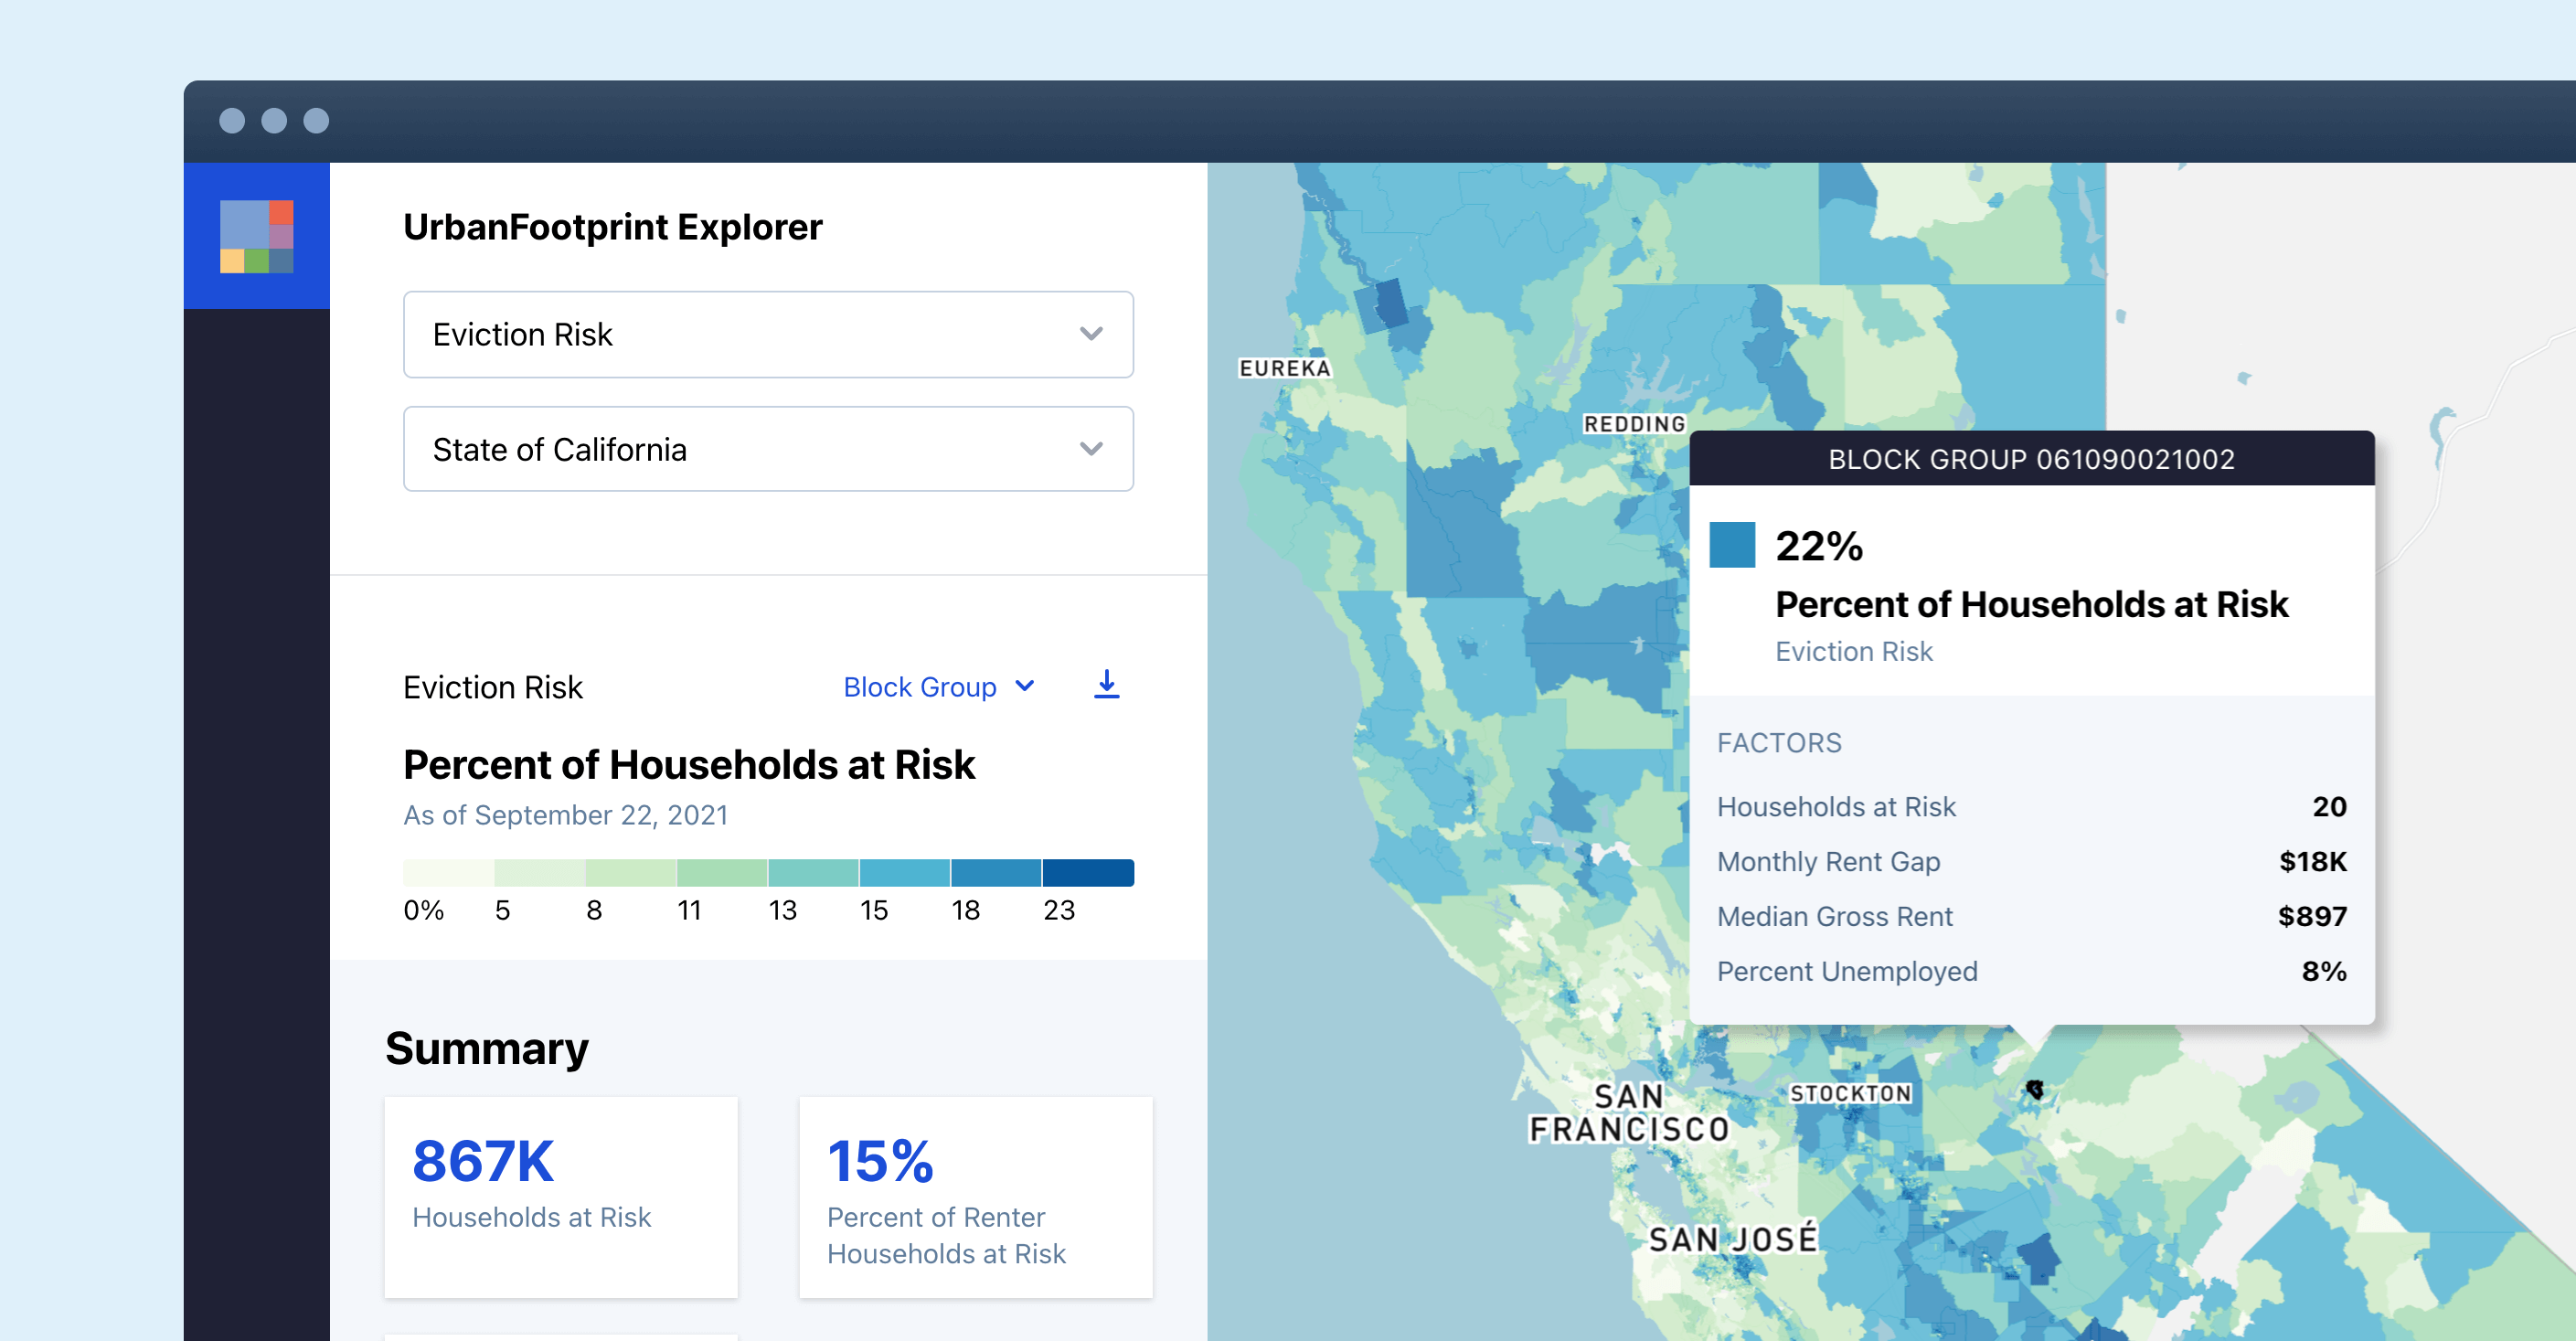
The state of California recognized the need to be able to target relief outreach very strategically to ensure rent relief dollars are reaching the state’s most vulnerable households. UrbanFootprint’s Eviction Risk Insights (ERI) is being used to provide maps and analysis to support program implementers with critical information – from a high-level summary down to the block group level.
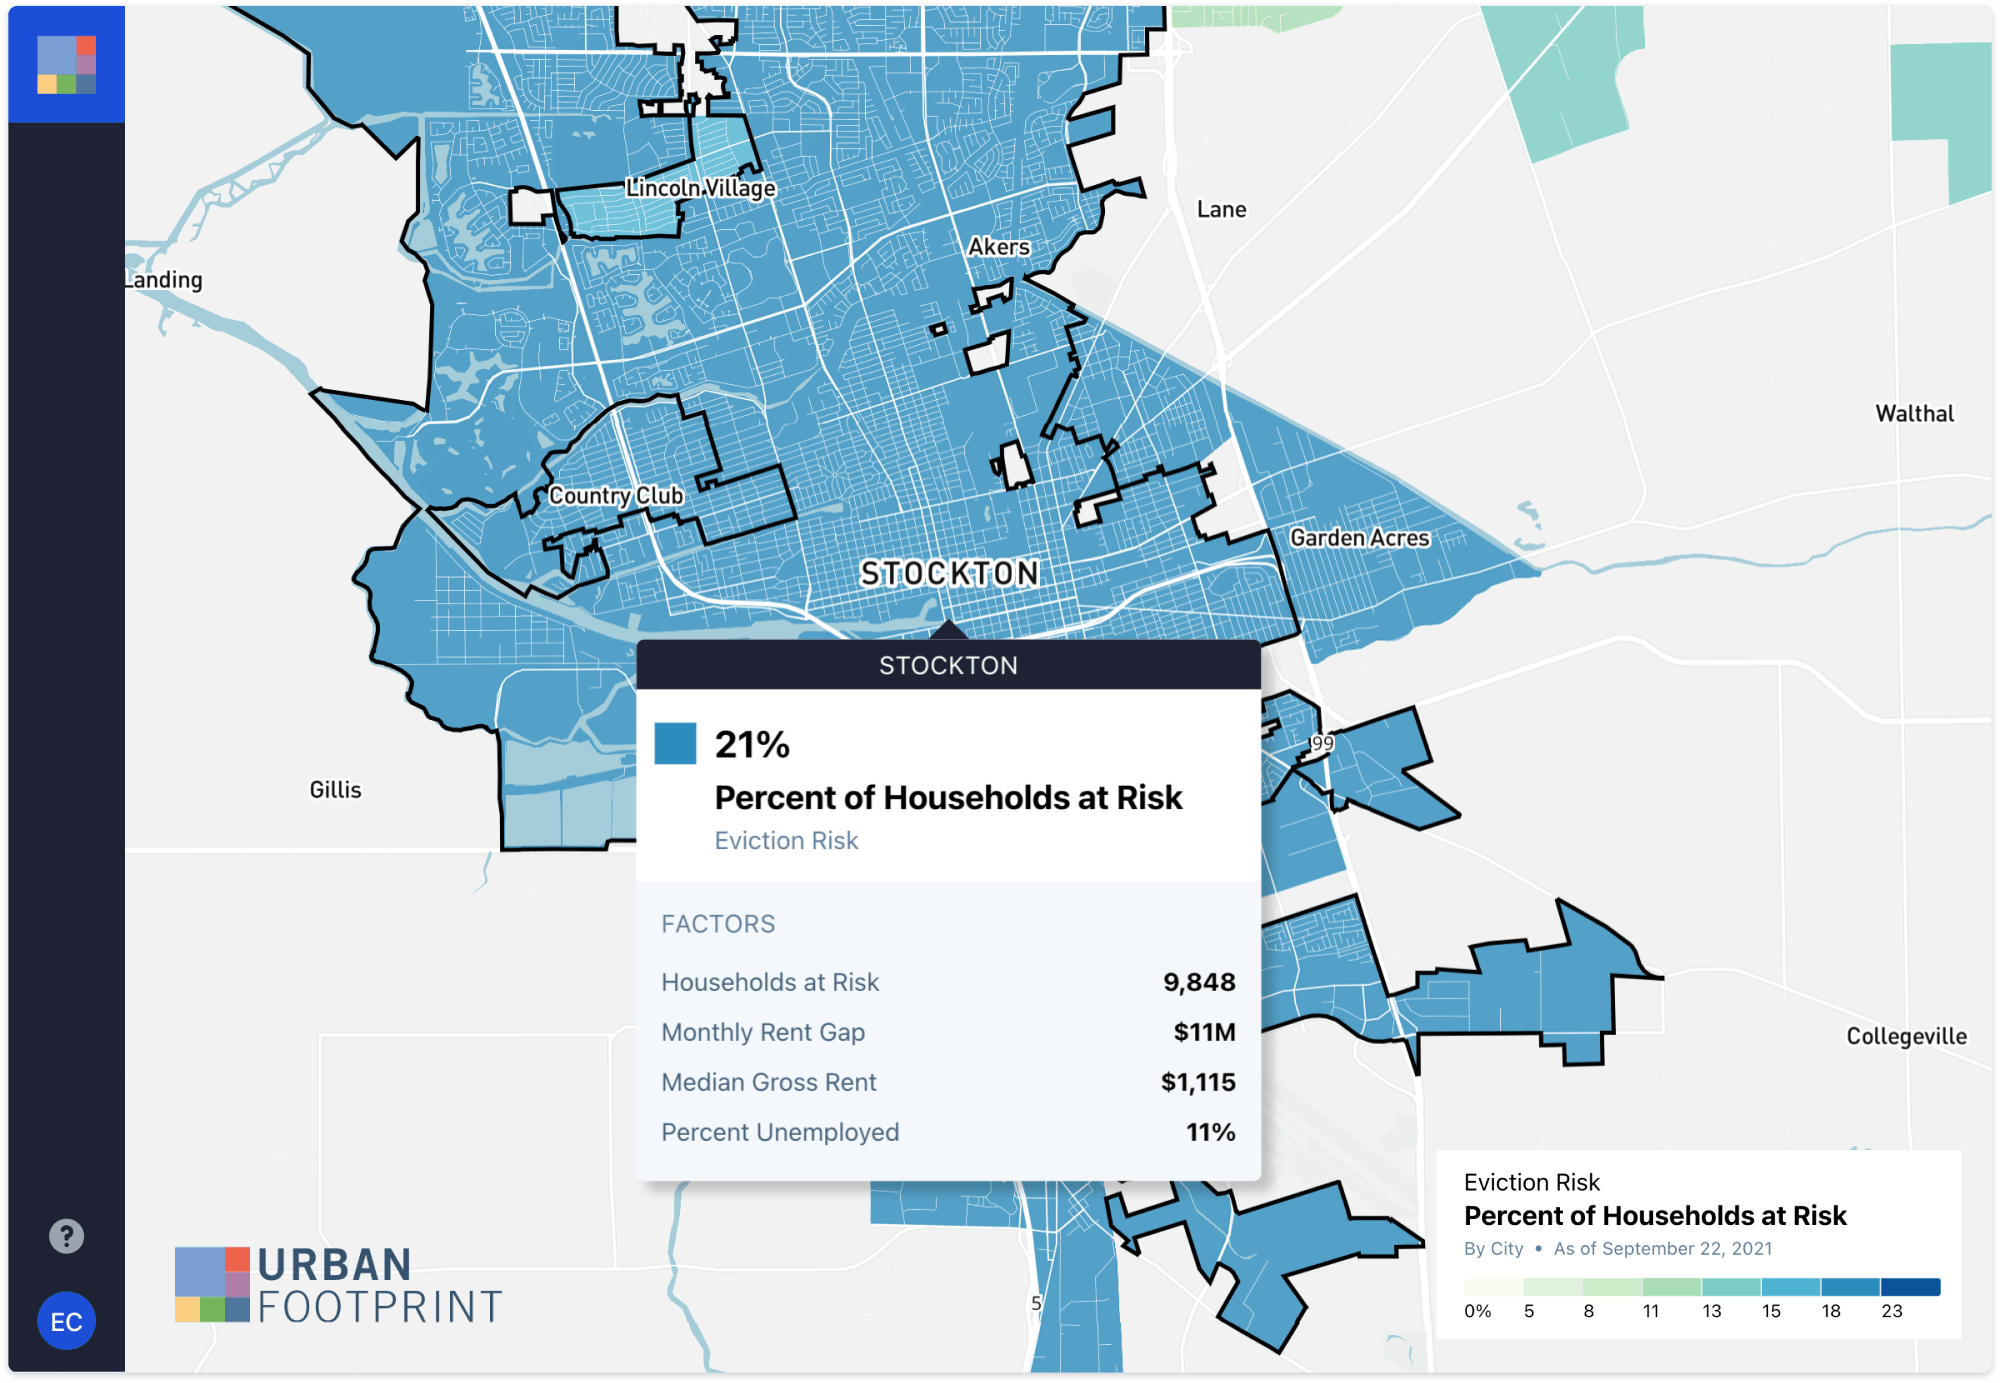
For example, Stockton has the highest eviction rate among cities with populations over 200,000. Almost 10,000 households are at risk of eviction and the monthly rent gap is approximately $11 million. While this level of insight is valuable, especially when the information is up-to-date, it doesn’t provide outreach providers with the needed granularity to hyper-target their efforts.
ERI is also able to provide insight at the block group level. Allowing far more in-depth analysis of relief needs, and more targeted, efficient, and effective outreach efforts.
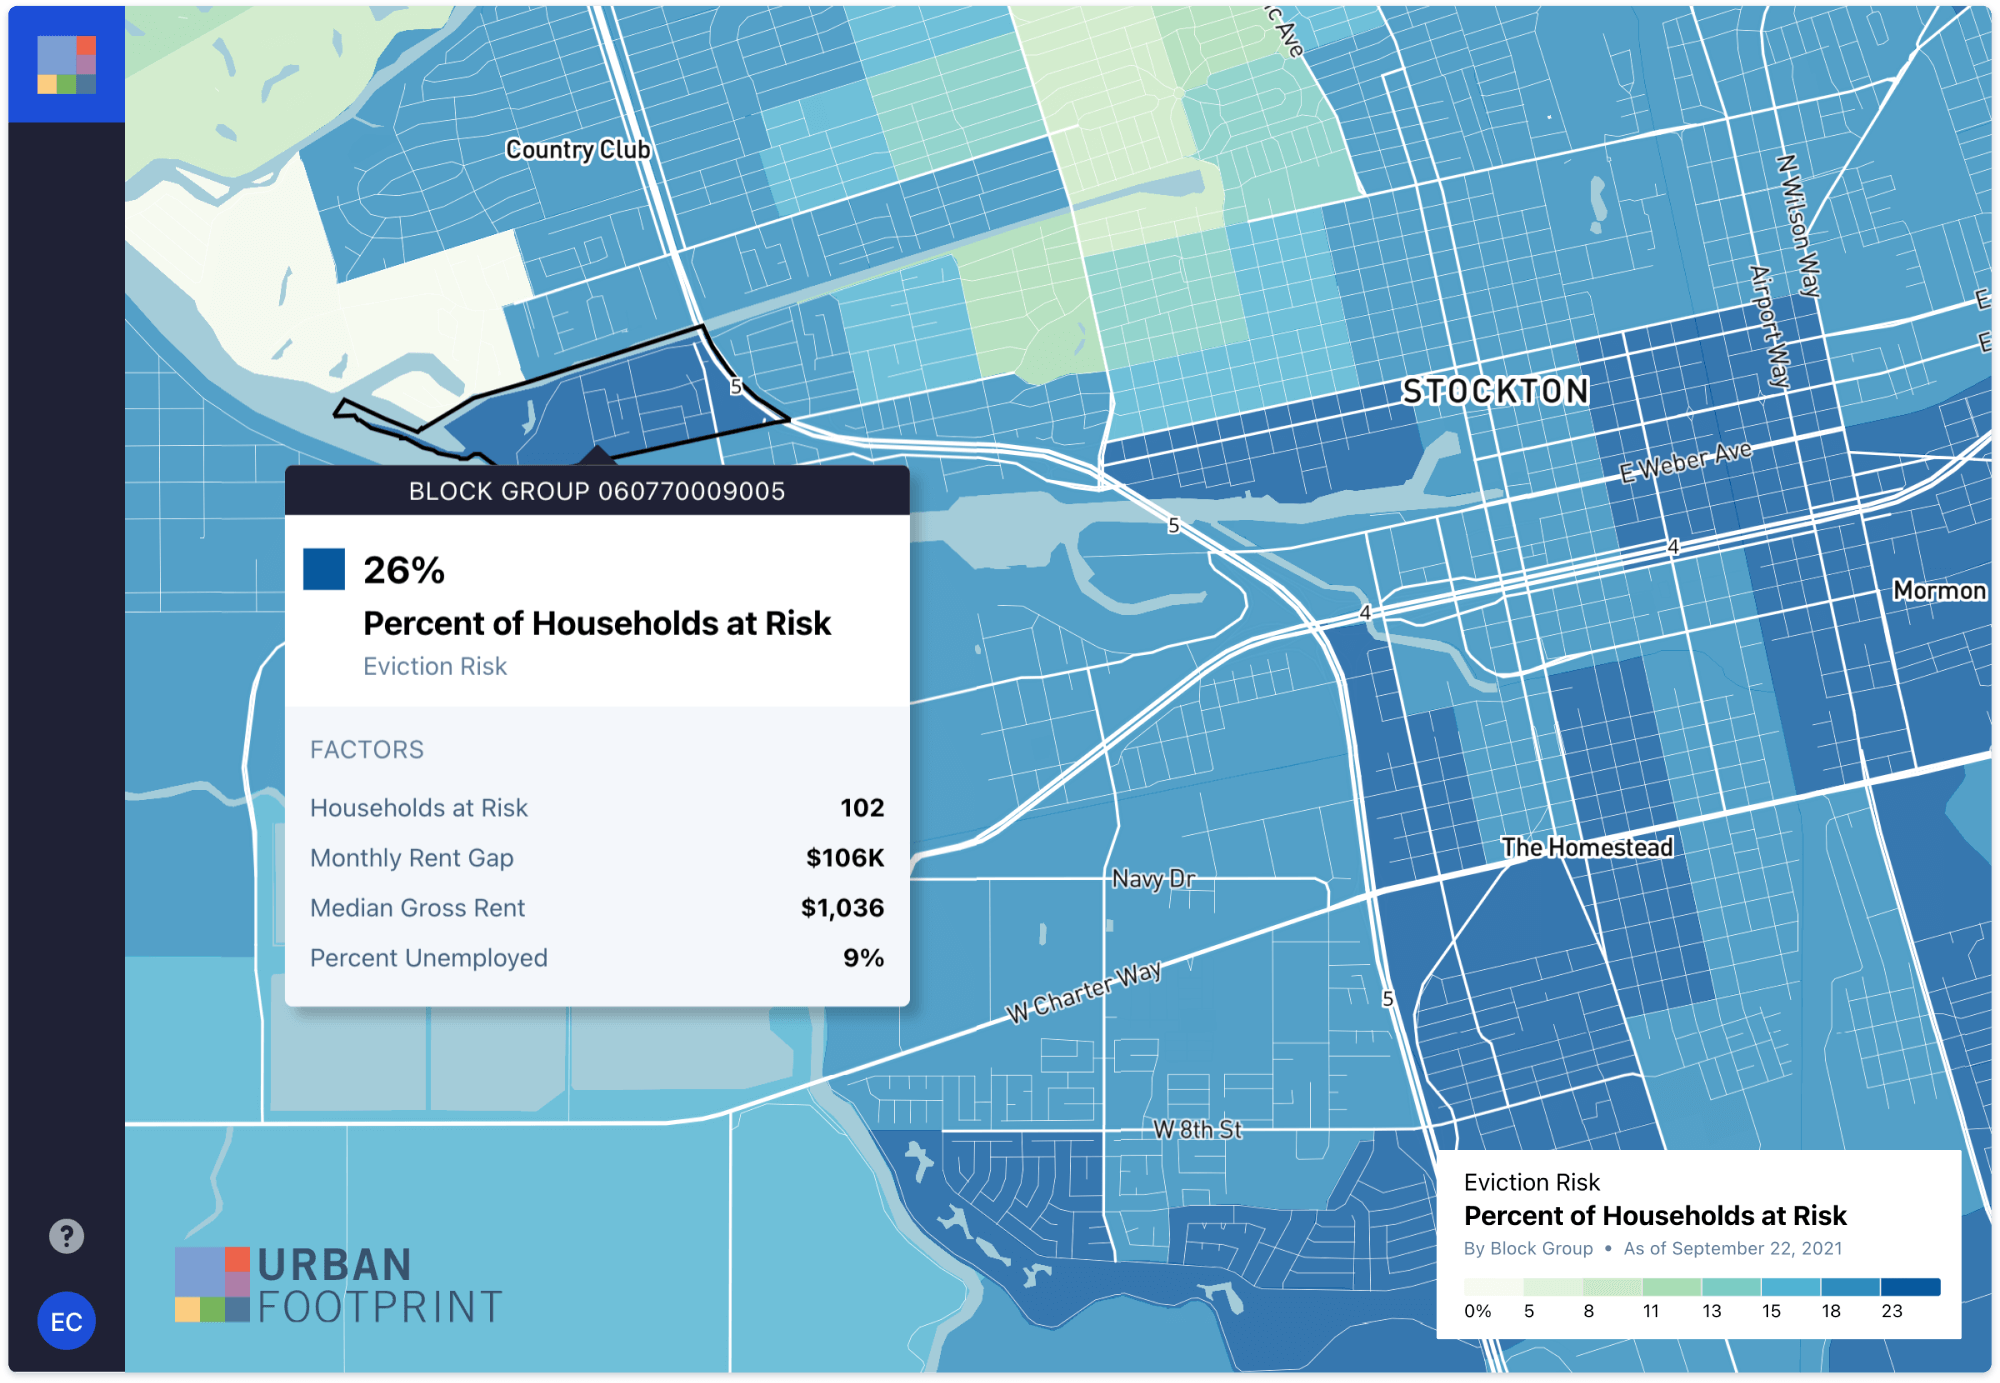
It is important to understand in which areas of a city aid is most needed. For example, residents in the block group in the graphic above are about 20% more likely to be at risk of eviction than the average resident in Stockton.
The value of these insights can also be illustrated by looking at Los Angeles, the city with the largest at-risk population – with more than 130,000 households facing eviction.
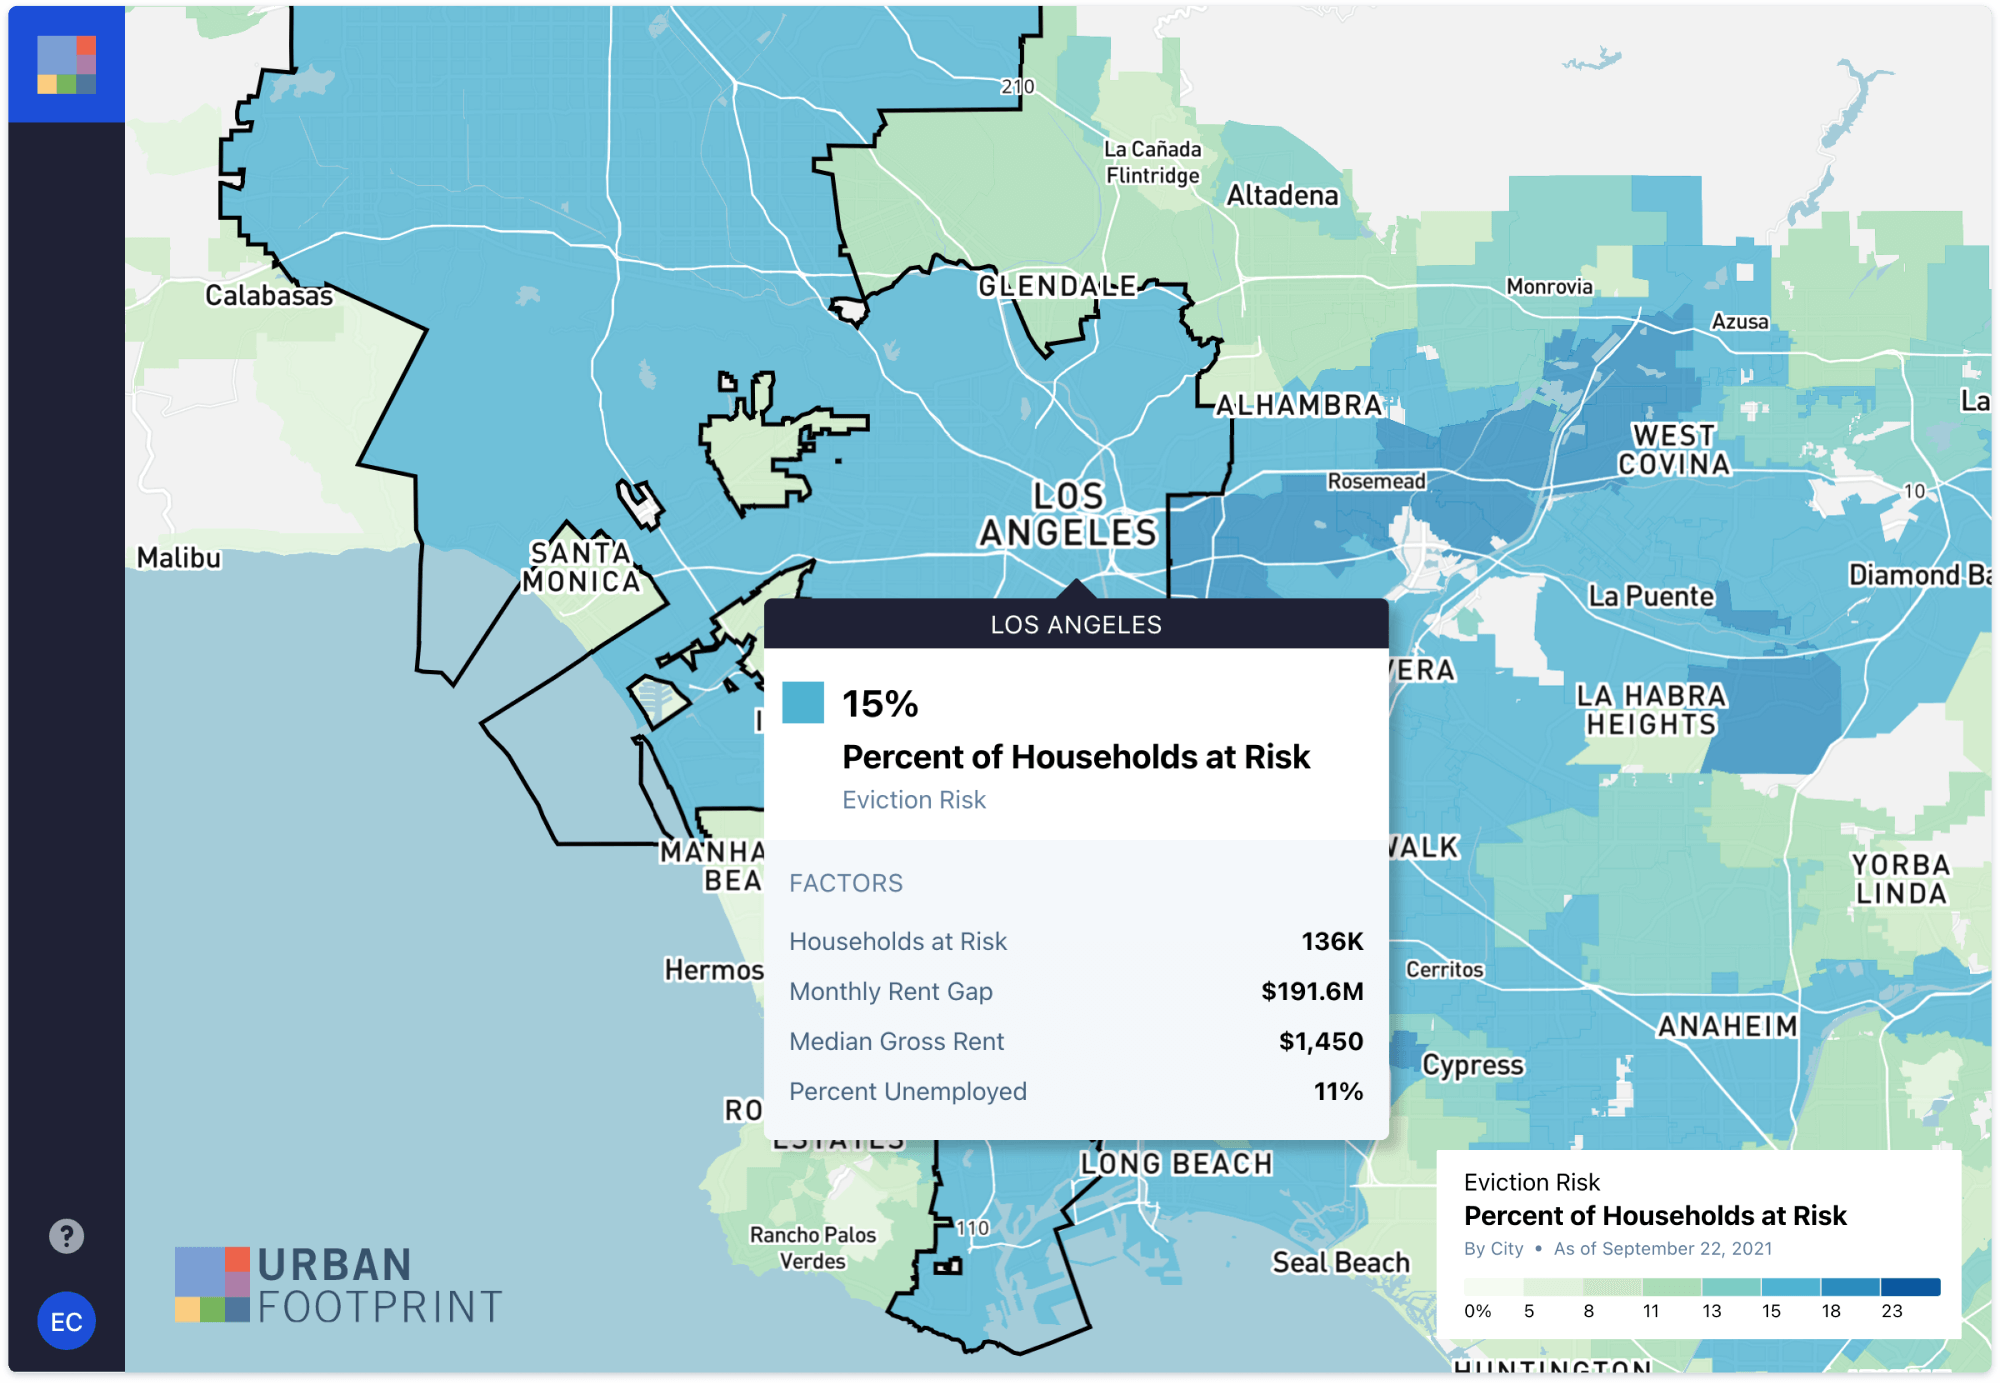
But obviously, all parts of Los Angeles are not at equal risk of eviction. With a more granular view, the state and its partners are able to identify the pockets within cities where need is highest. And it is not always in line with the expectations of outreach providers – especially as conditions are changing quickly due to the ongoing pandemic.
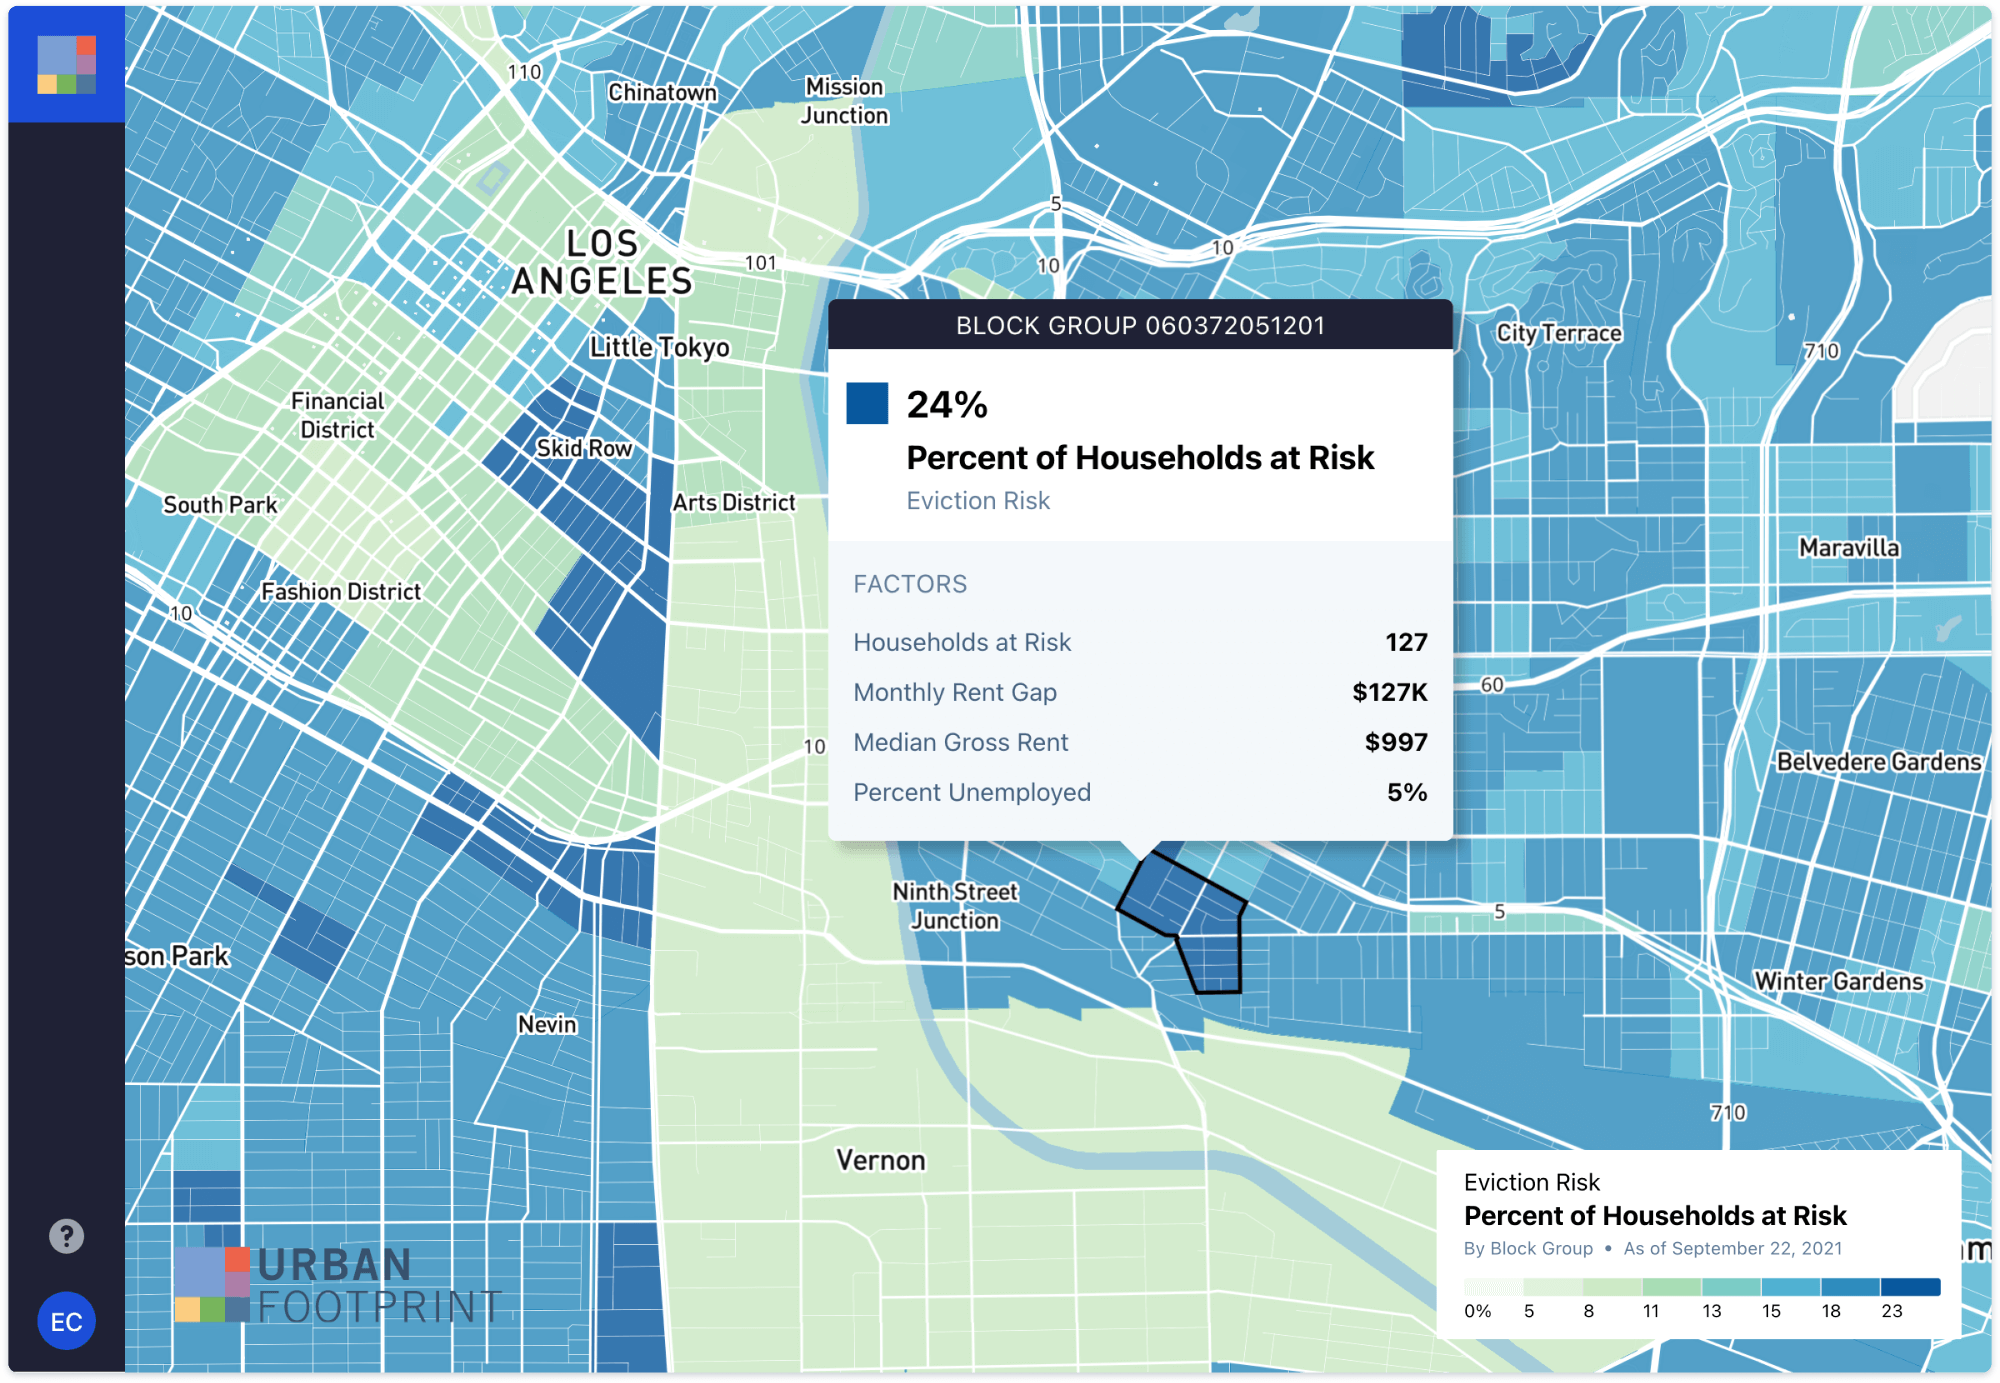
The granularity of data gives agencies insight into specific neighborhoods, helping them visualize changes in eviction risk over time. This enables them to respond more quickly and effectively.
ERI can also be used to estimate the application gap for jurisdictions participating in the CA Emergency Rental Assistance Program (the difference between households in need of assistance and those that have applied for it), and then visualize this gap with interactive maps.
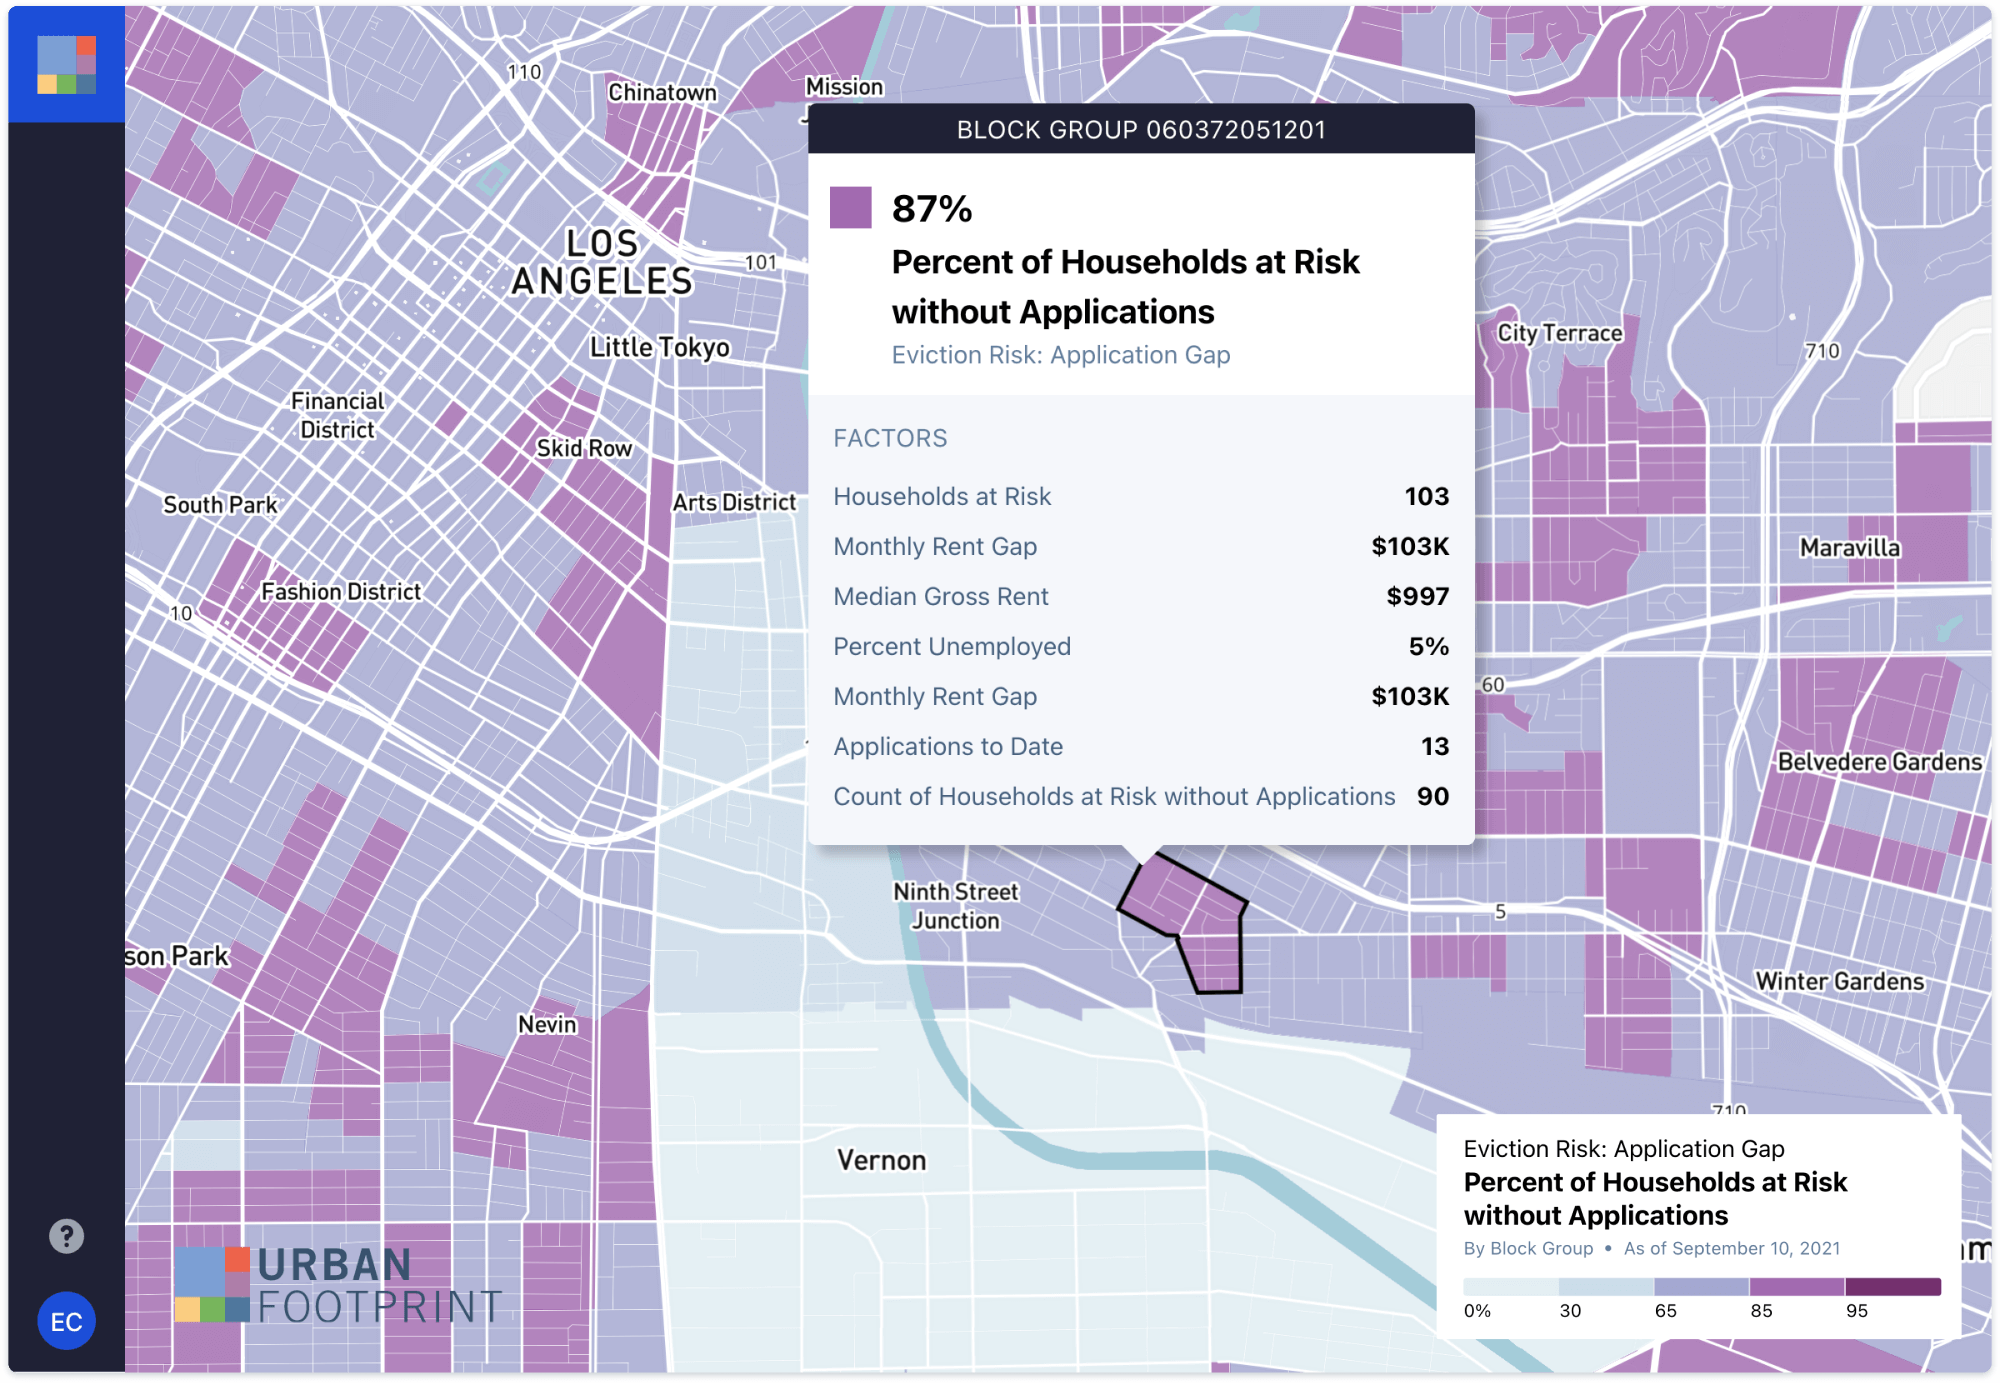
This granular, block-group level ERI data is helping the state and their partners direct outreach and marketing towards neighborhoods with high numbers of households at risk. Being able to hyper-target ads and other marketing efforts by location helps improve the efficiency of outreach efforts.
Our data can then show trends over time in incoming applications, and the application gap relative to estimated risk. This helps agencies better measure the effectiveness of different outreach methods by comparing the application gap with tactics that have been used in certain areas. It was previously very difficult to quantify the effectiveness of outreach. This level of insight helps agencies make data-driven decisions and inform future strategies to get aid in the hands of those that need it most, something that will be desperately needed once the eviction moratorium ends on September 30.
Currently, trends are showing progress being made by individual counties, highlighting those doing well in increasing application volumes and narrowing the gap. Contra Costa (Bay Area) and Ventura (Southern CA) have been noted for their success in increasing applications. Our granular view has called attention to eviction risk in places where locals might not have expected.

In Summary
As eviction moratoriums expire in California and across the country, the impacts will be far reaching. Rental assistance funding is available, but it doesn’t do much good unless it reaches the hands of those who need it. Relief distribution has been slow, and something needs to be done in order to avoid disaster.
At UrbanFootprint, we are committed to putting data to work to help any way we can. We believe that arming decision makers with up-to-date insights about eviction risk will improve government response and mitigate the impacts of eviction moratorium expirations on vulnerable populations.
Get in touch to learn more about UrbanFootprint’s Eviction Risk Insights data.
