UrbanFootprint
Login
Request Demo
  • Solutions
        • Resilience Insights

          Power decision making with curated data and models assembled and intersected to surface insight

        • INSIGHT TYPES

        • Infrastructure & MobilityPhysical infrastructure, modernization, and the transition to electric vehicles
        • Public Service & AdministrationCommunity assistance, resource distribution, and program management
        • –

        • Climate Risk & SustainabilityClimate change, exposure to hazards, and impact analysis
        • Capital Markets & ESGInvestment evaluation, portfolio management, and ESG compliance
  • Technology
        • Our Technology

          The UrbanFootprint platform curates components of our Data Foundations to build Resilience Insights and deliver them through one or more Data Experience

        • DATA FOUNDATIONS

        • Built EnvironmentLand use, buildings, transportation, and infrastructure detail
        • People & VulnerabilitiesCommunity and household characteristics with modeled need
        • Climate & HazardsCurrent and future hazard risks plus land and assets impacted
        • DATA EXPERIENCES

        • AnalystCloud-based GIS mapping and analytics application
        • ExplorerCloud-based map visualization and dashboard application
        • Direct DataFlexible data integration and feeds to customer systems
  • Resources
        • RESOURCE TYPE

        • Case Studies
        • Solution Overviews, eBooks, and Whitepapers
        • LEARN MORE

        • Community Resilience
        • Climate Resilience
        • ESG
        • Social Equity
        • TECHNICAL SUPPORT

        • Product Documentation
        • Contact Us
  • Blog
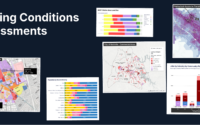
        • Existing Conditions Assessments Key
          Power Your Next Project with the UrbanFootprint Existing Conditions Dashboard
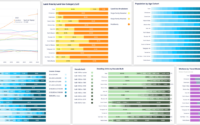
          Existing Conditions Dashboard Charts Key Image
          Launch Faster with UrbanFootprint’s New Existing Conditions Dashboard
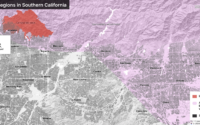
          Eaton Fire Area And Special Wind Regions In Southern California
          Spotlight on Wildfire Risk – How Wind, Weather, and Wildland Development are Fueling Extreme Events
          Sample view of updated transit data in San Francisco
          Fresh Data from UrbanFootprint
          Commercial Property Impacts in Altadena
          Impacts of the LA Fires: Setting the Context for Recovery
          SB6-SanJose@1200w
          Unlock the Powers of Unified Parcel Data with UrbanFootprint
        • View all blog posts
  • About
        • AboutLearn about our story and our mission statement.
        • Learn more

        • LeadershipMeet the faces behind the UrbanFootprint team.
        • Learn more

        • In the NewsNews and writings, press releases, and resources.
        • Learn more

        • CareersWe’re always looking for talented people. Join us!
        • Learn more

  • Login
    • Analyst  ↗
    • Explorer ↗
  • Contact Us
analyst graphic

EXPLORER

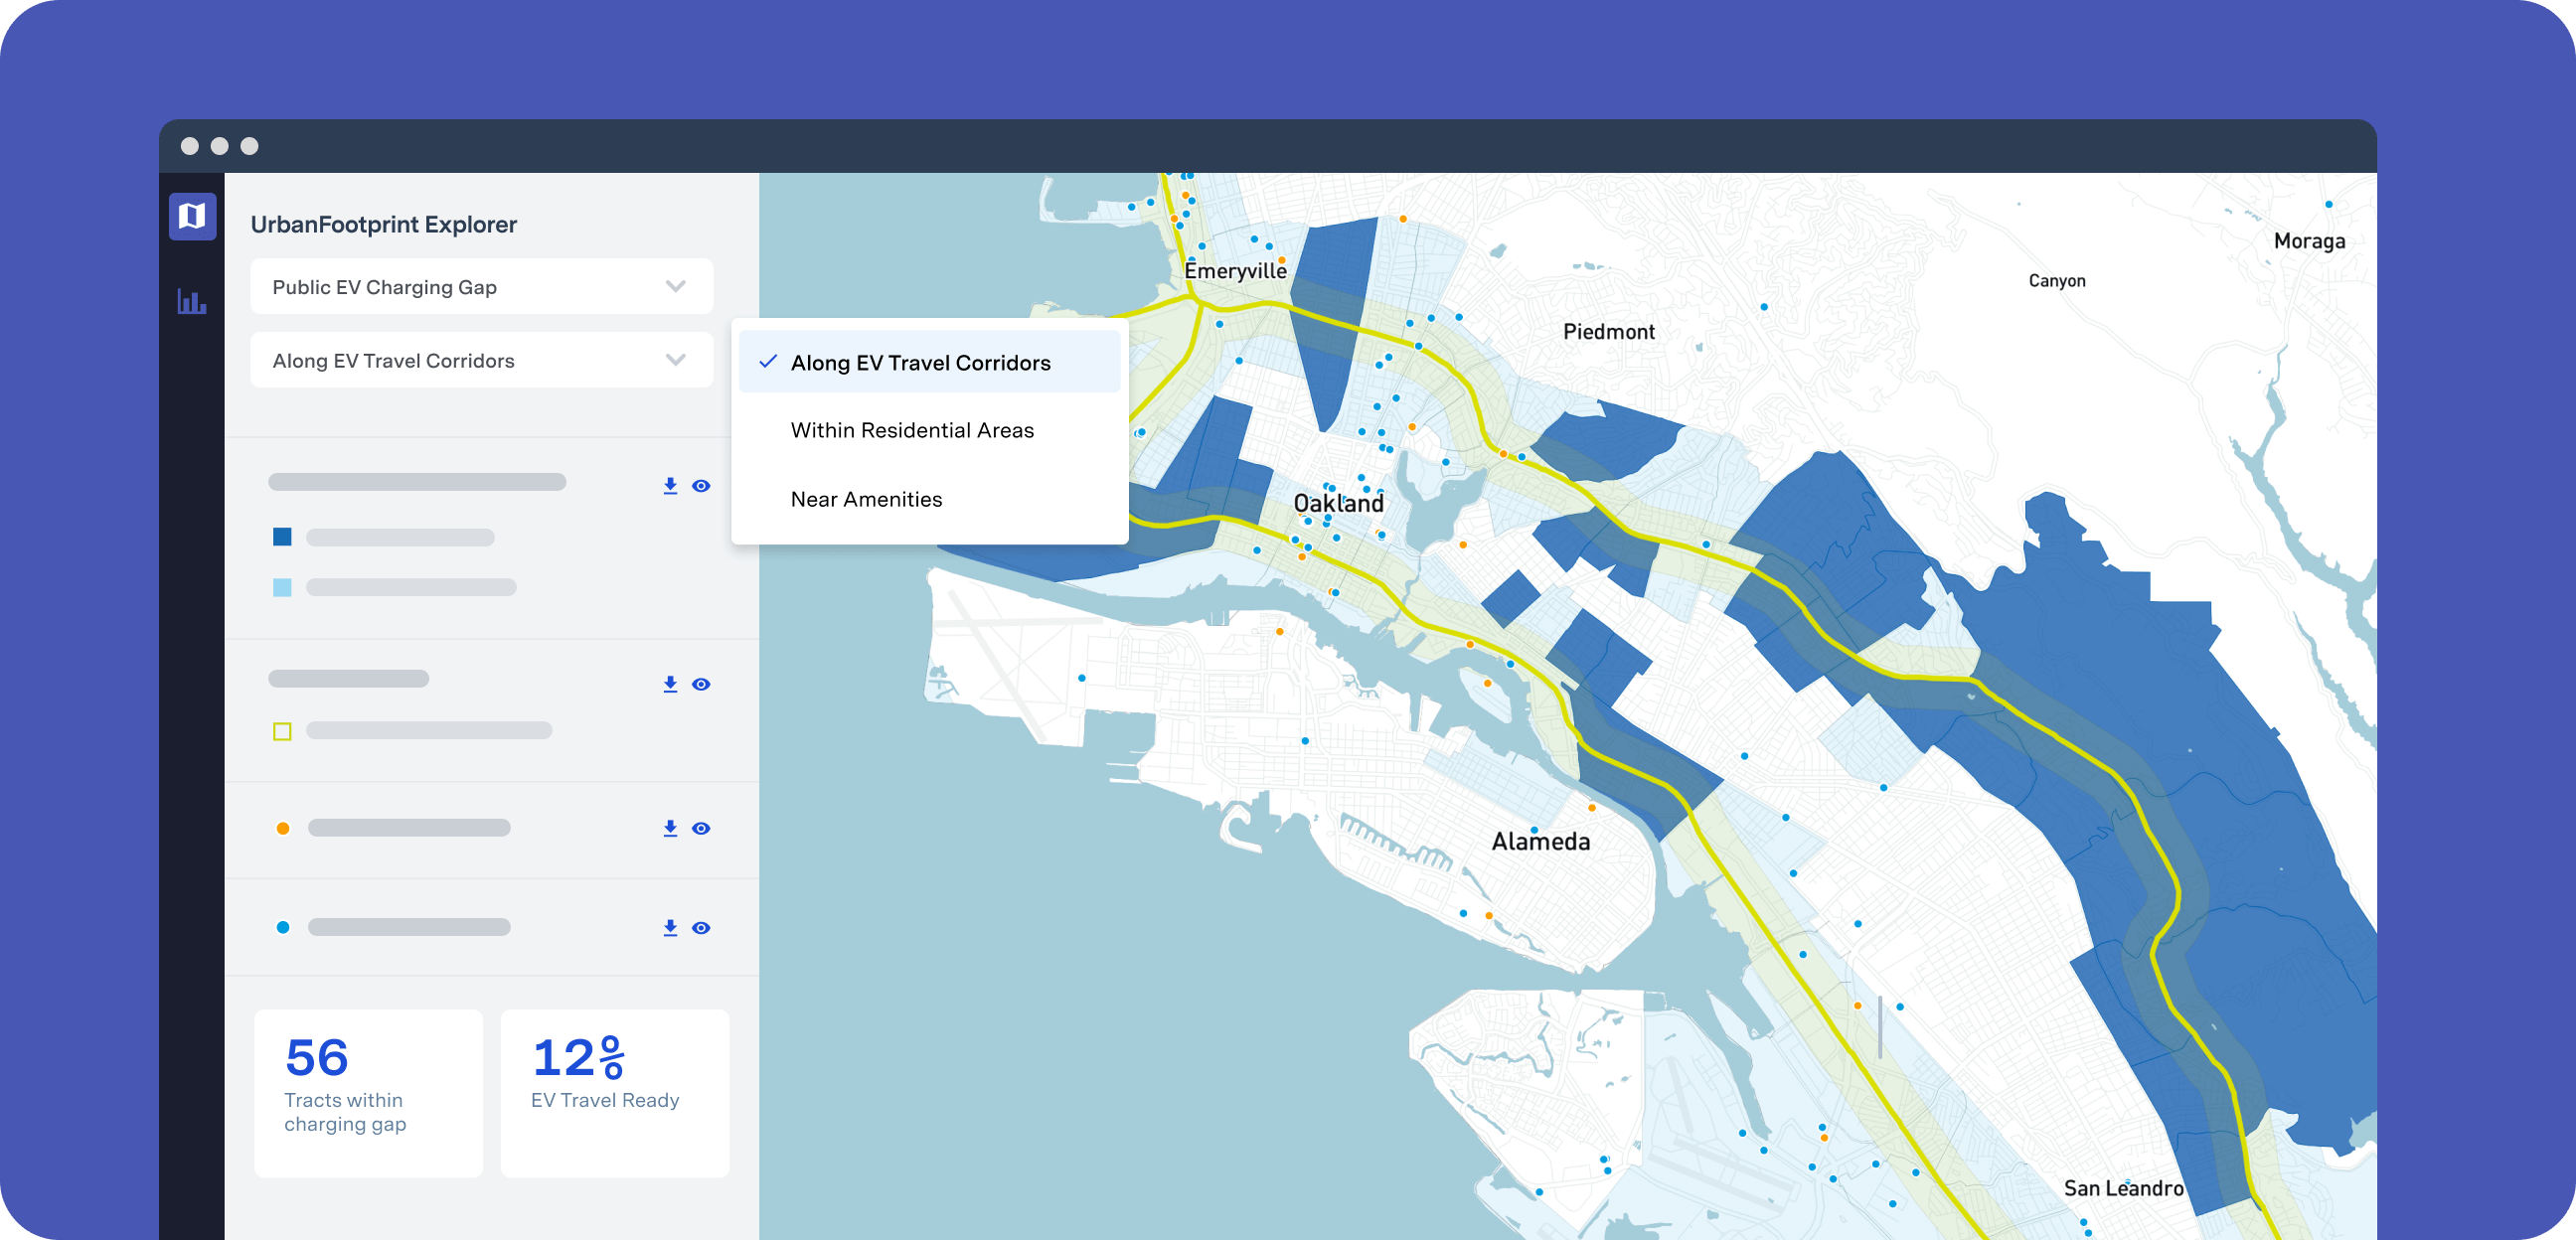
Access simple, powerful, maps and data visualizations

Complex analysis, simplified – UrbanFootprint Explorer is the fastest way to interpret our location-based Resilience Insights and leverage them for collaboration and visibility with a variety of stakeholders

Get a Demo
Explorer Hero
Explorer Features 01
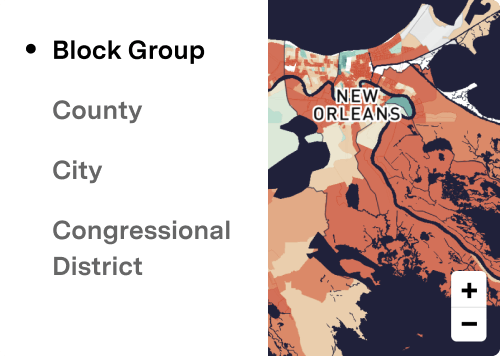
Explore data at any geographic scale
Explorer Features 02
Easy-to-interpret data insights accessible from any web browser
Explorer Features 03
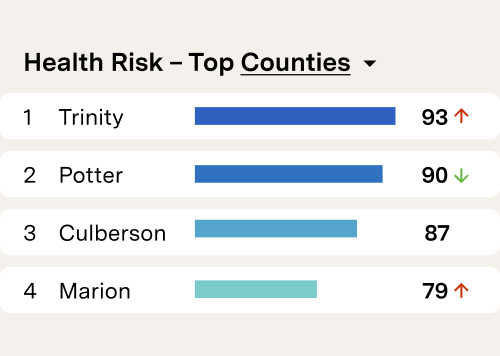
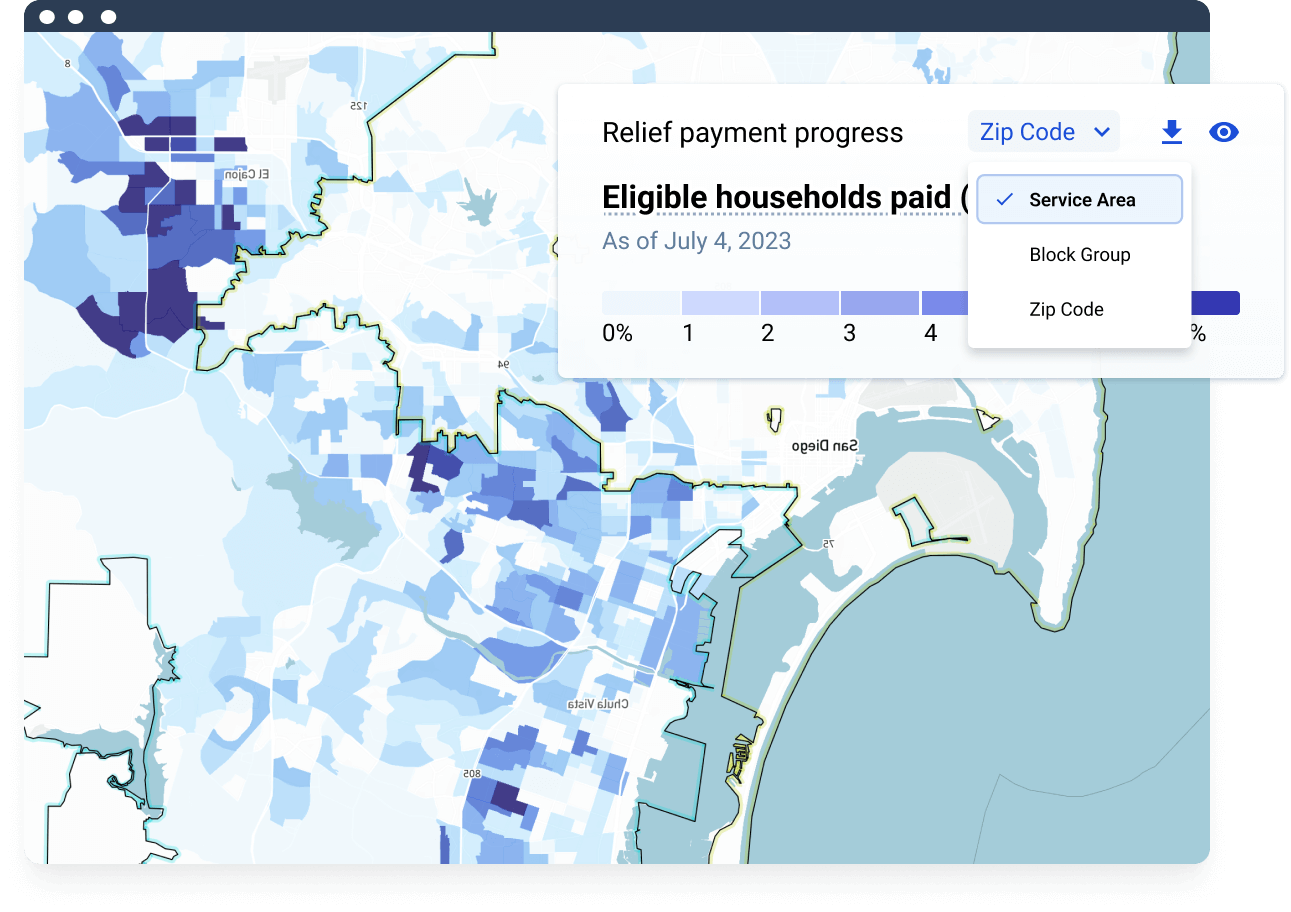
Track and explore data trends with comprehensive charts and interactive maps

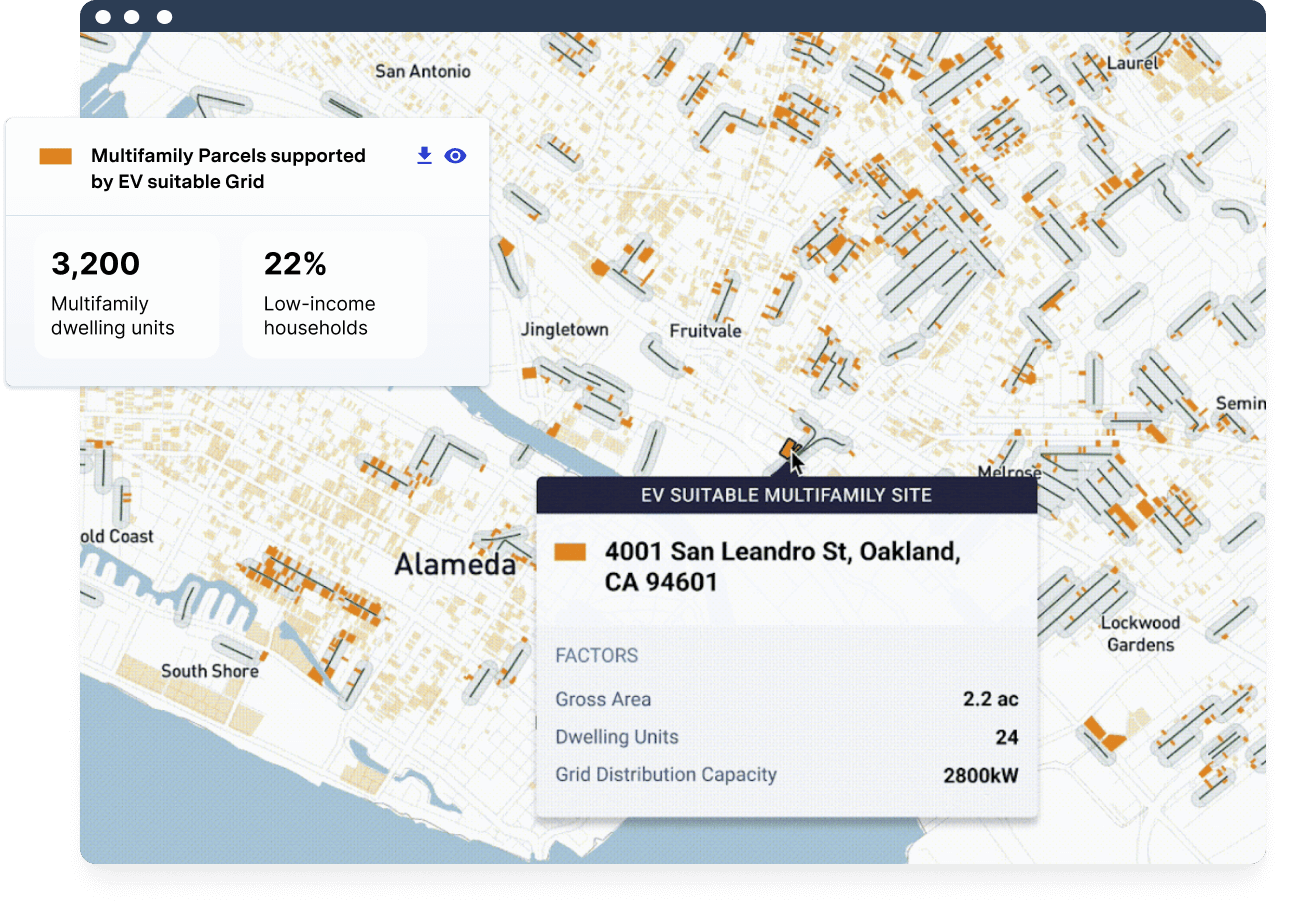
Access easy-to-use, interactive maps and visually rich dashboards to make informed decisions quickly

Risk and Resilience Assessment

Map, compare, and quantify

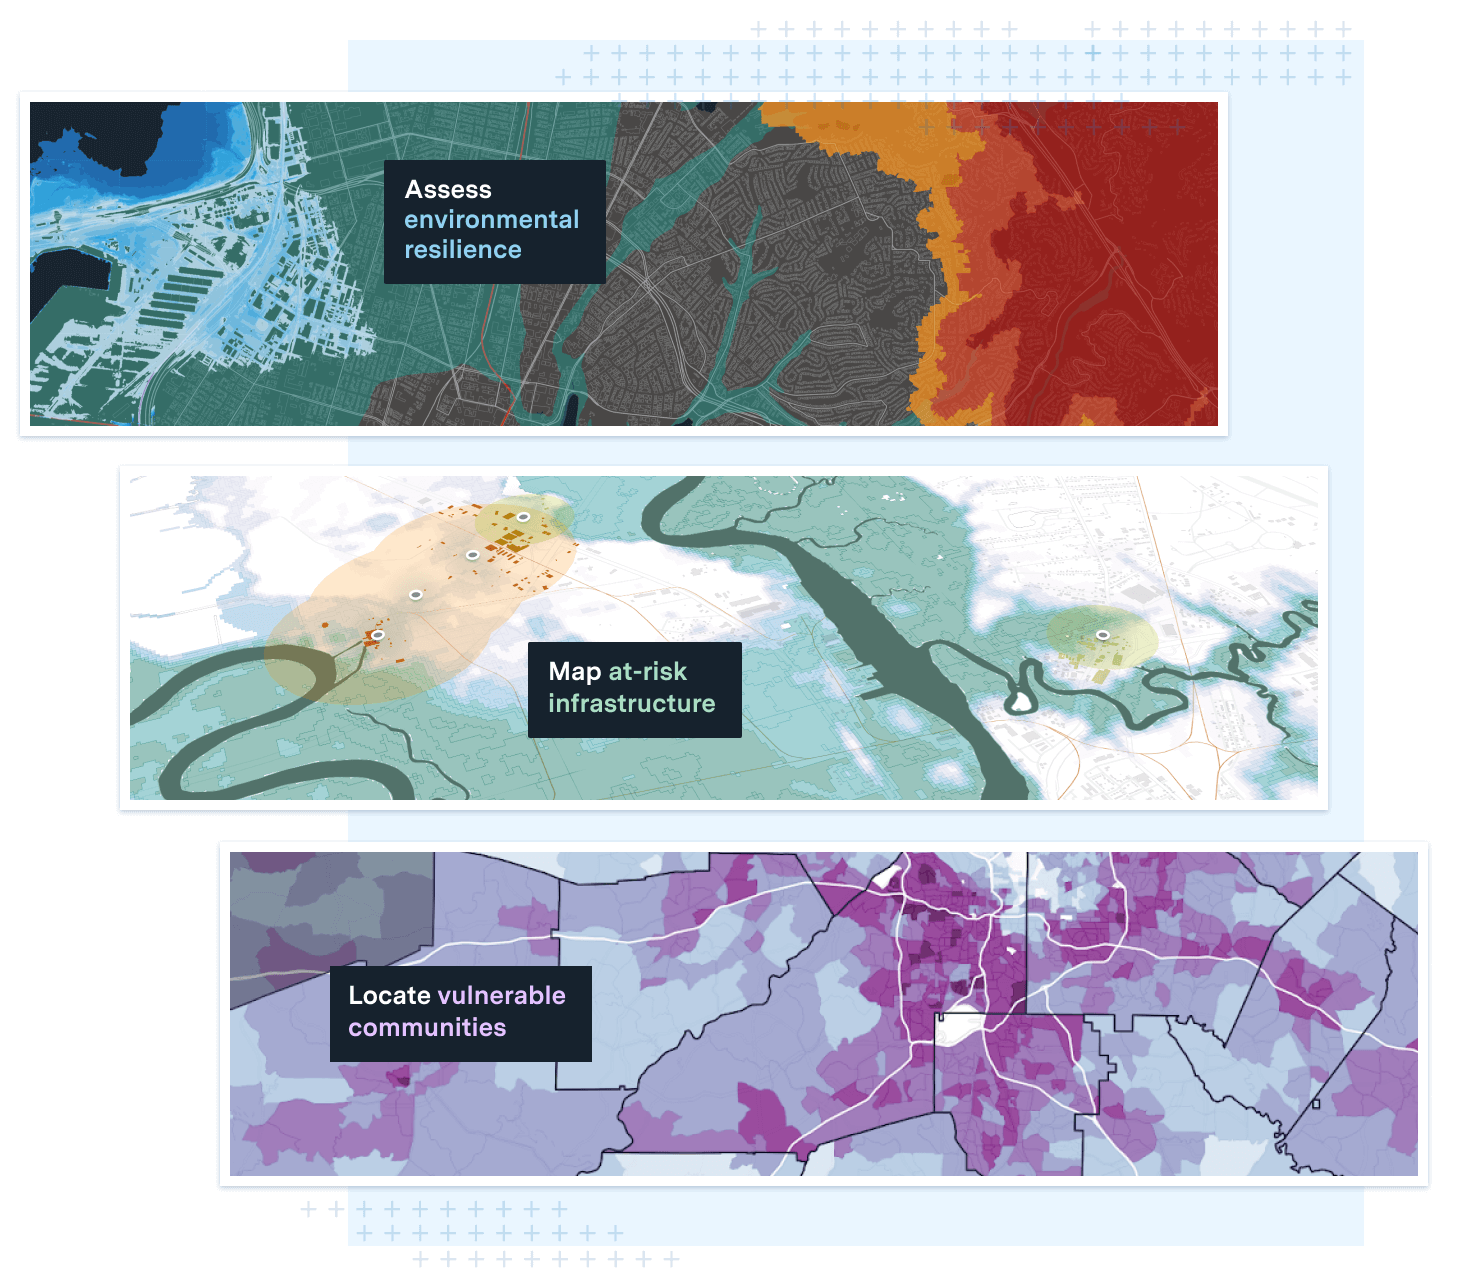
Compare community resilience and climate risk for any asset or area

Visualize at-risk infrastructure, investment sites, property, or population in a geographical area

Identify communities impacted by social vulnerability, economic stress, health risks, and more

Explorer Risk Resilience
Explorer Tacticalplanning

Tactical Planning

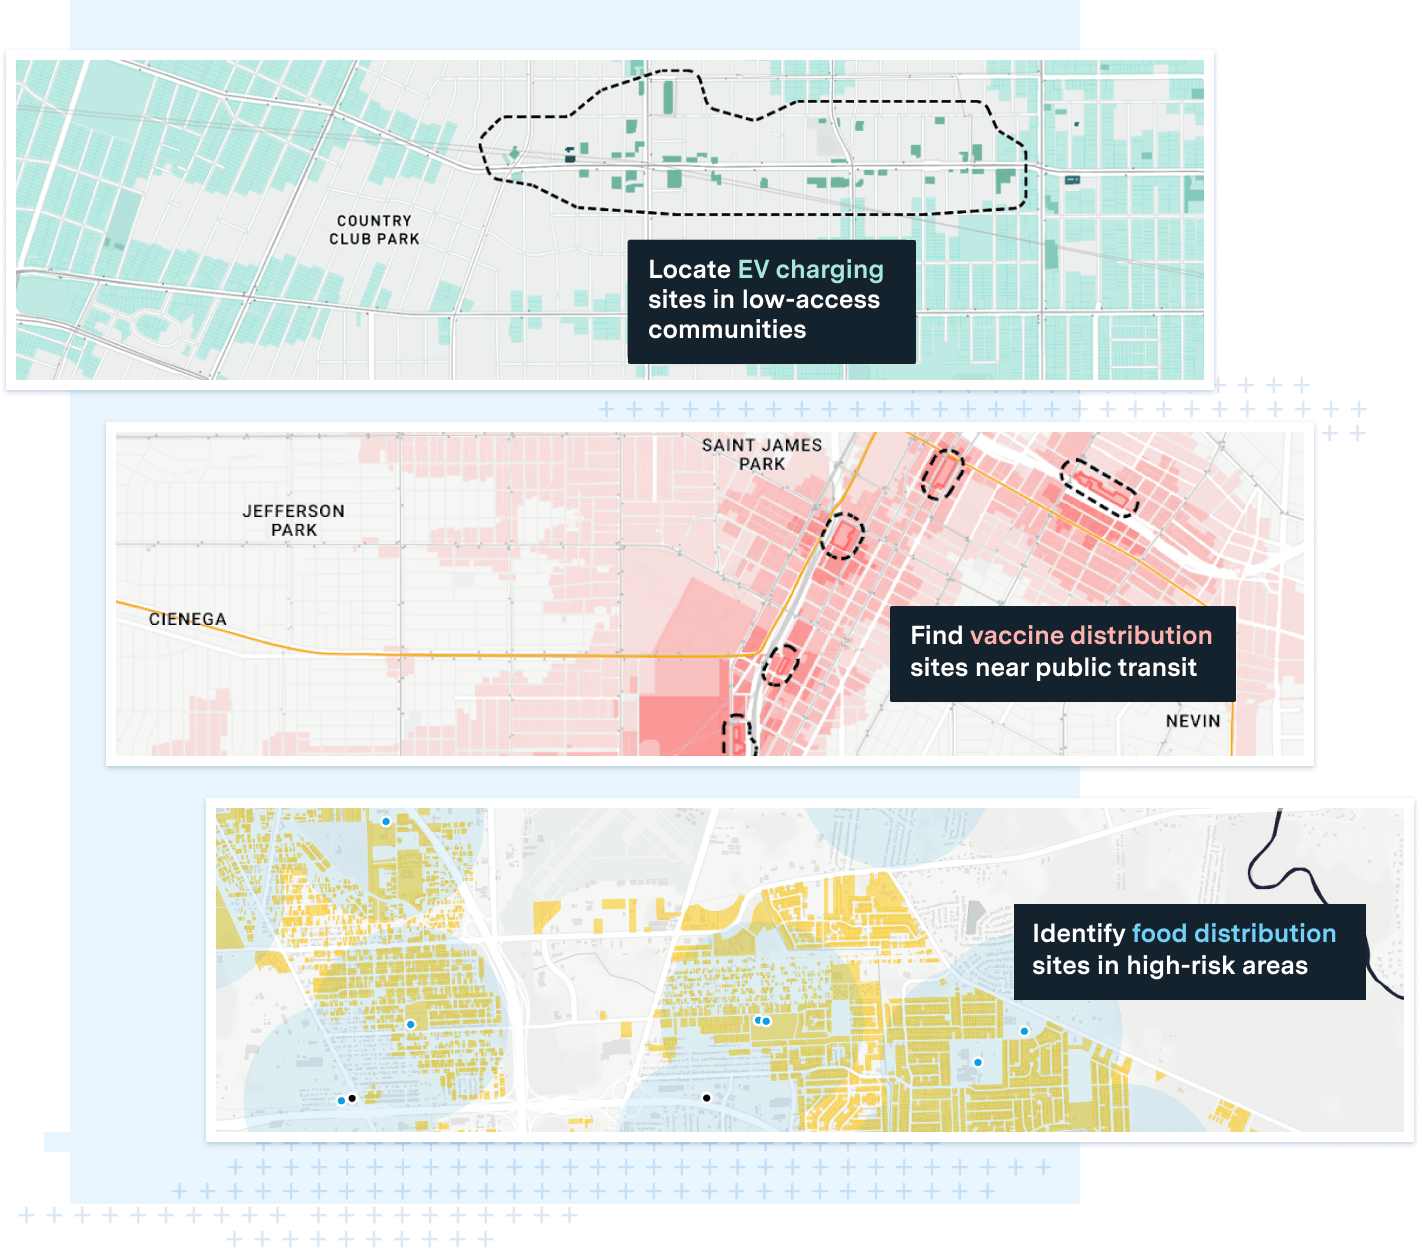
Optimize interventions and site selection

Prioritize infrastructure investments to bolster community resilience and lower natural hazard risk

Assess existing plans and programs through the lens of community resilience and climate risk

Analyze downstream impacts of resource allocations under different health, social, and economic recovery scenarios

KEY CAPABILITIES

Embrace the value of comprehensive data visualization and accessible mapping across your entire team

Explorer Capabilities 01
Cartography Made Easy

Data-driven decision making that anyone can use

Explorer Cartography Icon 01

Shared view across your entire organization

Icon Download

Export any map from Analyst as a PNG for immediate use or as an SVG for vector editing programs

Icon Clock

Create a parcel- or block-level map in mere minutes. Craft maps with intuitive and intelligent tooling

Explorer Capabilities 02
Purpose Built Insights

Accessible insights, curated for you

Explorer Purpose Icon 01

Access from any web browser

Explorer Purpose Icon 02

Ready-made data packages

Explorer Purpose Icon 03

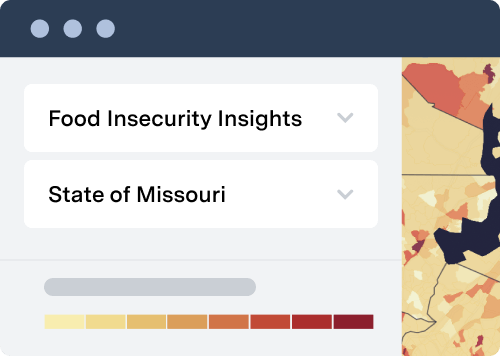
Map data from the state down to the neighborhood

Explorer Purpose Icon 04

Export maps and data tables with ease

Want to schedule a product demonstration?

Tweet
Share
Share

Never wonder where

UrbanFootprint logo
Contact Us

    • SOLUTIONS
    • Climate Risk & Sustainability
    • Infrastructure & Mobility
    • Public Service & Administration
    • Capital Markets & ESG
    • FOUNDATIONS
    • Built Environment
    • People & Vulnerabilities
    • Climate & Hazards
    • EXPERIENCES
    • Analyst
    • Explorer
    • Direct Data Delivery
    • RESOURCES
    • Case Studies
    • ESG
    • Community Resilience
    • Climate Resilience
    • Technical Support
    • ABOUT
    • Careers
    • Leadership
    • In the News
    • Contact Us

©2025 All rights reserved.

  • Terms & Conditions
  • Privacy Policy