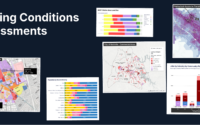
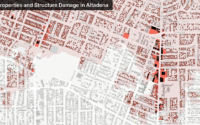
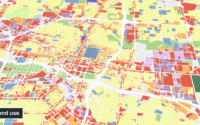
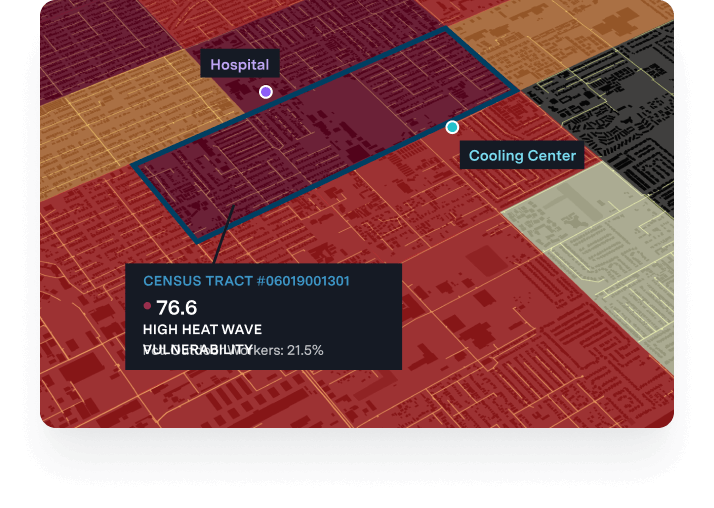
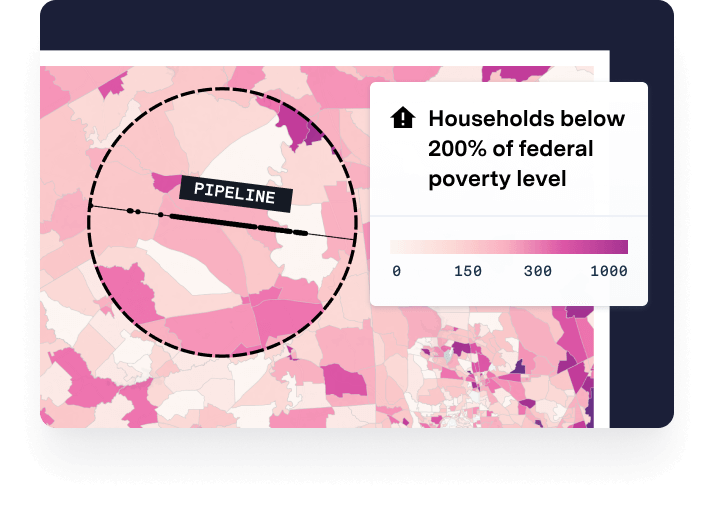
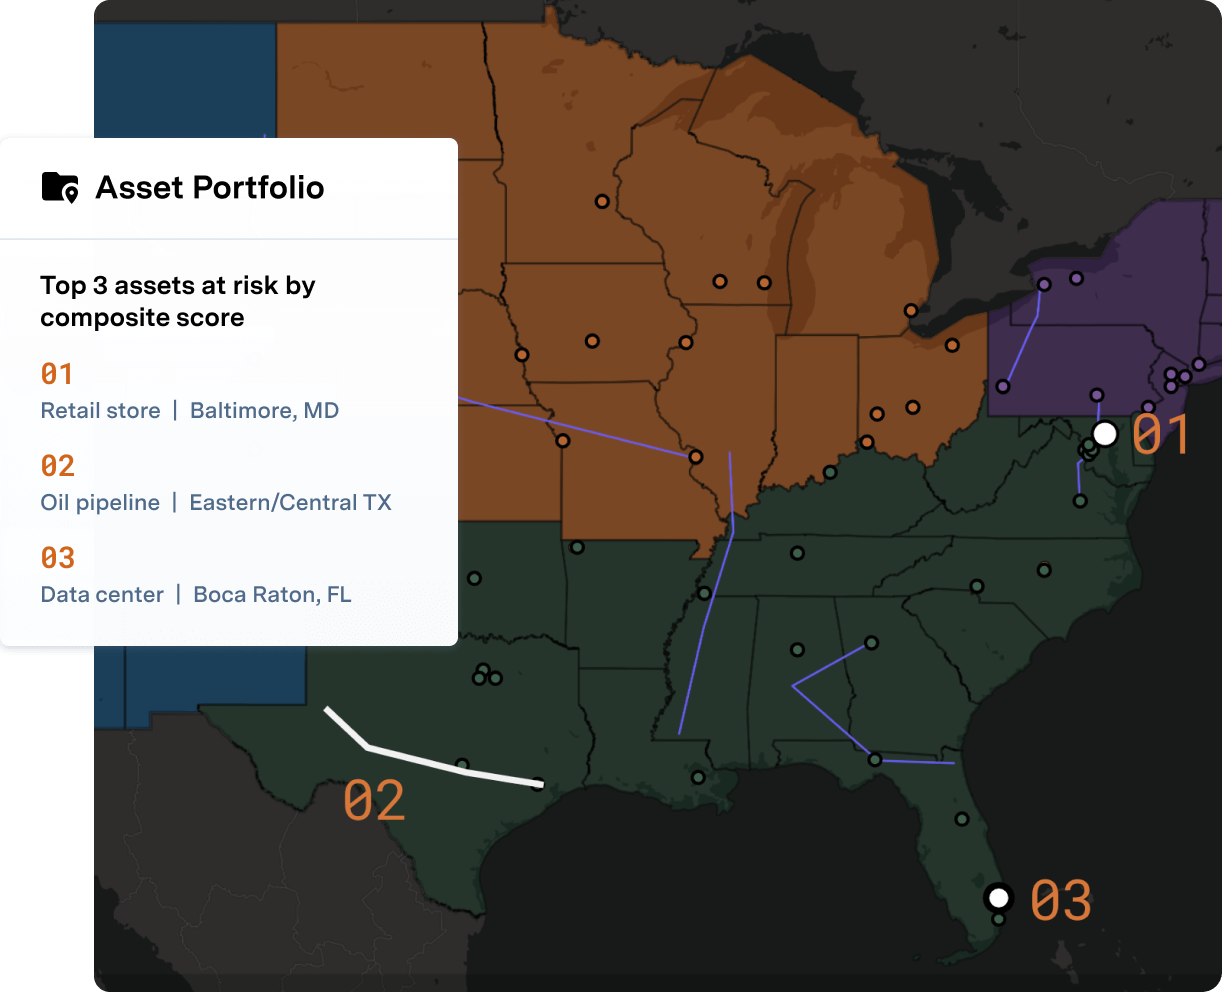
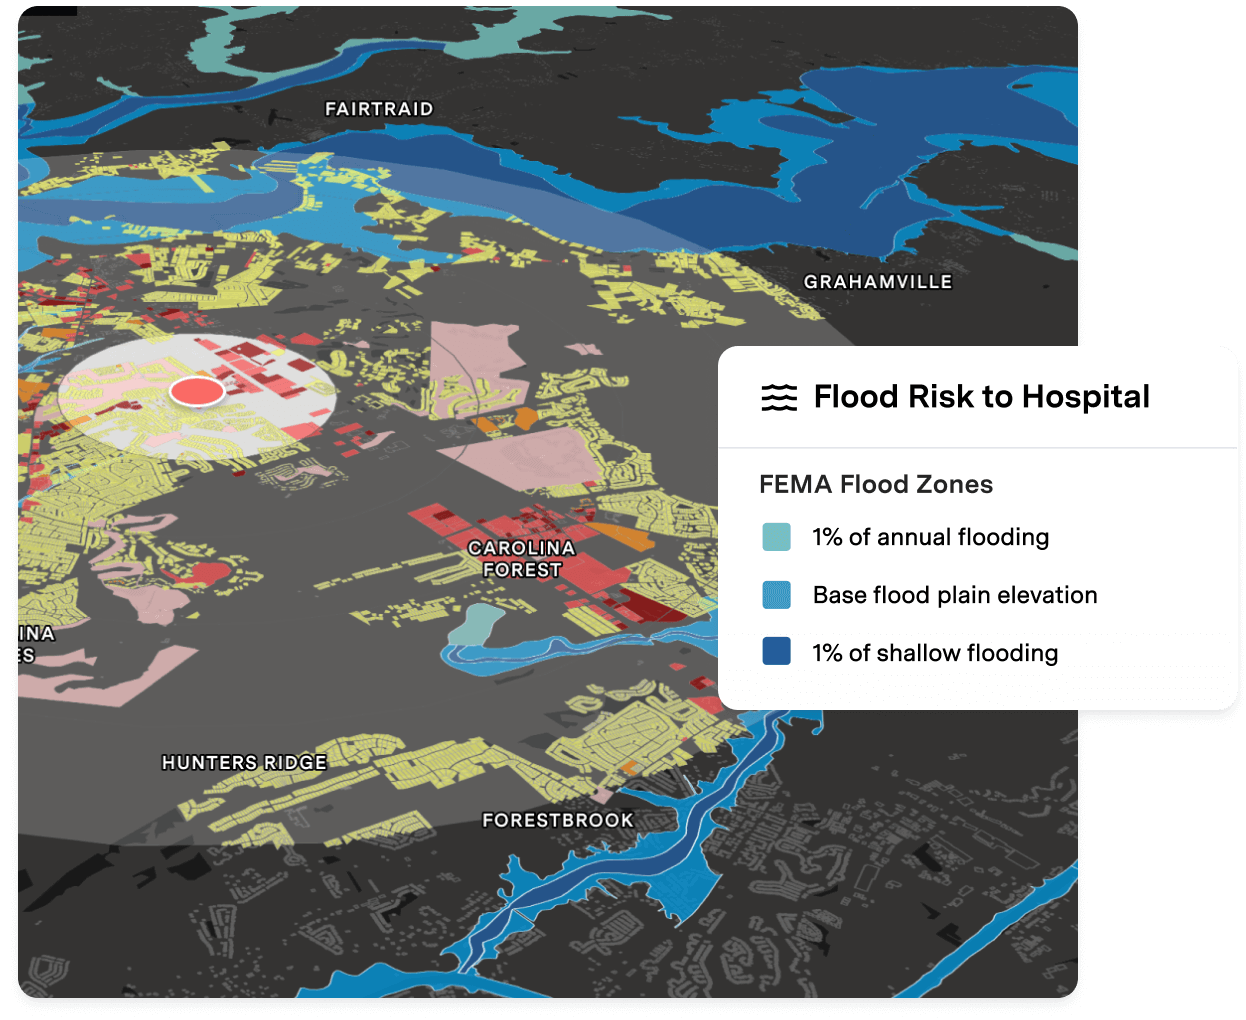
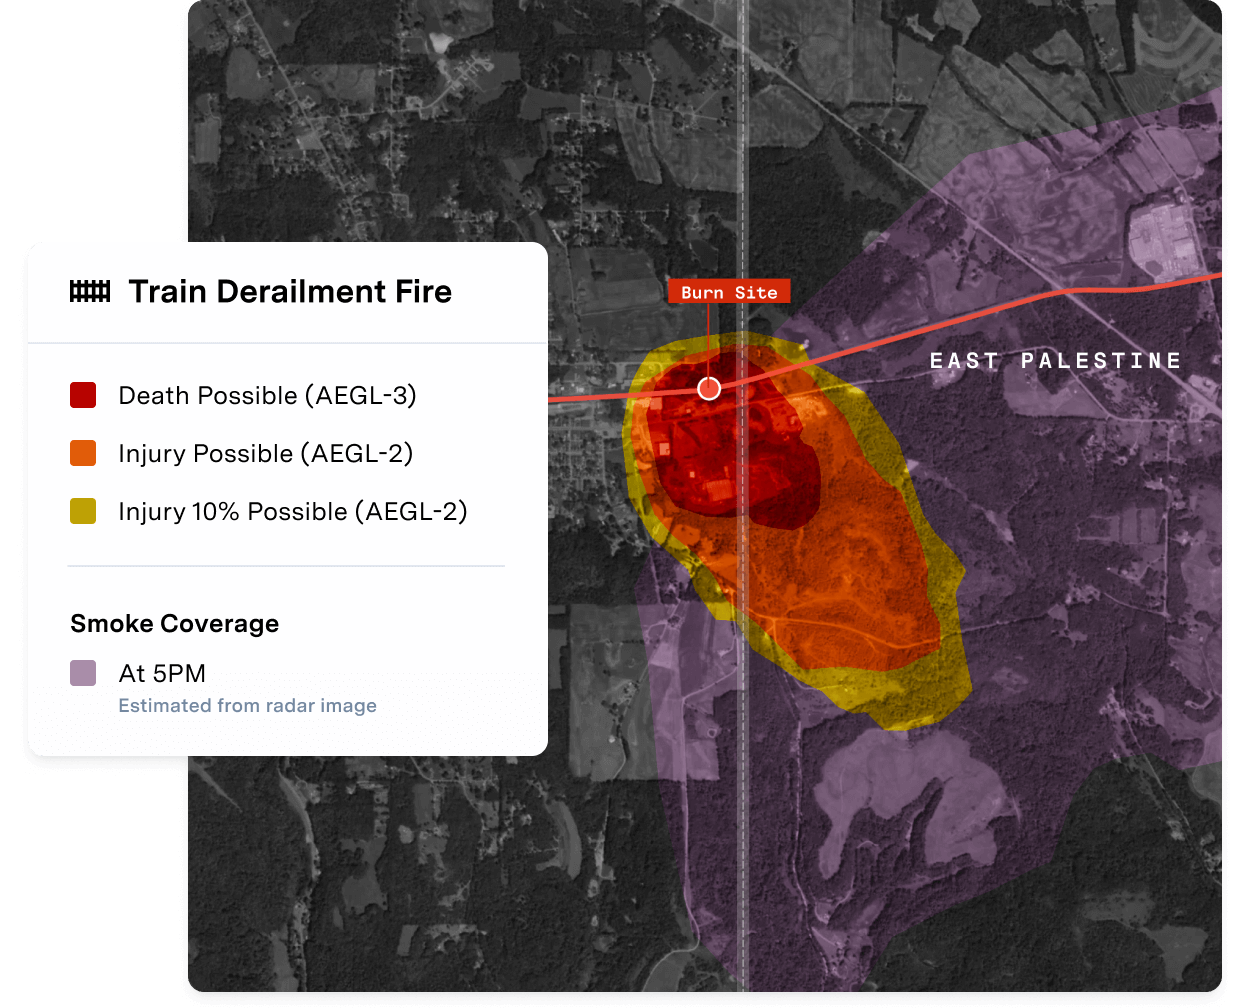
Designed by planning, emergency response, and recovery experts, the UrbanFootprint data, mapping, and analytics platform distills the complex fabric of factors influencing the COVID-19 crisis into actionable insights – including income and unemployment shifts, underlying health conditions, access to transportation, healthy foods, adequate healthcare, and more. Map and analyze the progression of impacts, vulnerabilities, and policy interventions at the state, city, and neighborhood level.
Case study
The COVID-19 Recovery Insights Platform is providing granular information on areas where our work against food insecurity is needed most or needs to be intensified. As a result, we are better able to focus our response and maximize the impact of our efforts for our communities.
Mike Manning, President & CEO, Greater Baton Rouge Food Bank
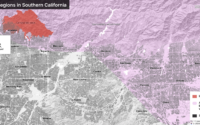
Rapidly map where communities are most impacted by the cascading effects of job loss, food insecurity, and underlying social vulnerability.
Analyze the downstream impacts of resource allocations under different health, social and economic recovery scenarios.
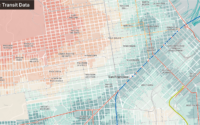
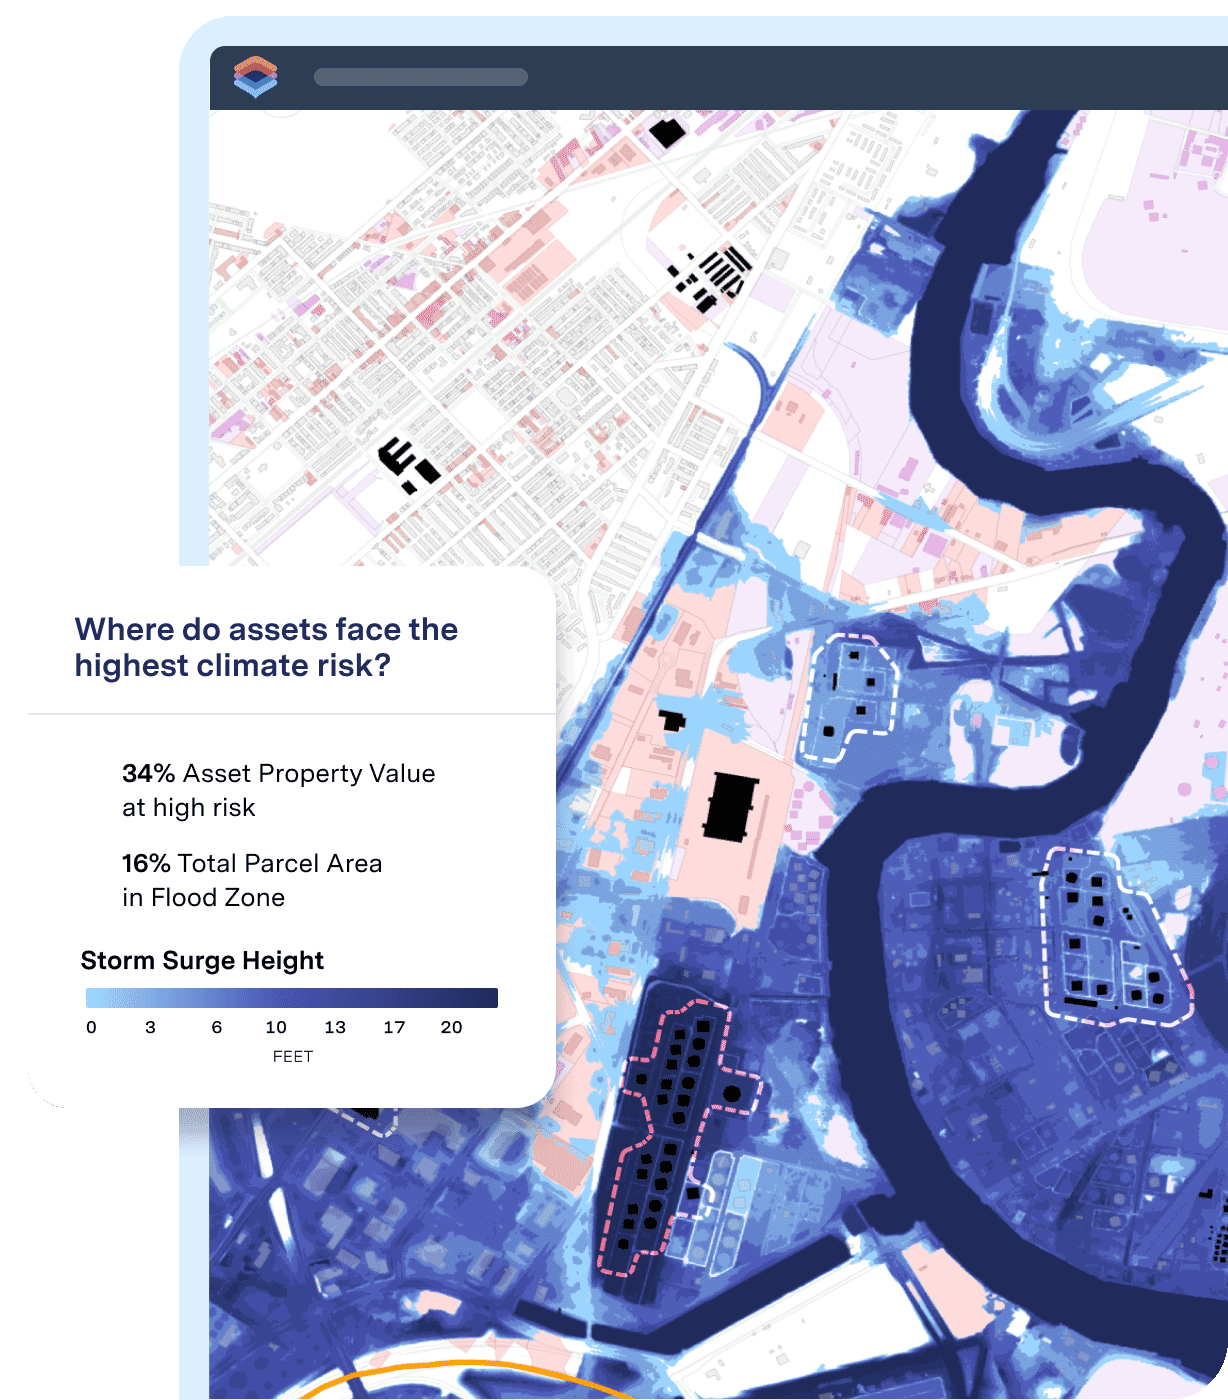
The core web application powers smart recovery planning at every scale. Map and assess existing conditions. Plan tactical responses with built-in parcel and block-level housing, employment, and social vulnerability data.
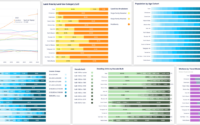
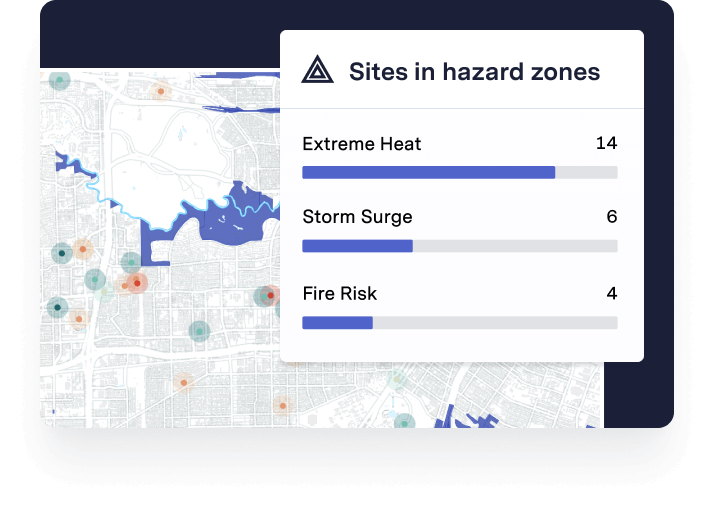
Access dynamic, interactive maps and dashboards that show progress over time across a range of critical recovery indicators such as economic stress, social vulnerability, food security, and more.
Curated by experts in emergency response and recovery, data science, and mapping, our custom datasets help you answer critical questions about where to deploy resources, how to triage response and where to expect economic impact to be greatest in the coming weeks and months.
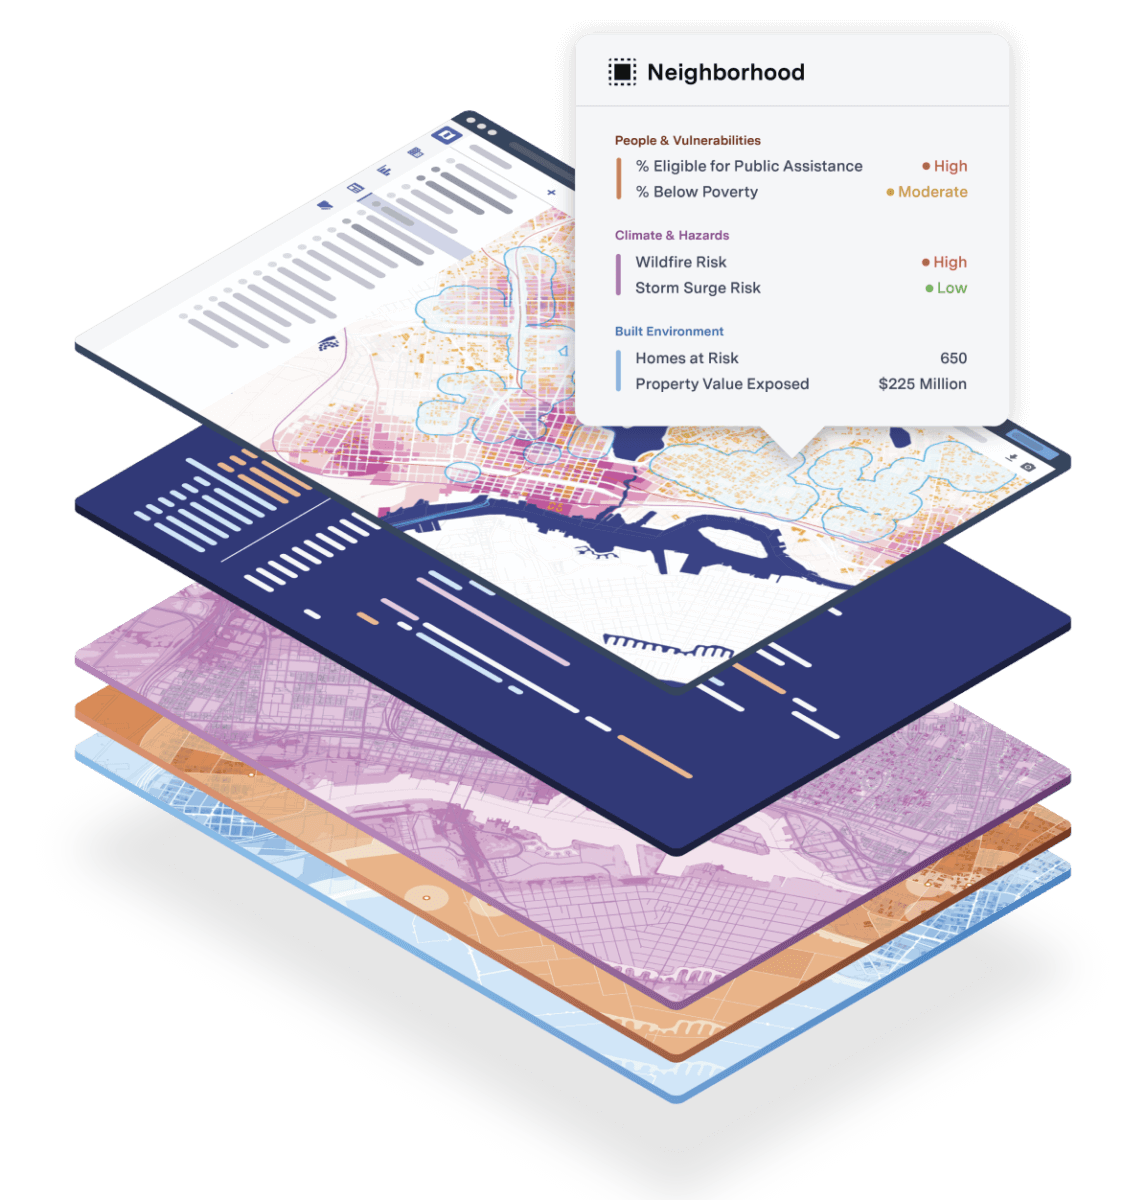
A comprehensive, nation-wide, parcel-level data library of land use, risk and resilience, health, equity, and environmental justice data powers our three offerings below:
The core web application powers smart recovery planning at every scale. Map and assess existing conditions. Plan tactical responses with built-in parcel and block-level housing, employment, and social vulnerability data.
Access dynamic, interactive maps and dashboards that show progress over time across a range of critical recovery indicators such as economic stress, social vulnerability, food security, and more.
Curated by experts in emergency response and recovery, data science, and mapping, our custom datasets help you answer critical questions about where to deploy resources, how to triage response and where to expect economic impact to be greatest in the coming weeks and months.
Discover how to get quick insights with UrbanFootprint data, mapping, and analytics.