


If you’re interested in creating a project like this, let us know!
At UrbanFootprint, we believe better data and more effective planning tools are critical to fostering more resilient and healthier cities where citizens can easily access both urban amenities and natural spaces. We were excited to see a recent New York Times article highlighting the Trust for Public Land’s 2018 ParkScore report. ParkScore uses walk accessibility to a park within 10 minutes as a primary metric in ranking America’s 100 largest cities for quality and distribution of green space. The article notes that many of the cities with the best access to parks also rank as some of the healthiest regions in the country. It also points out citizens can use ParkScore to lobby local cities and officials to provide more and better access to parks.
We’d like to highlight UrbanFootprint as a powerful complement to the ParkScore toolset in its ability to measure walk accessibility to parks – and a host of other amenities – for current conditions and future land use scenarios. Planning professionals and communities can measure the impact of additional park investments and new development around parks and open space. Cities can get quick assessments of current performance, and consultants can easily integrate this capability into nearly every project, proposal, and existing conditions assessment at very low cost.
In this blog post, we demonstrate how UrbanFootprint can be used to easily map and measure walk accessibility to key destinations like parks.
Map and Measure Walk Accessibility in Minutes
UrbanFootprint measures walk accessibility for key community assets, like parks, schools, streets, transit stops, hospitals, and more for any U.S. location. Below, we’ll demonstrate how UrbanFootprint measures walk accessibility with San Diego, California and Pittsburgh, Pennsylvania as our examples.

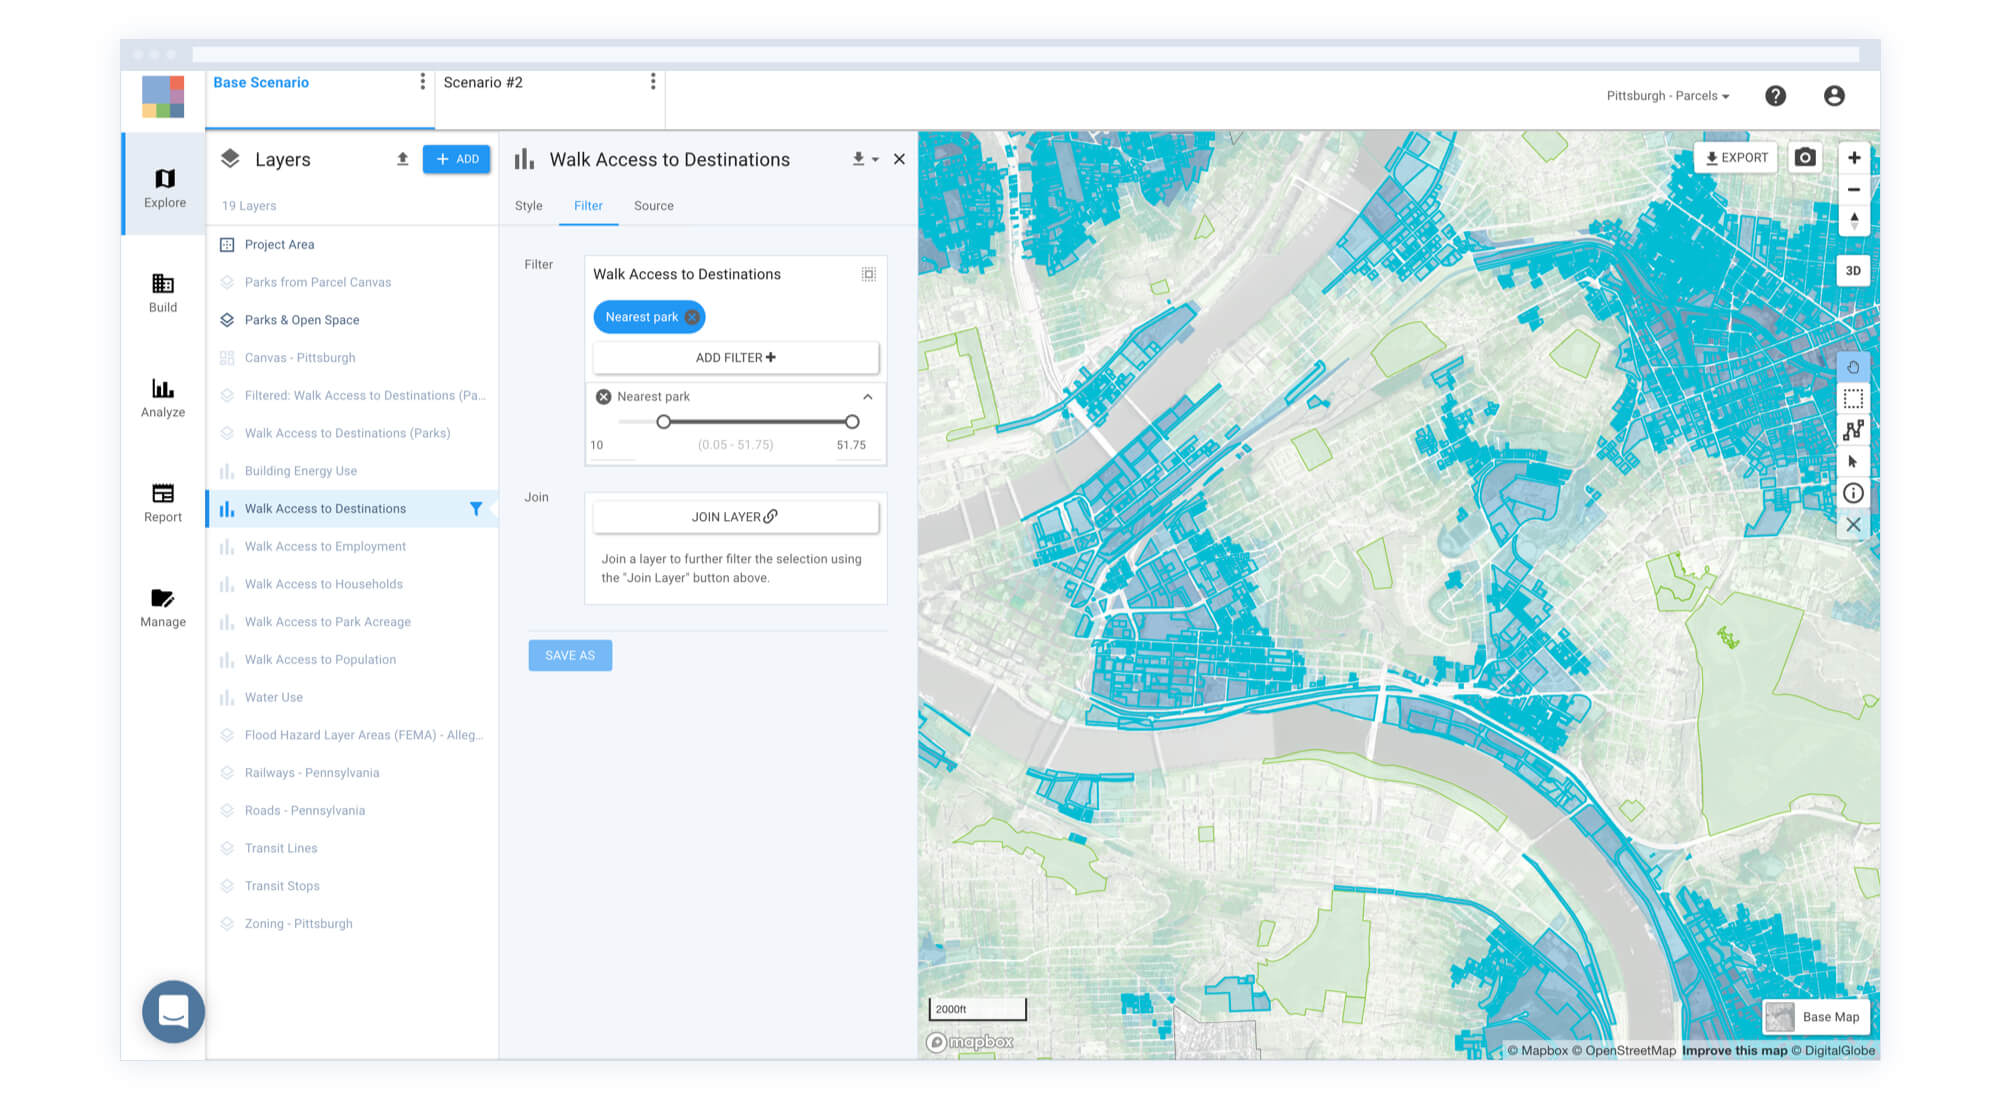
It all starts with the UrbanFootprint Base Canvas, a parcel-based assessment of existing land use, housing, and employment distribution. UrbanFootprint is pre-loaded with this data for almost all U.S. locations. We can then add roadways, parks, and other relevant data from the built-in library of data layers.
With all of this data pre-loaded in the system, measuring walk access to parks is as simple as hitting the ‘play’ button on the Walk Accessibility Module. The module produces maps of walk access along with key statistics by using the actual street network and average walk speeds to report accurate walk times to parks, open space, and other key destinations.
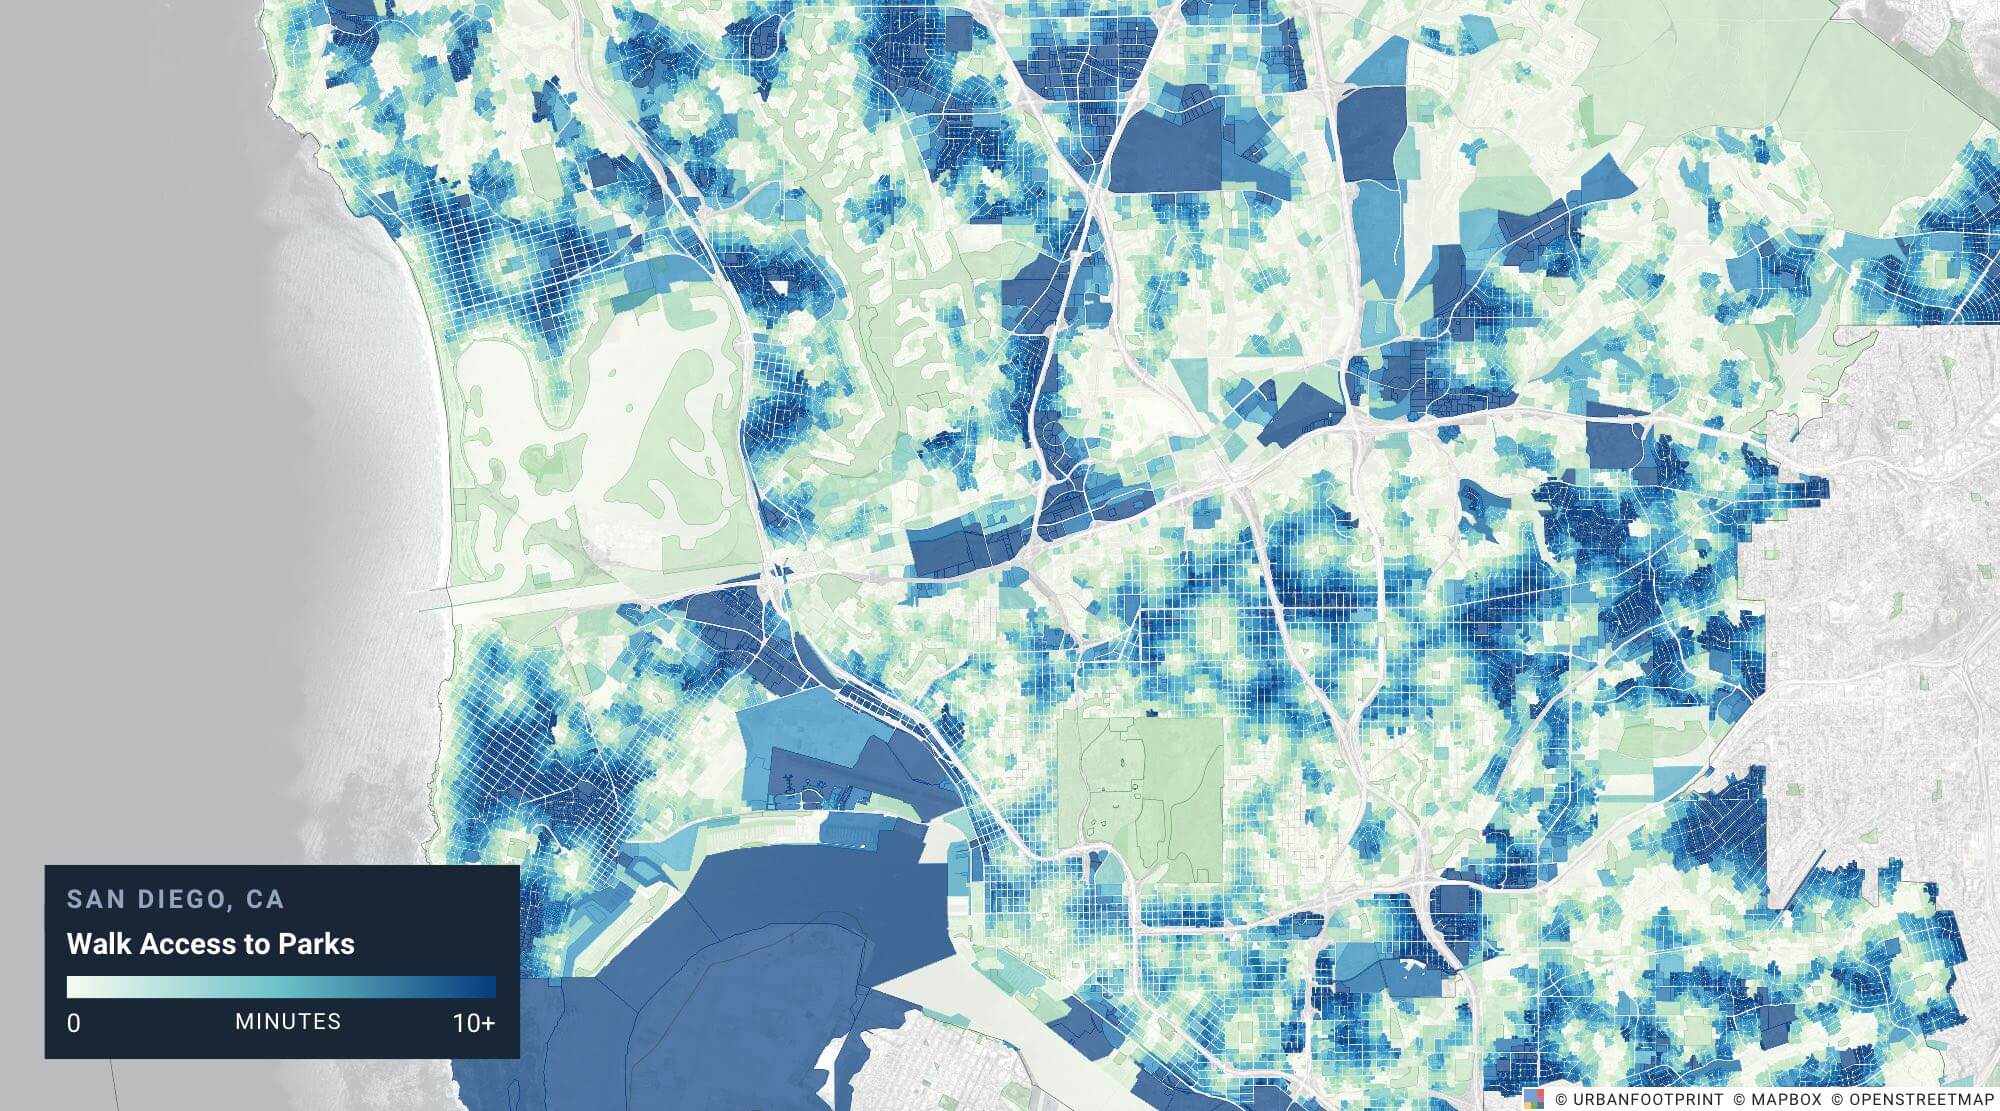
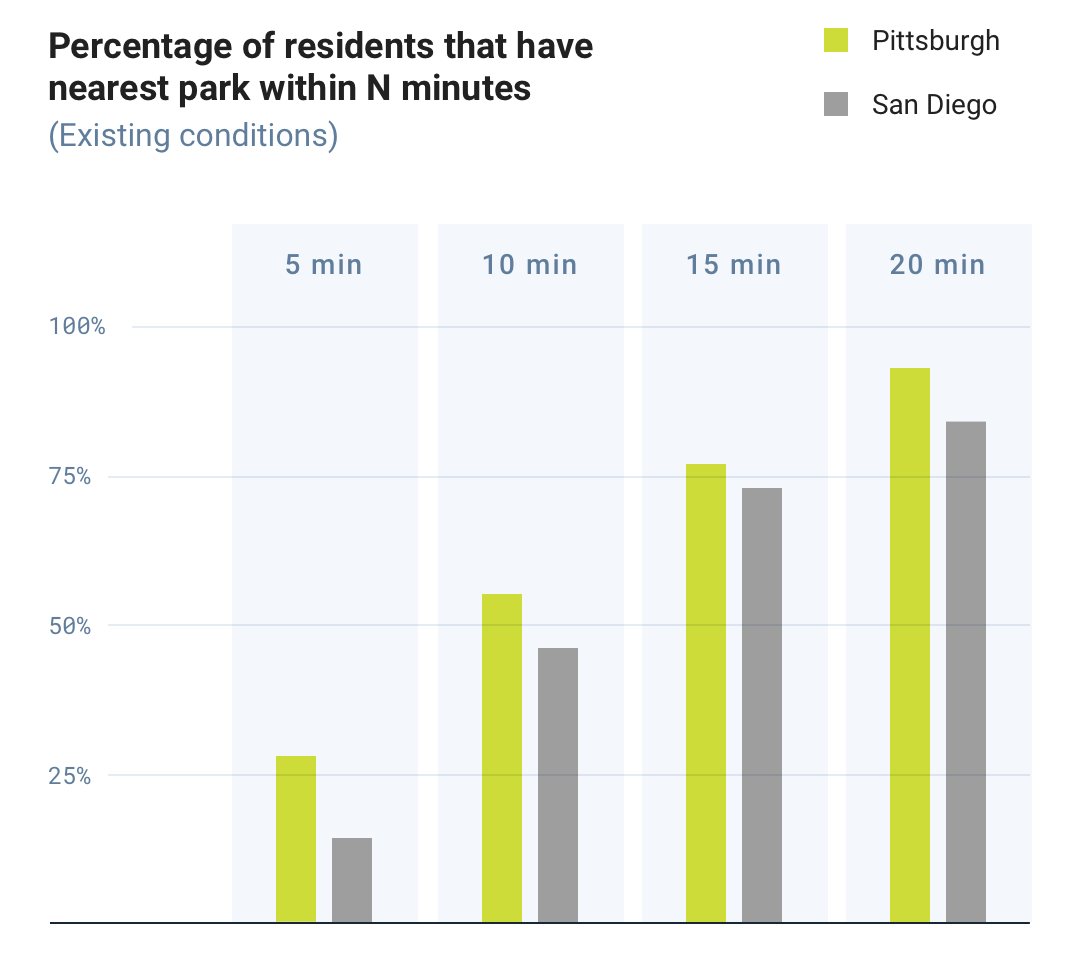
After running the Walk Accessibility Module, we’re able to quickly view walk access to parks for the City of San Diego. UrbanFootprint finds 47% of San Diego residents are within a 10-minute walk of a park. The map below details this trend. Deeper shades of blue indicate parcels with longer walking distance to a park.
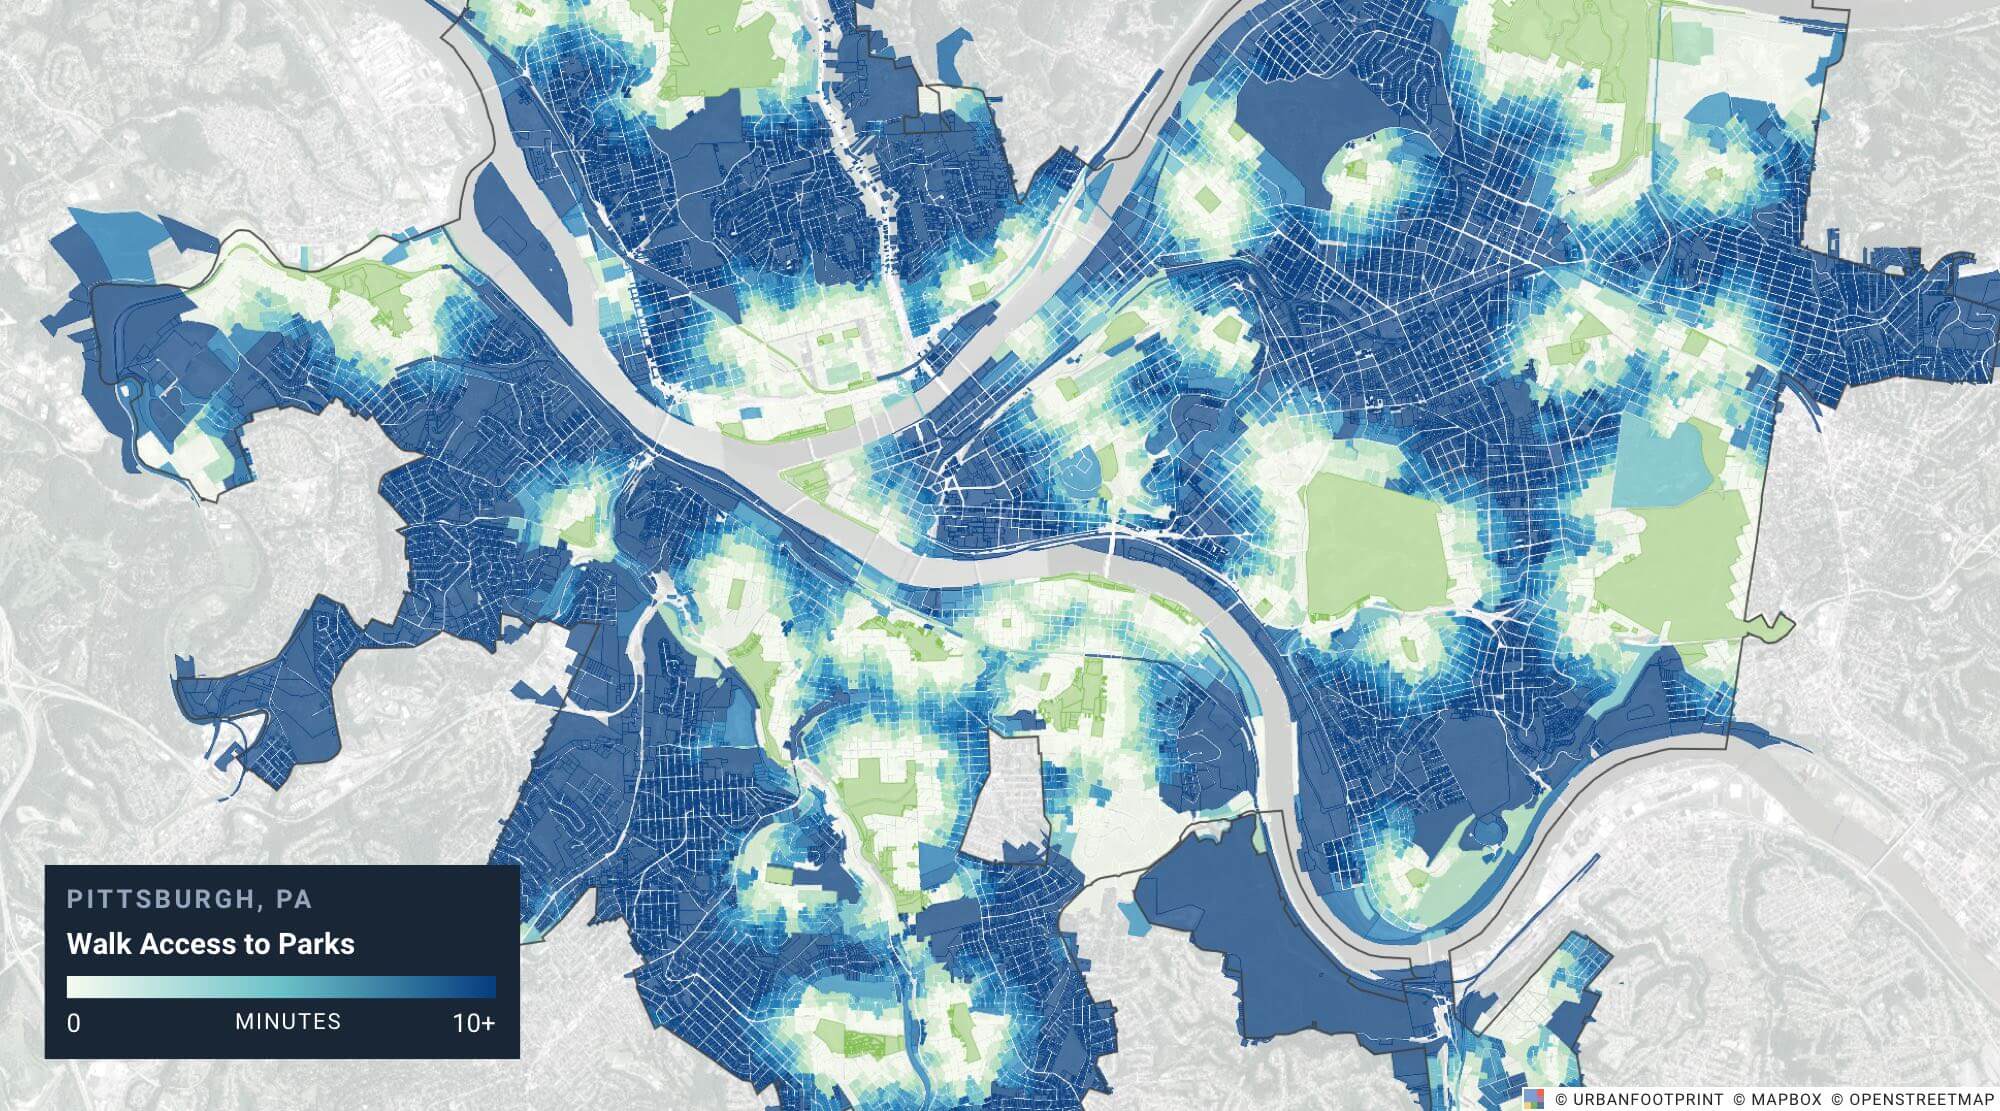
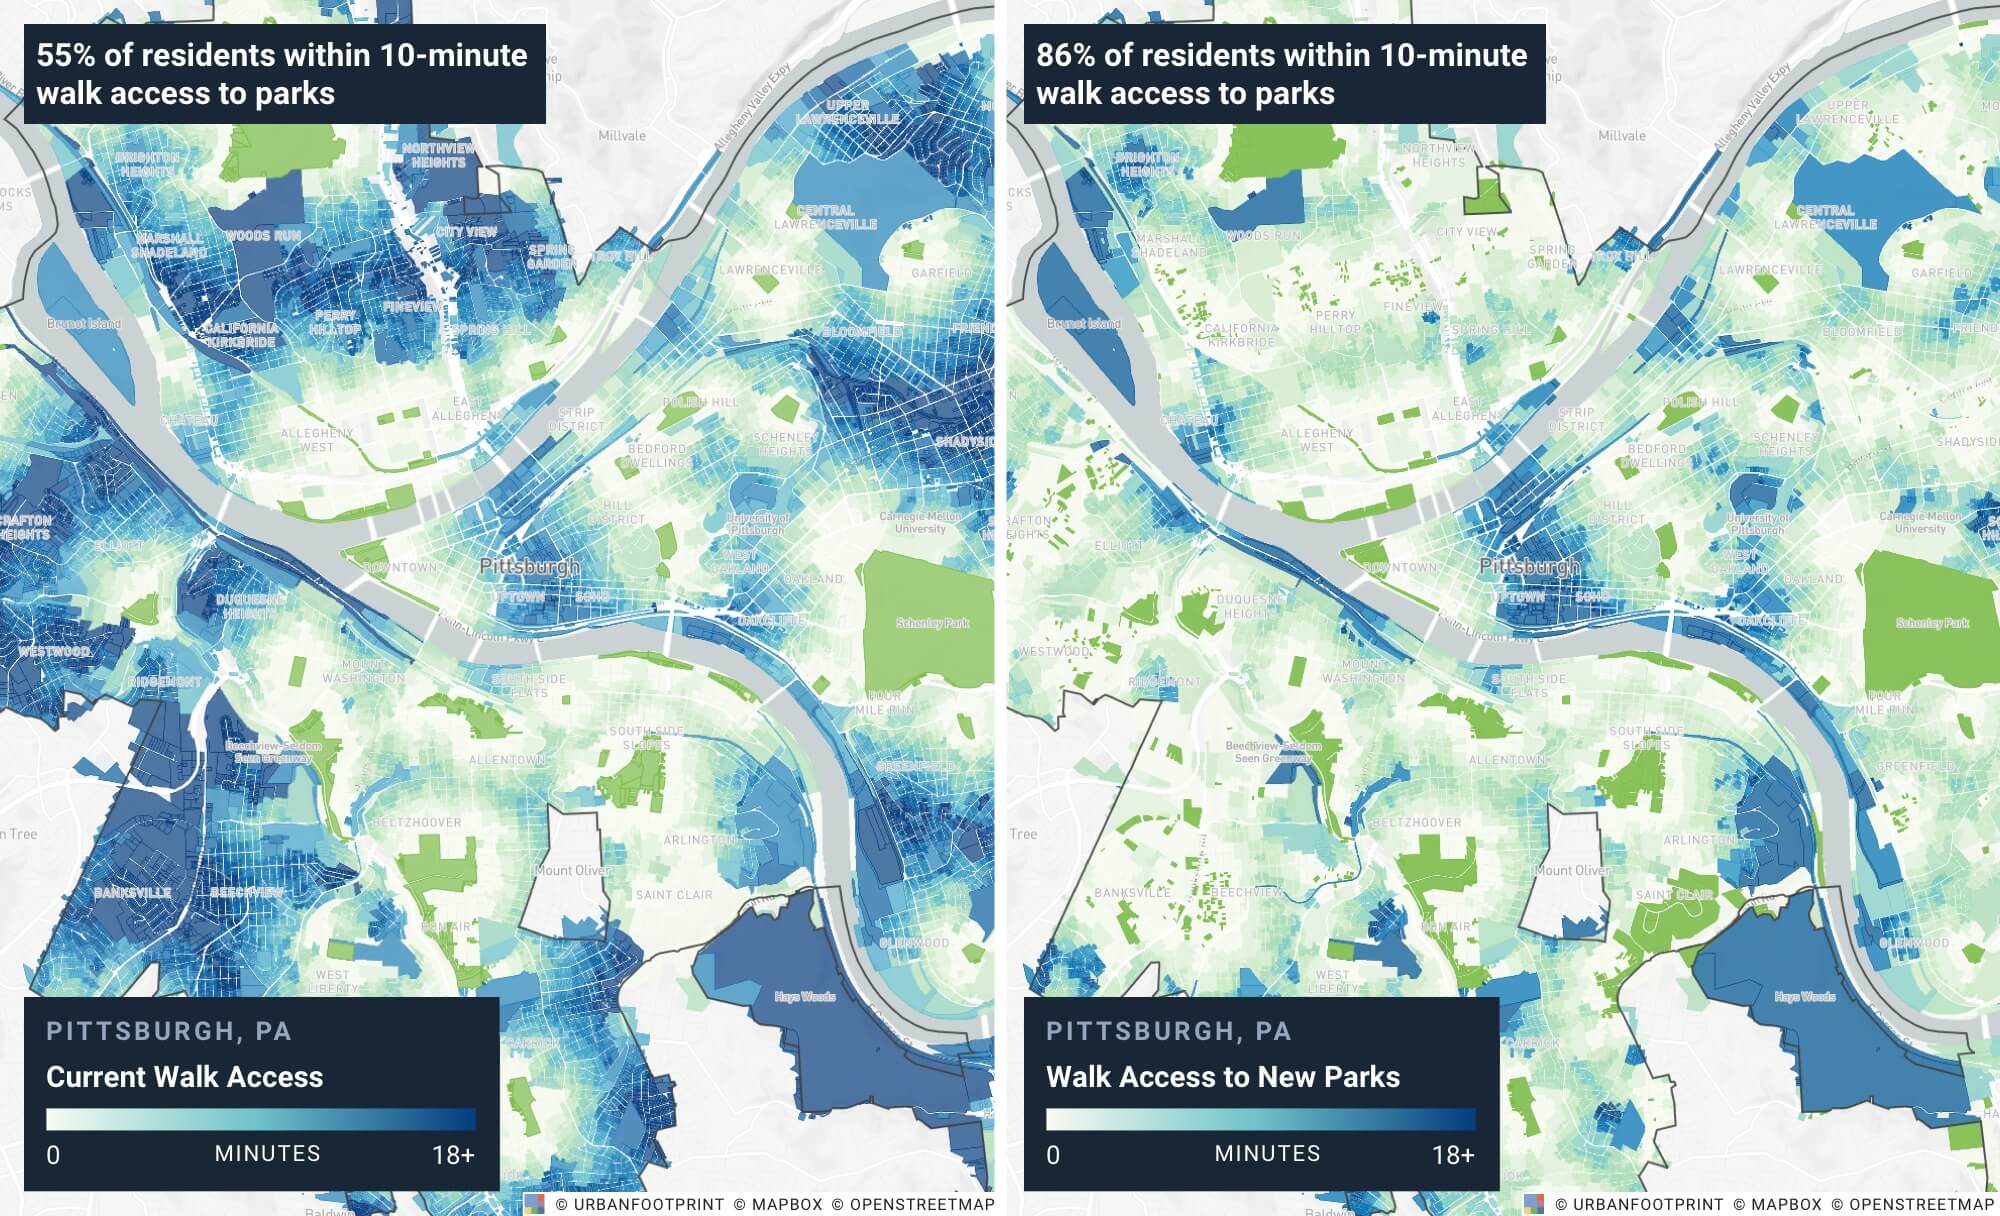
Next, we run the Walk Accessibility Module for the City of Pittsburgh, Pennsylvania. UrbanFootprint calculates 55% of Pittsburgh residents are within a 10-minute walk of a park.
To further support quick existing conditions analyses, we can easily filter and ask questions of the data and module results. For example, we can identify the parcels or homes that are not within a 10-minute walk of a park.
Next, we’ll cover how UrbanFootprint’s scenario building capabilities help planners and communities better understand the potential impacts of future development and land use plans.
How to Assess Impacts of New Development on Park Accessibility
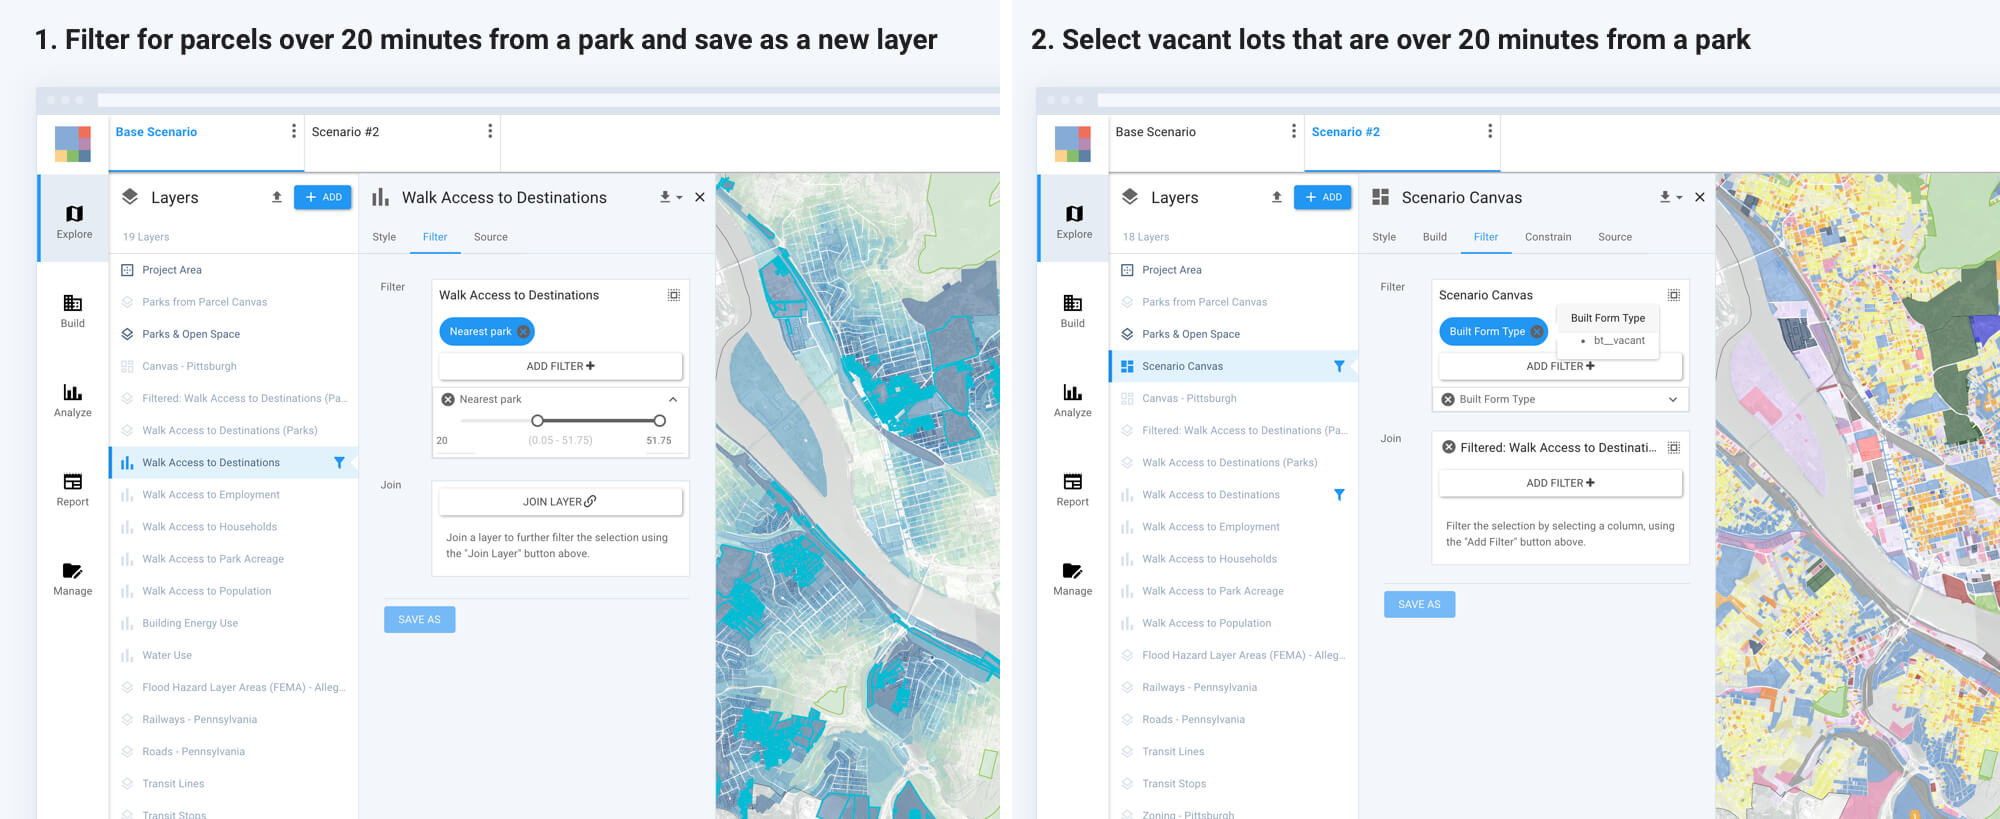
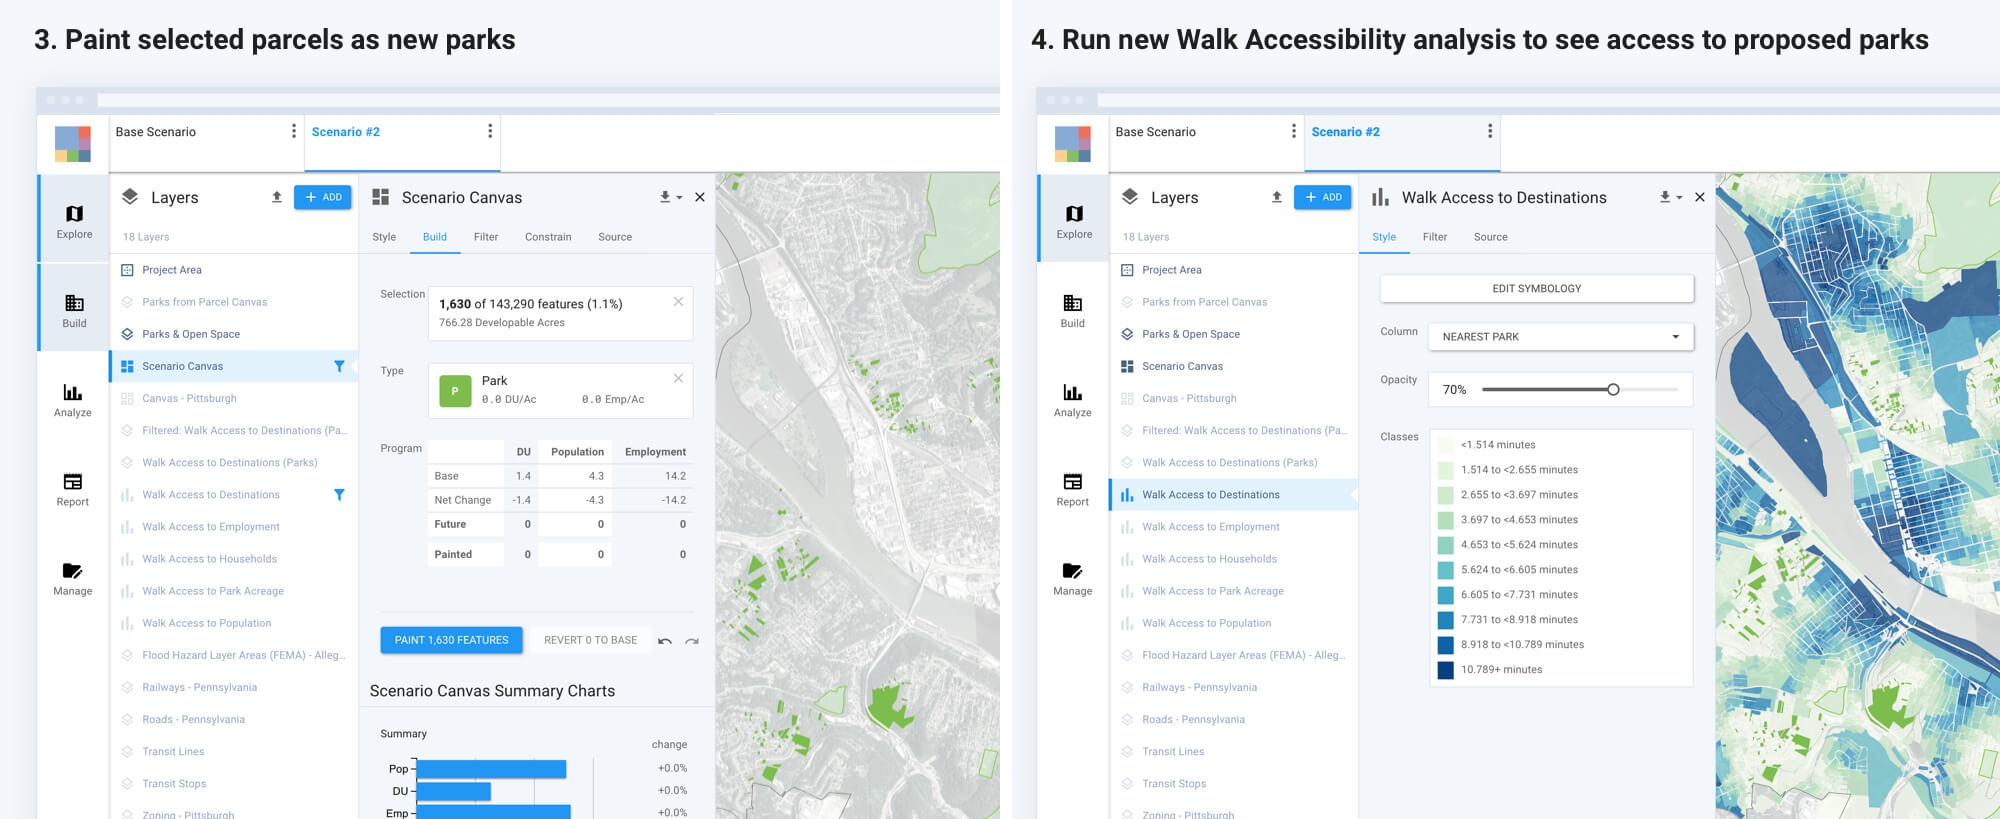
To understand the impacts of different interventions, we can assess the impact of adding new parks or new development around existing parks. For example, a user could test what would happen if the most isolated vacant parcels in a city (e.g. those that are over 20 minutes away from their nearest park) were converted to small parks. It’s easy to select these parcels with built-in filtering tools, and to use UrbanFootprint’s ‘Build’ features to create a scenario and convert selected vacant parcels to new parks. Planners and communities can test as many variations as desired and then run the Walk Accessibility Module on the new scenario(s).
Next, we use UrbanFootprint’s reporting tools to compare and measure scenario performance. We can get a quick take on the potential impact of the new parks program – which in this hypothetical example would increase 10-minute walk access to parks in Pittsburgh from 55% to 86% of all city residents, as shown in the maps below.
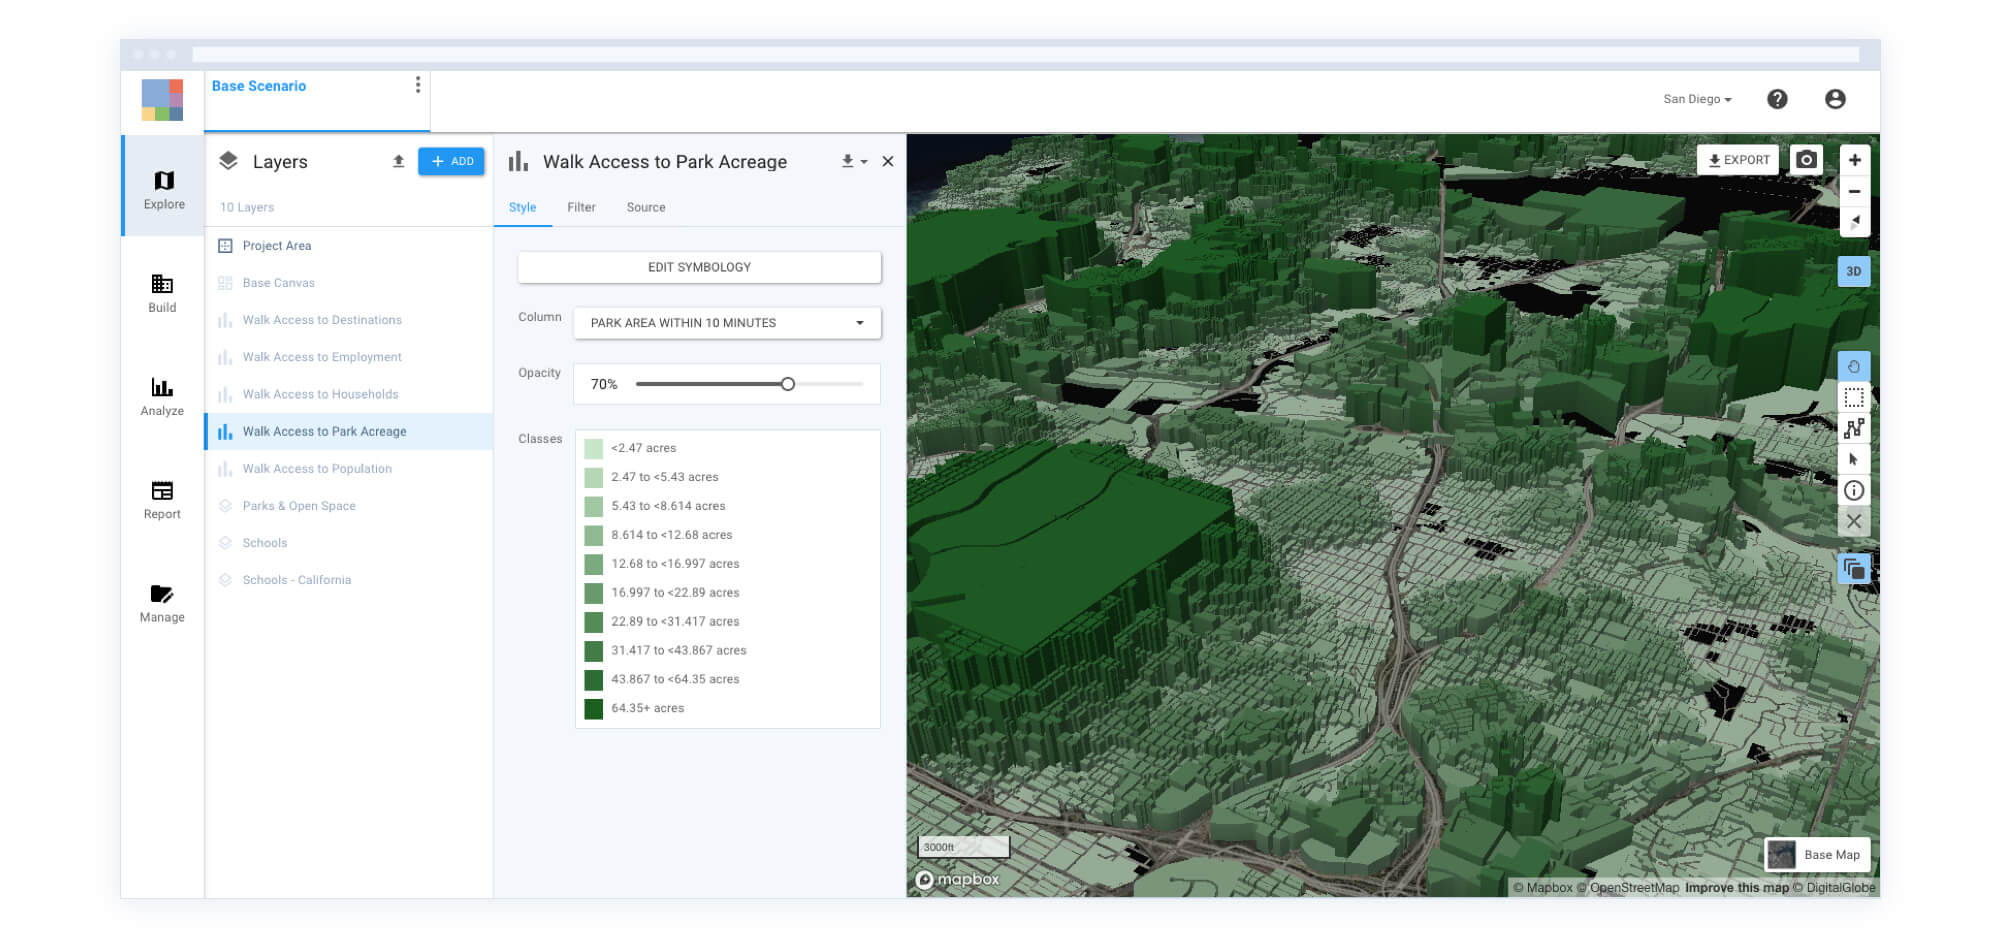
Users can also view parks and open space access in other ways within UrbanFootprint. For example, we can quantify accessible park acreage via walking (or transit) from each parcel.
Explore Additional Walk Accessibility Metrics
UrbanFootprint’s Walk Accessibility Module maps and reports on additional metrics like access to schools, hospitals, employment, retail services, and transit stops. Robust data analysis capabilities make it easy to get quick answers to otherwise complex planning questions.
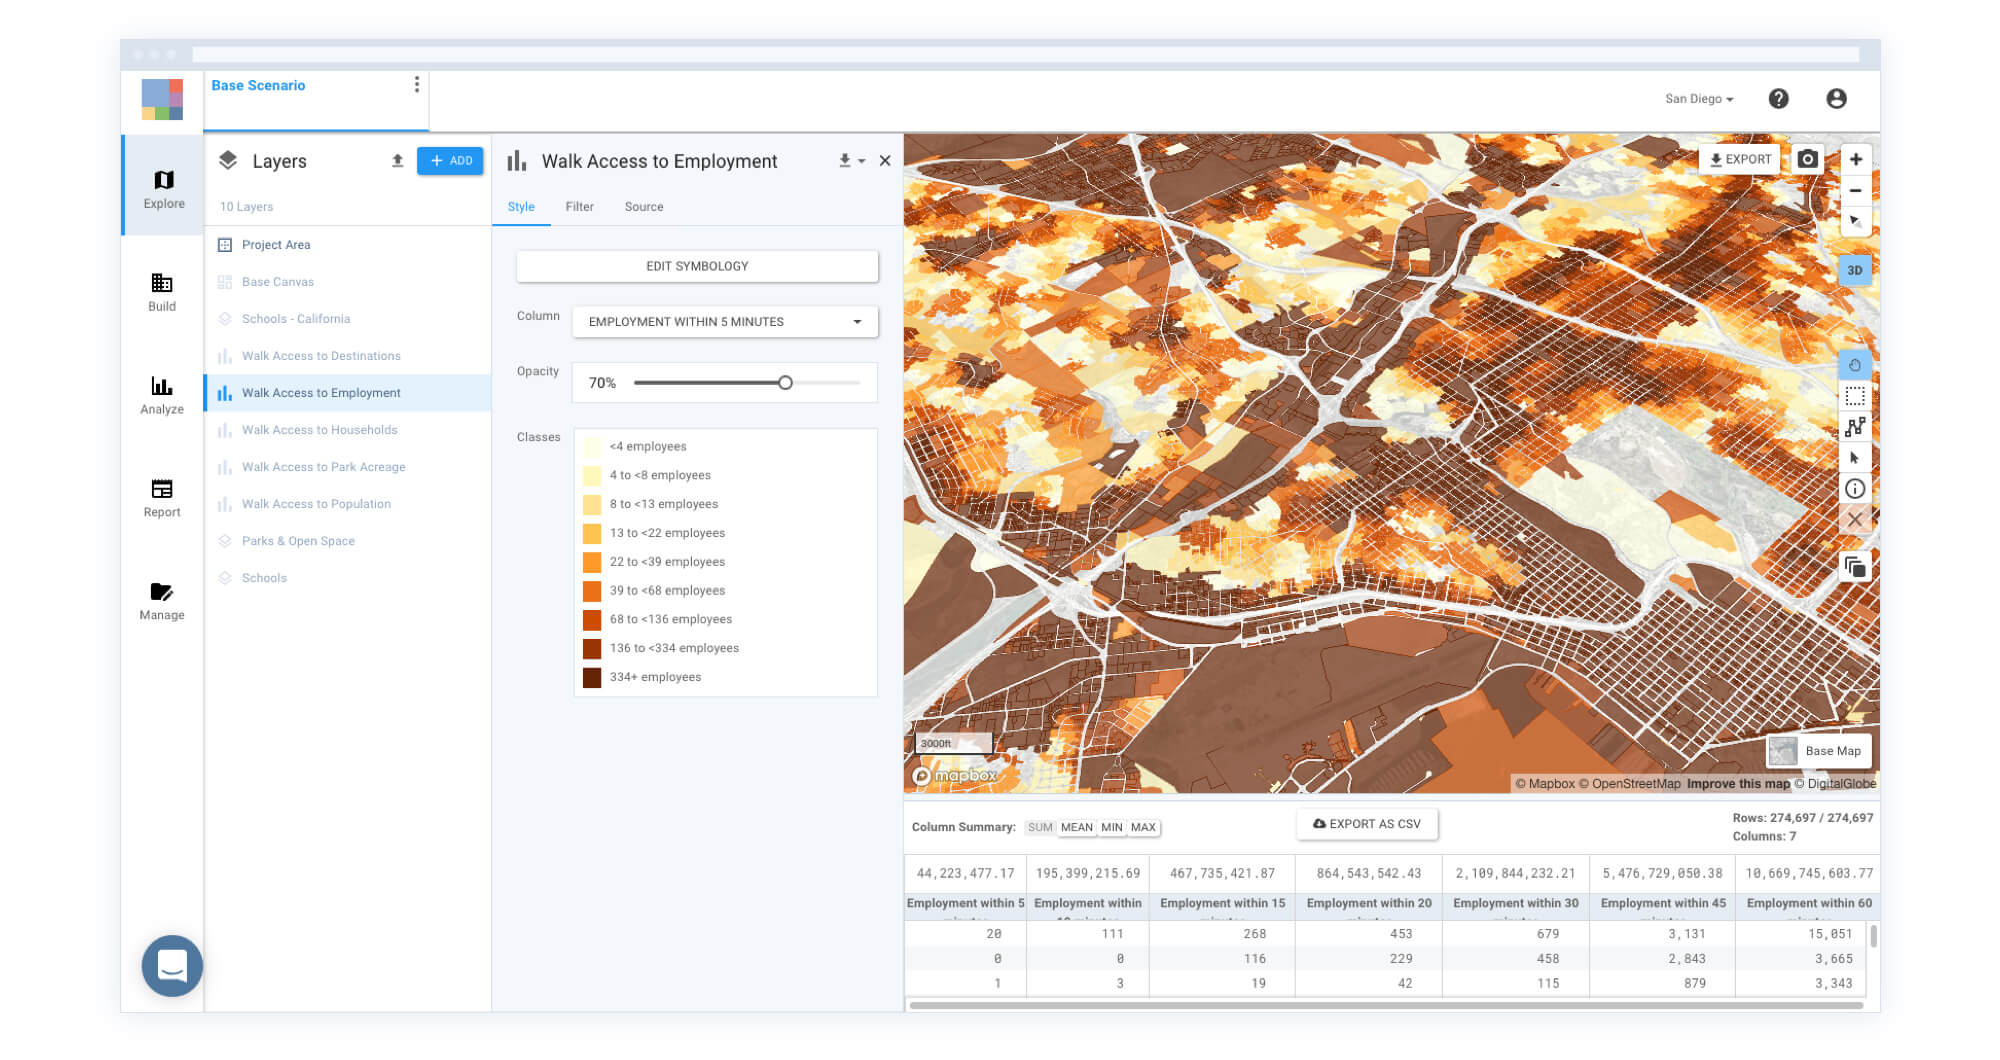
Want to gauge walk accessibility to jobs for your city? Below, we display walk accessibility to jobs in San Diego. Deeper shades of orange indicate areas of higher local employment density.
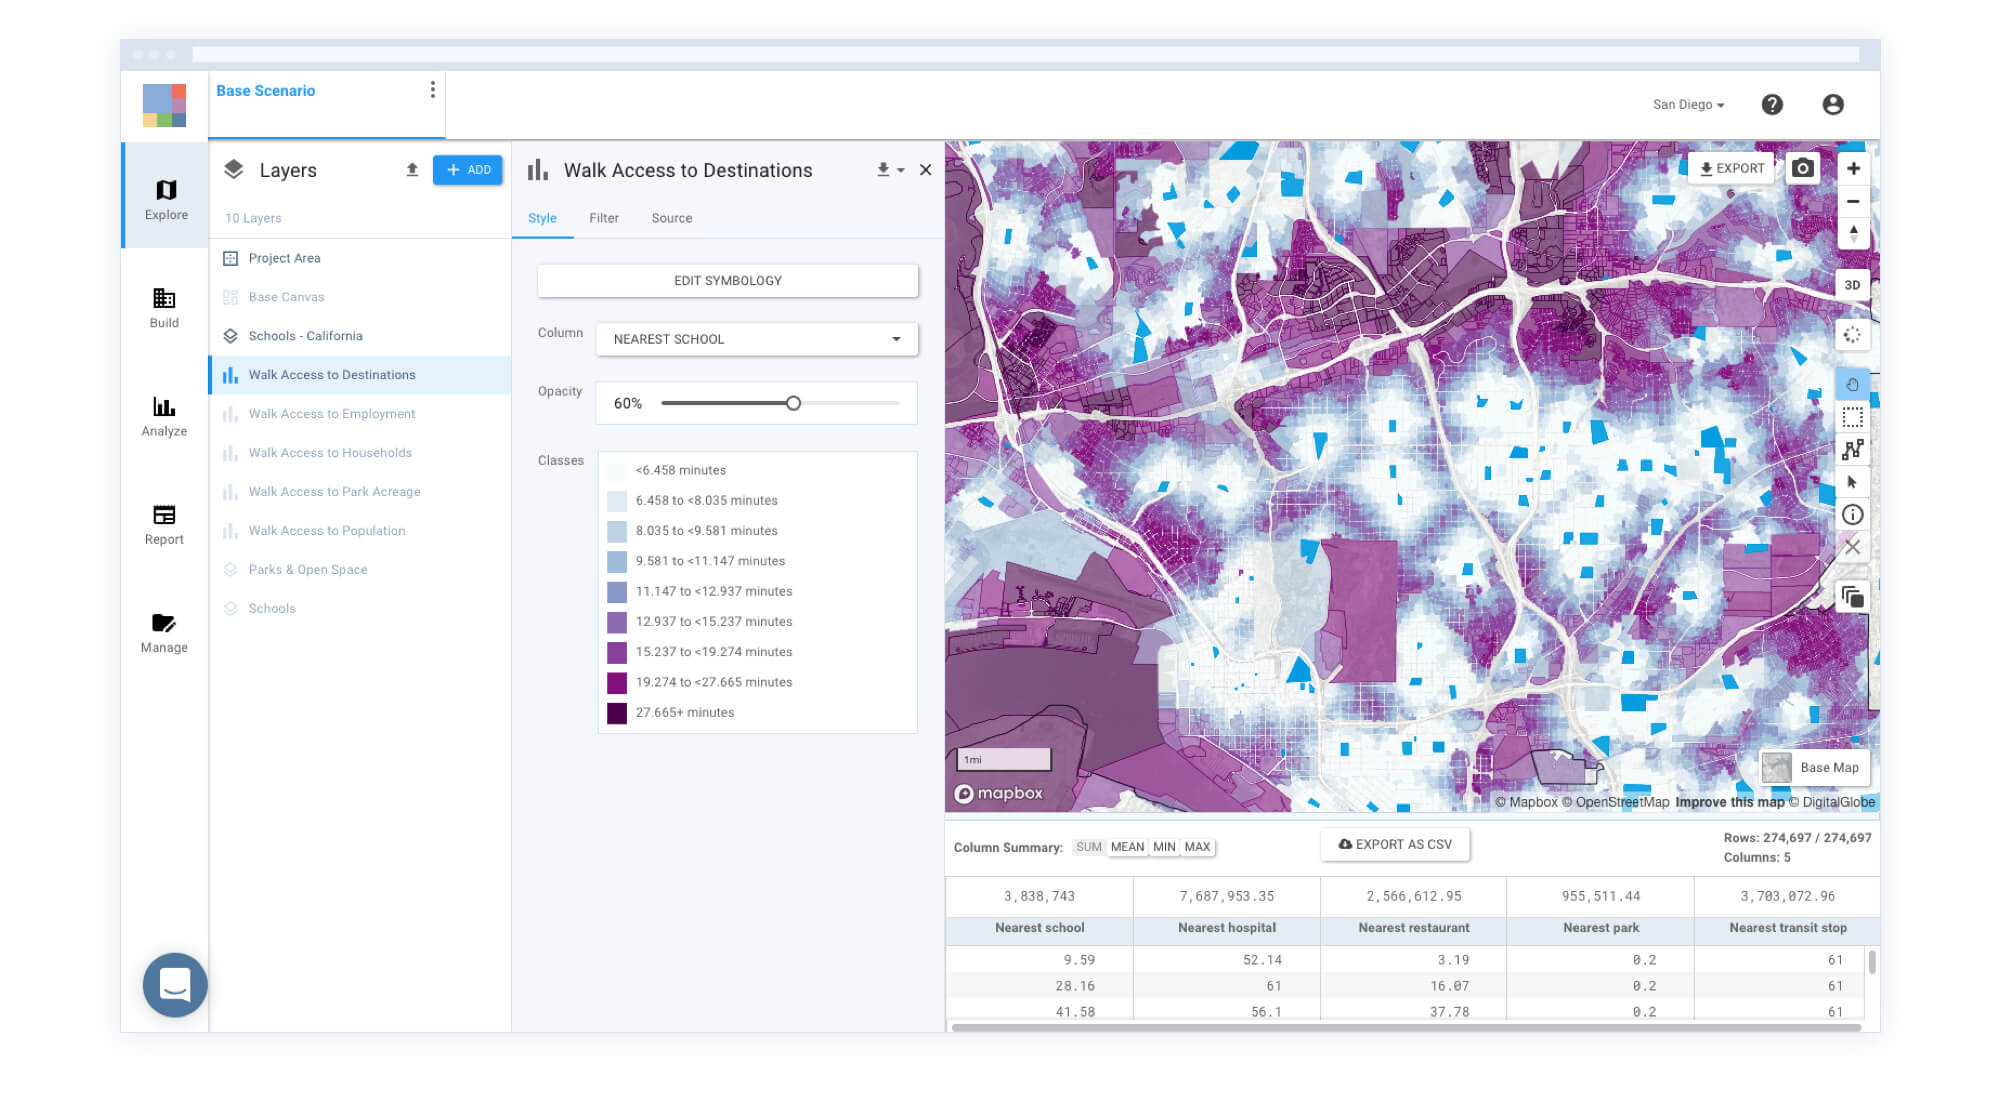
Need to quickly measure impacts on walk access to schools for current and future land use scenario? Below we display walk access to schools for San Diego, where deeper shaders of purple indicate a further walk to the nearest school.
Built to Support Accessible, Healthy Communities
UrbanFootprint supports planners, consultants, and communities with a robust toolkit to enhance walk accessibility to parks nationwide. Equipped with comprehensive data, advanced scenario planning, and a powerful suite of analytics, we aim to help planners and communities elevate the planning conversation and accelerate accessibility improvements es to key destinations like parks, schools, transit stops, hospitals and more.
Ready to learn more about UrbanFootprint? Request a custom demo with our team to get started. In the meantime, we invite you to tweet or email us your thoughts and questions.
