Move faster and build smarter plans.
UrbanFootprint’s suite of analysis modules streamlines every step of your planning process, quickly and efficiently delivering clear, actionable insights for existing conditions, plan alternatives, and policy impacts. Built on trusted national data sources and peer-reviewed methodologies, these modules provide reliable results in minutes and offer the flexibility to adapt assumptions to reflect local conditions.
What Can You Do with UrbanFootprint’s Analysis Modules?
Walk and Bike Accessibility
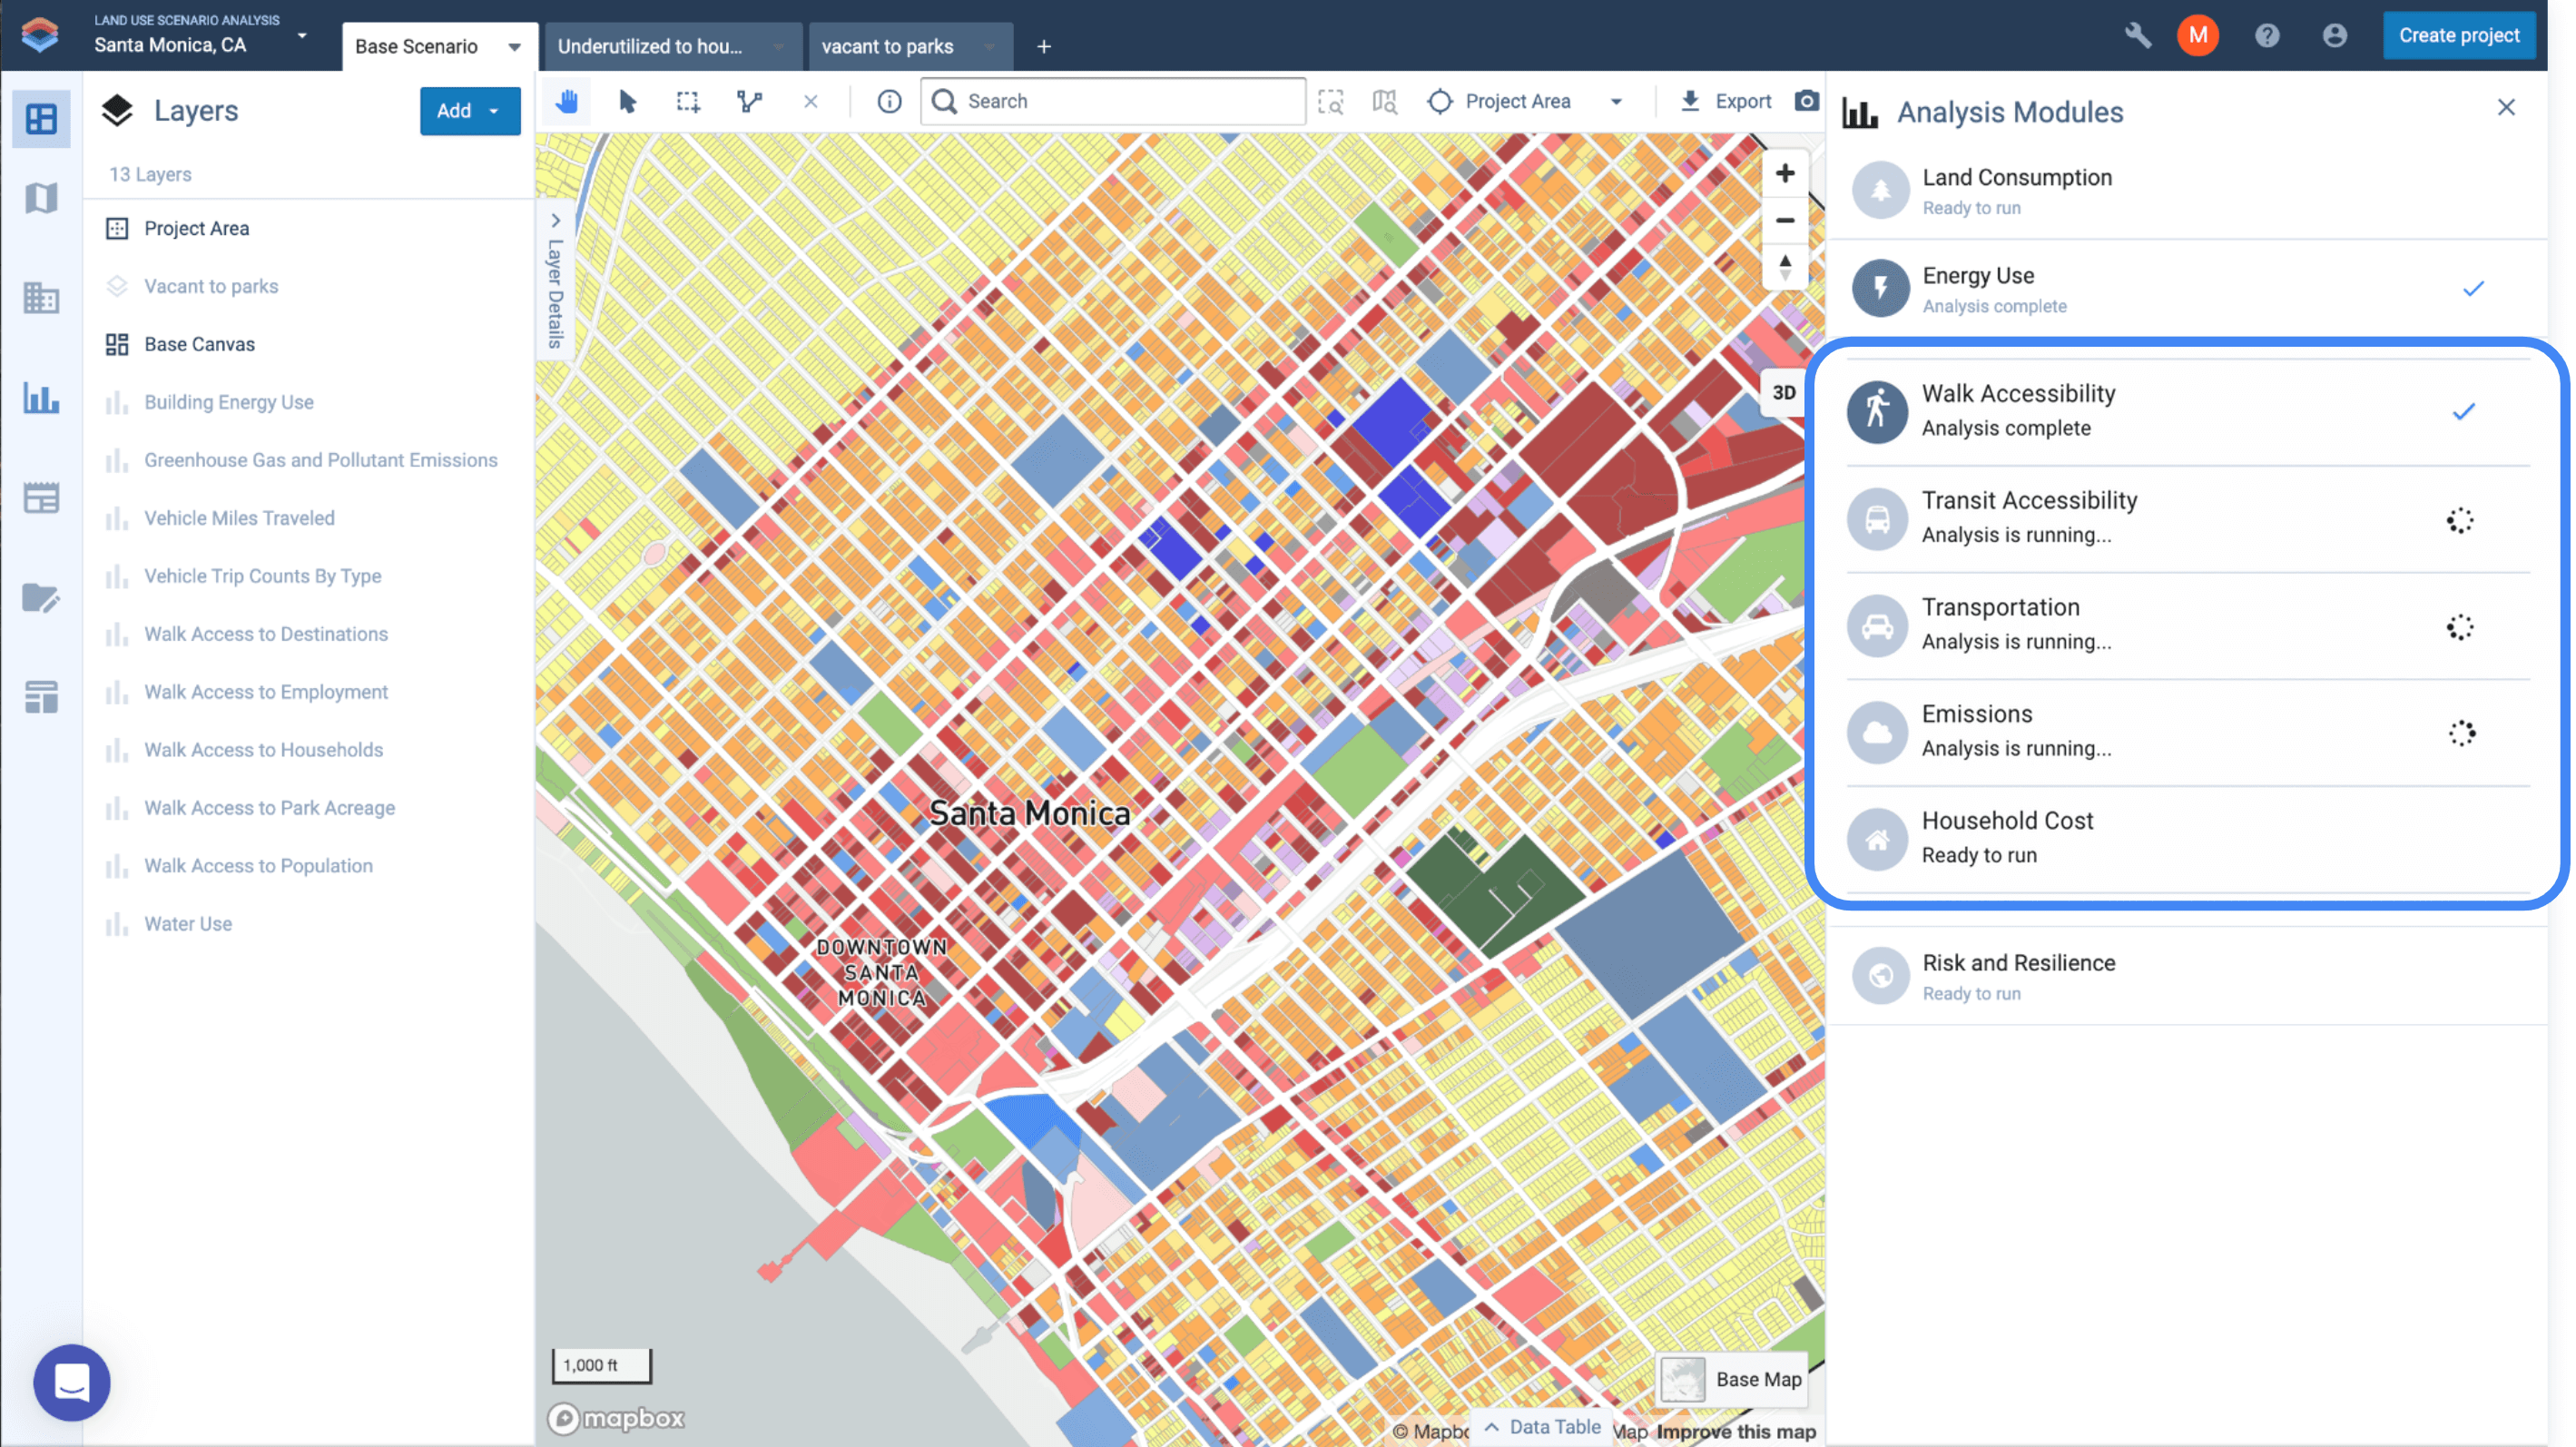
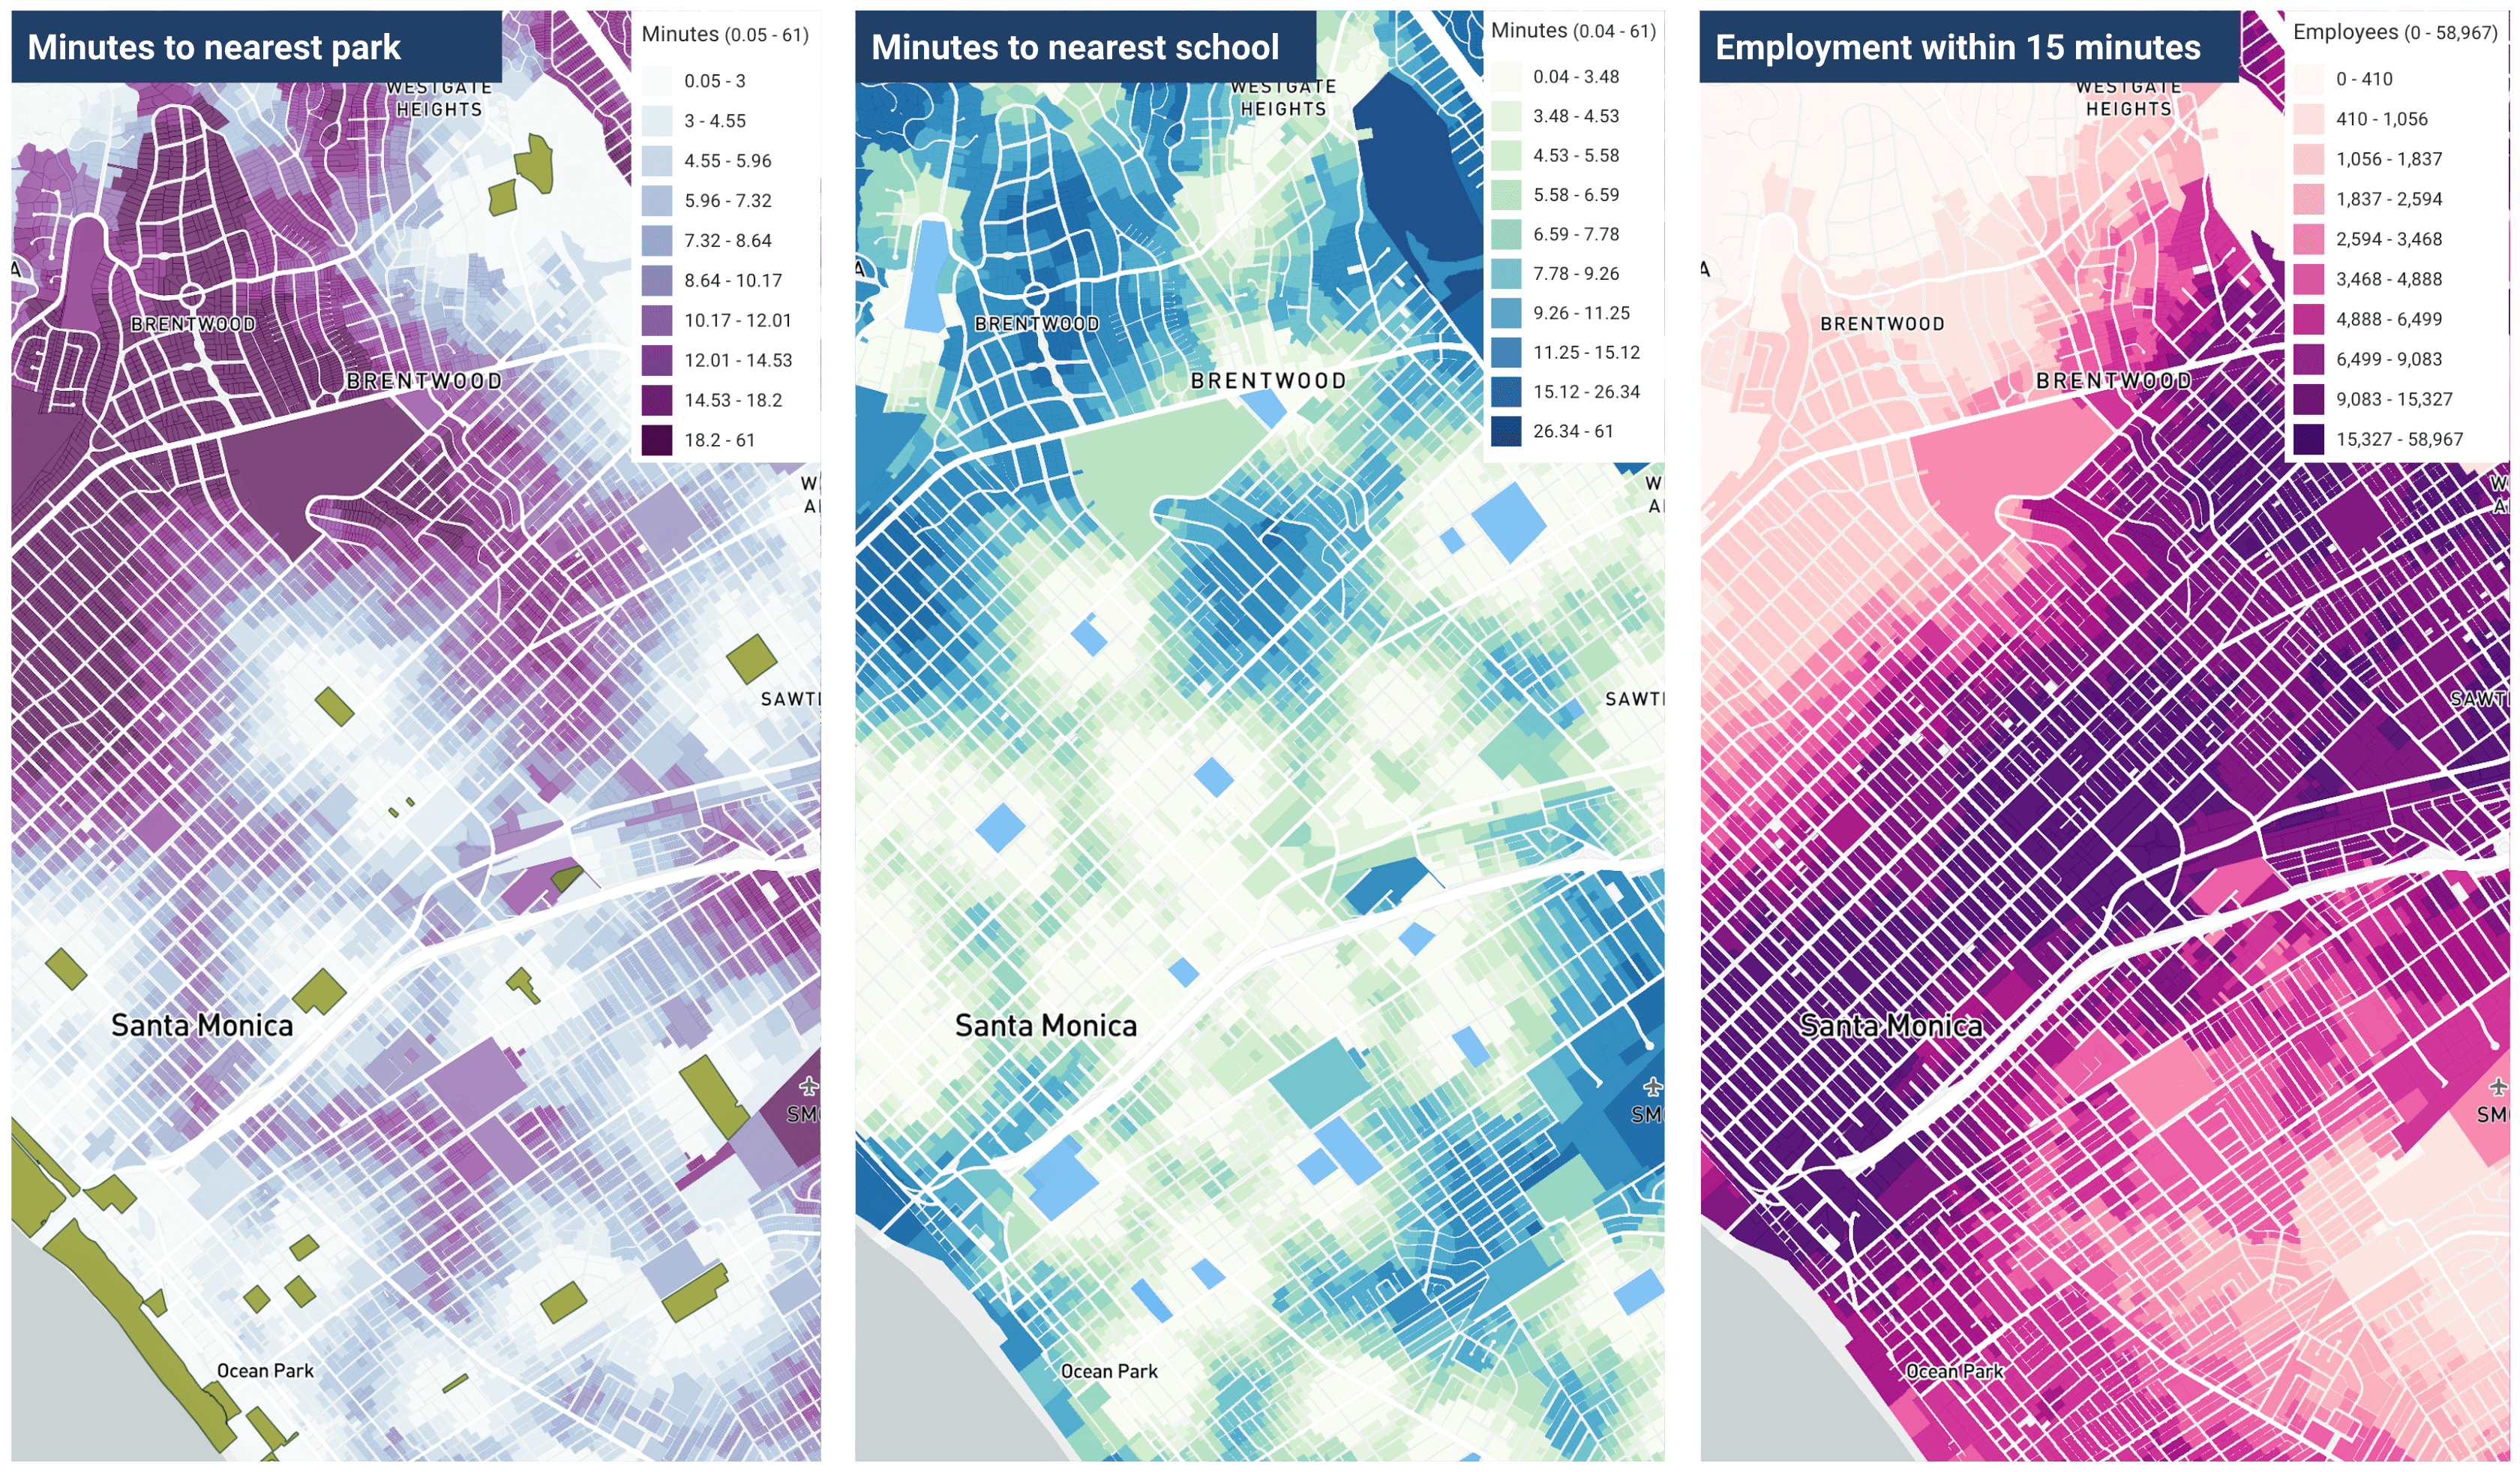
Measure and map walk or bike times to schools, parks, transit stops, retail, or other selected point locations using accurate network-based analysis. Visualize walk sheds, evaluate walkability, and identify areas with poor access to important destinations. Customize the analysis using your own destinations, and adjust travel speed to reflect walking, biking, or other modes.
Transit Accessibility
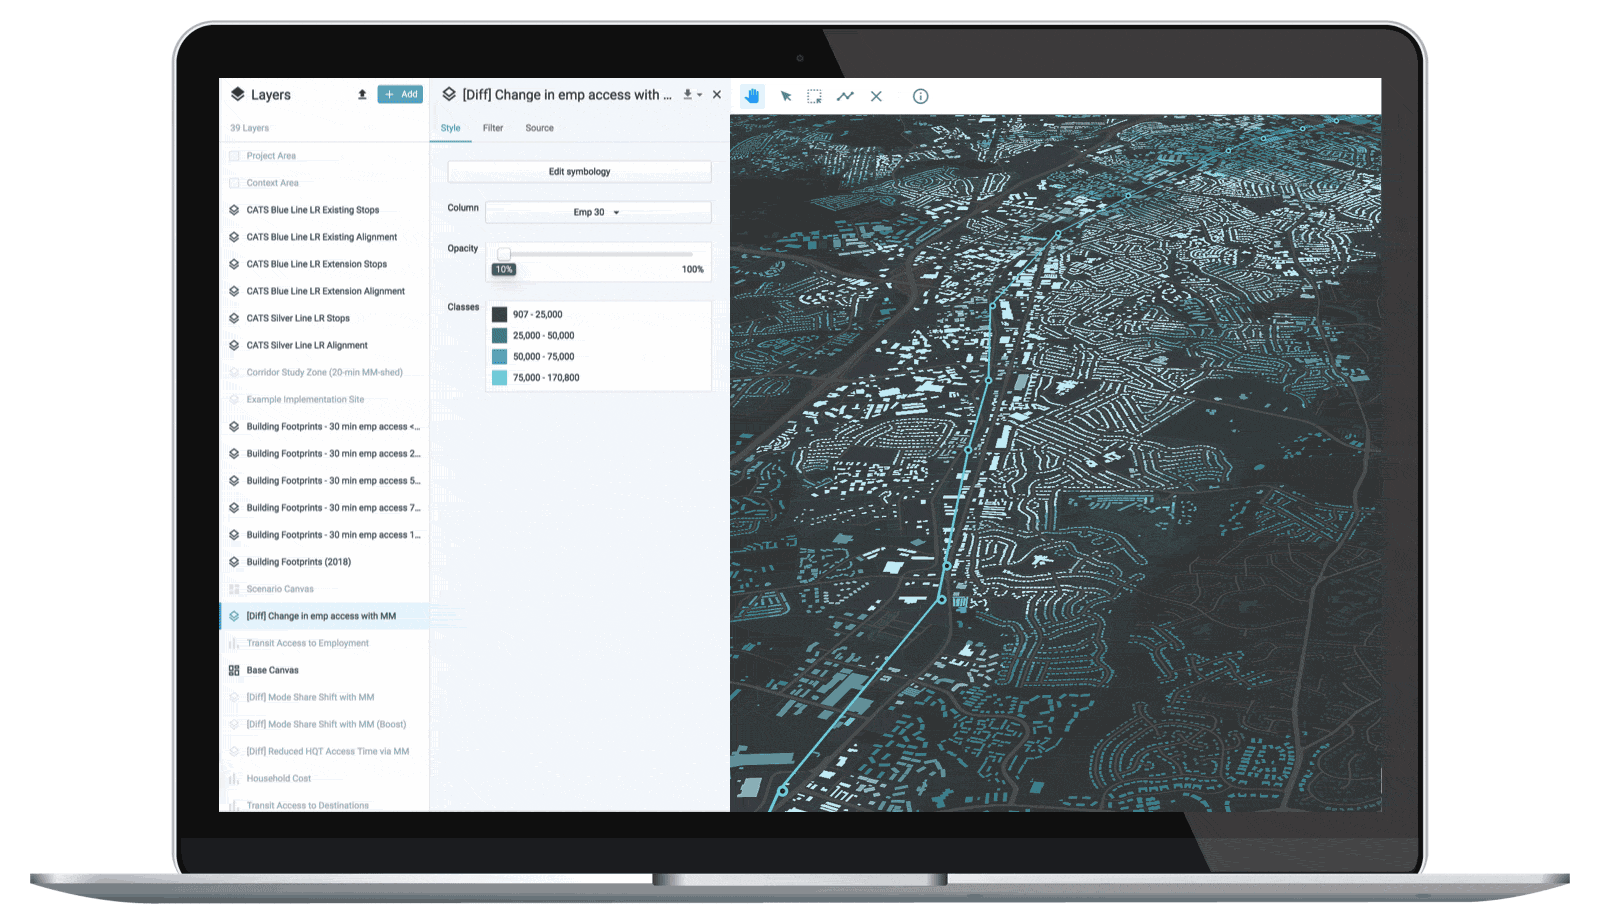
Measure and map transit accessibility and travel times to employment and other key destinations such as schools, hospitals, and parks. Visualize results to assess transit connectivity and identify transit-poor zones. Run analysis on any selection of point locations, from grocery stores to community facilities to planned development sites.
Transportation
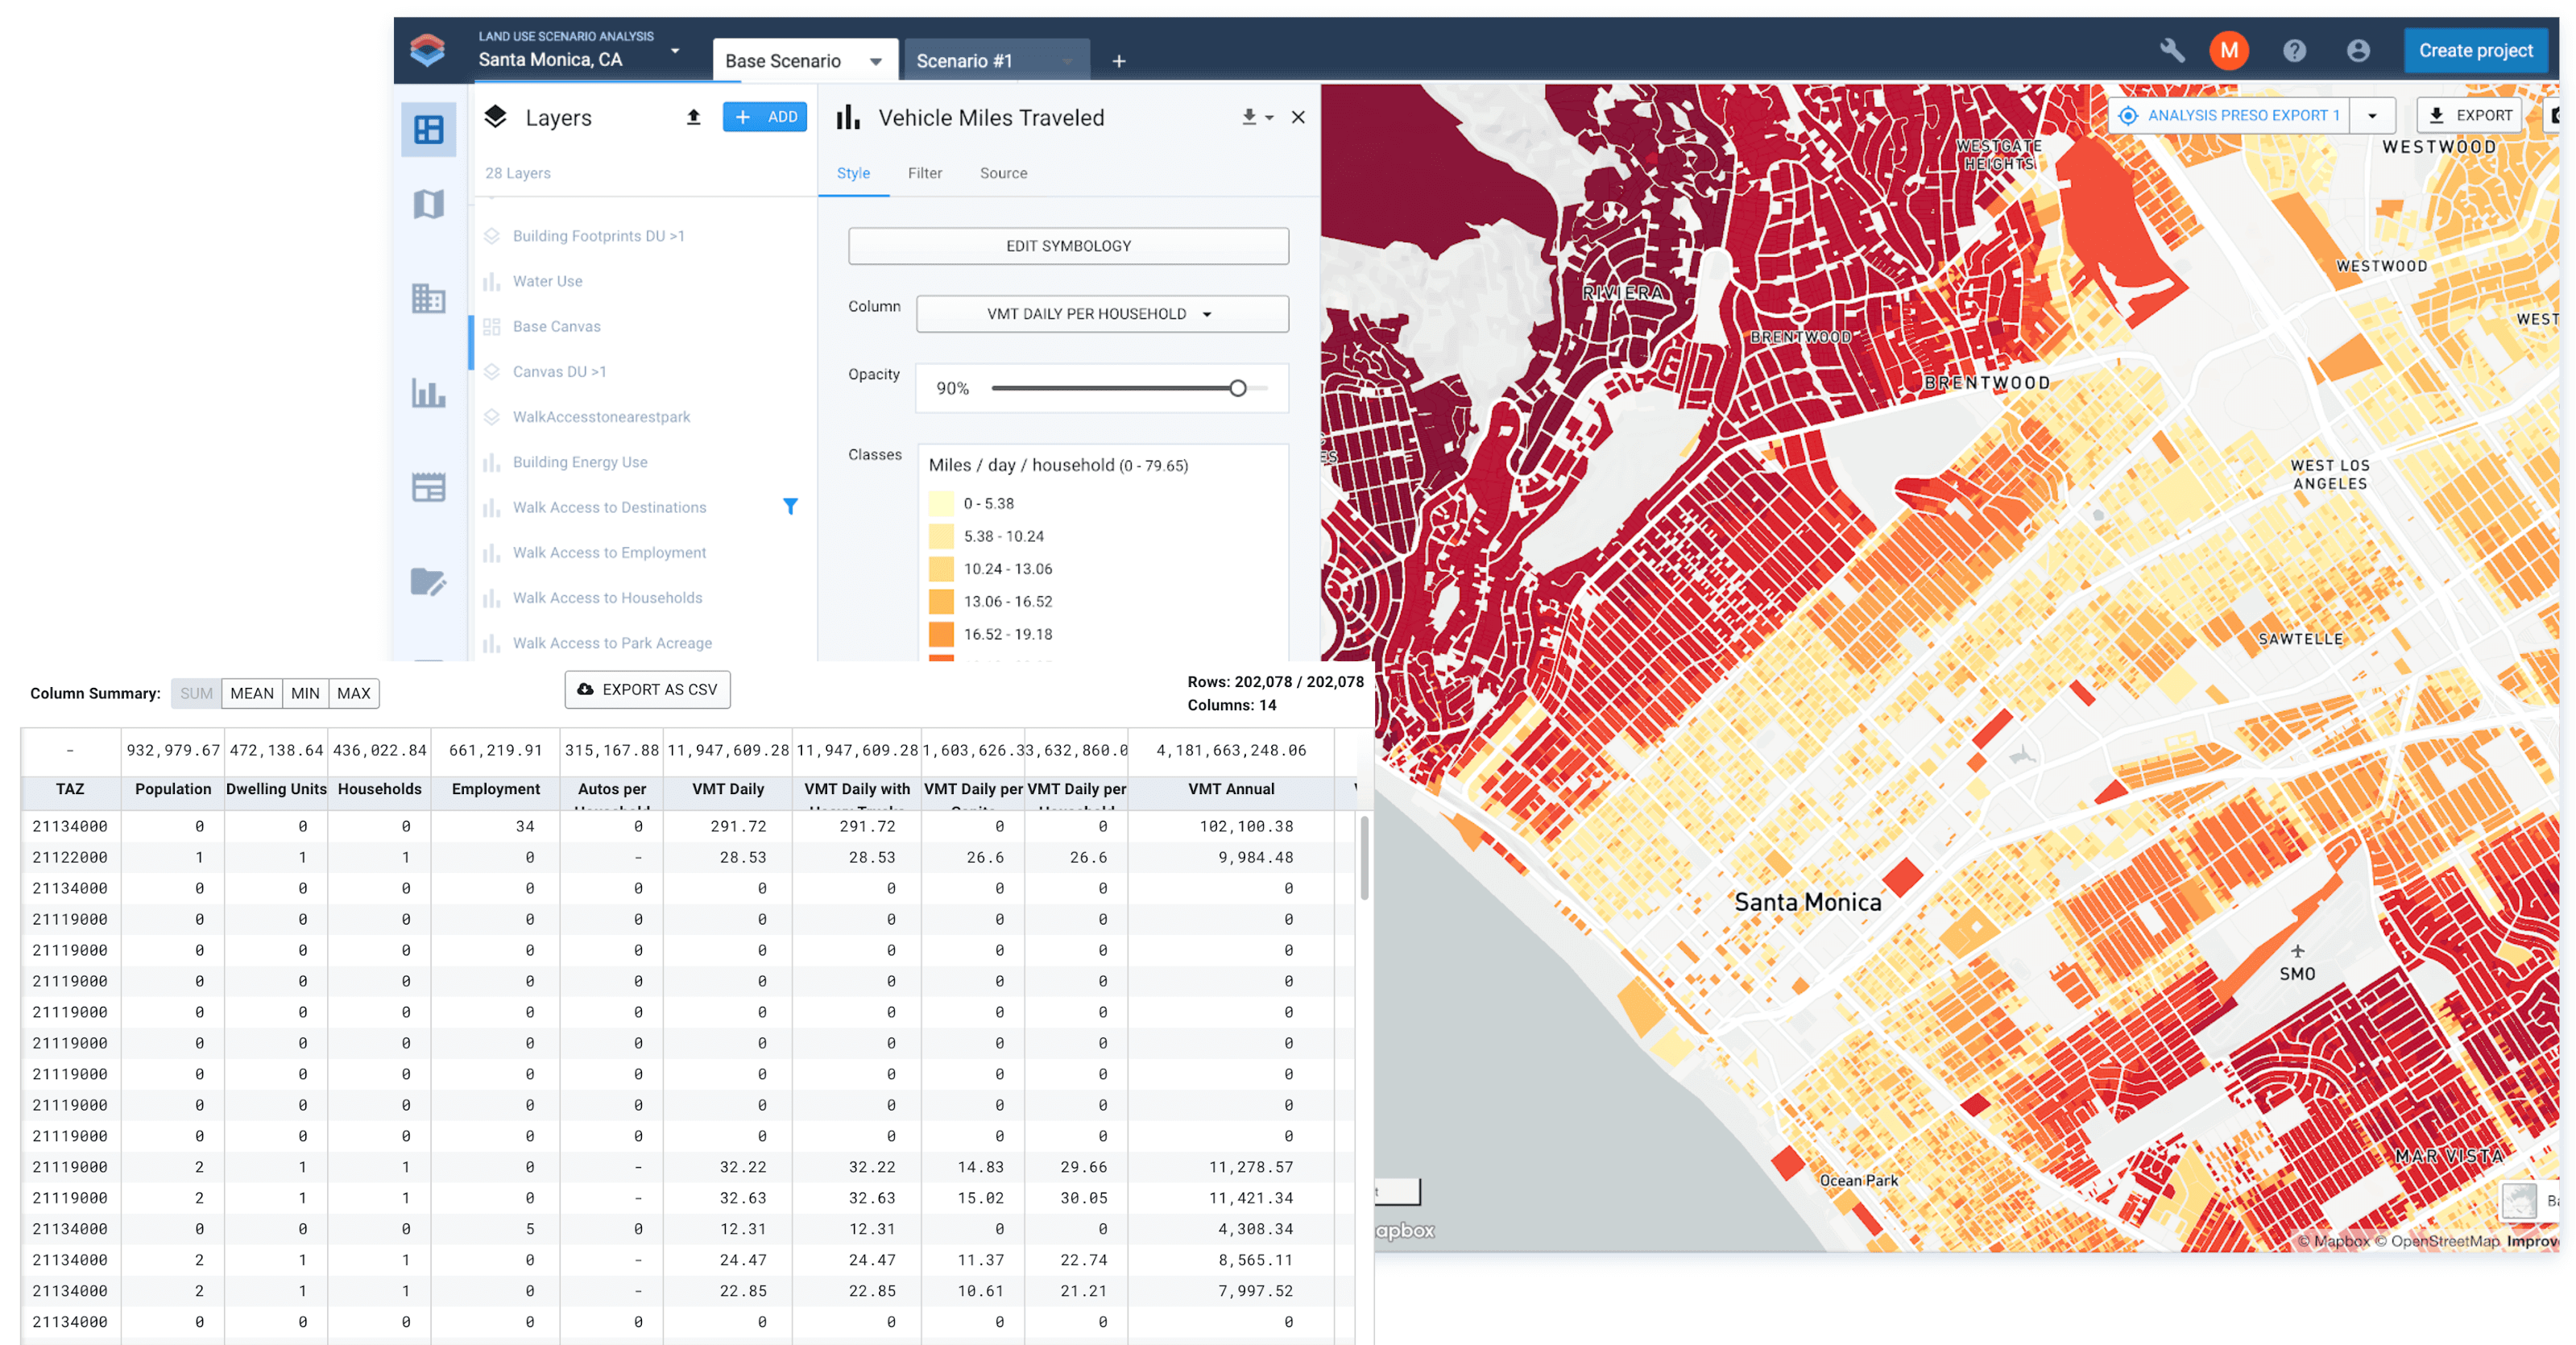
Estimate vehicle miles traveled (VMT) and transportation mode share. Map outputs to compare VMT across neighborhoods or districts, or summarize metrics to compare the impacts of plan alternatives. The Emissions and Household Costs modules measure the related impacts on household transportation costs, greenhouse gas emissions, and pollutant emissions.
Energy Use
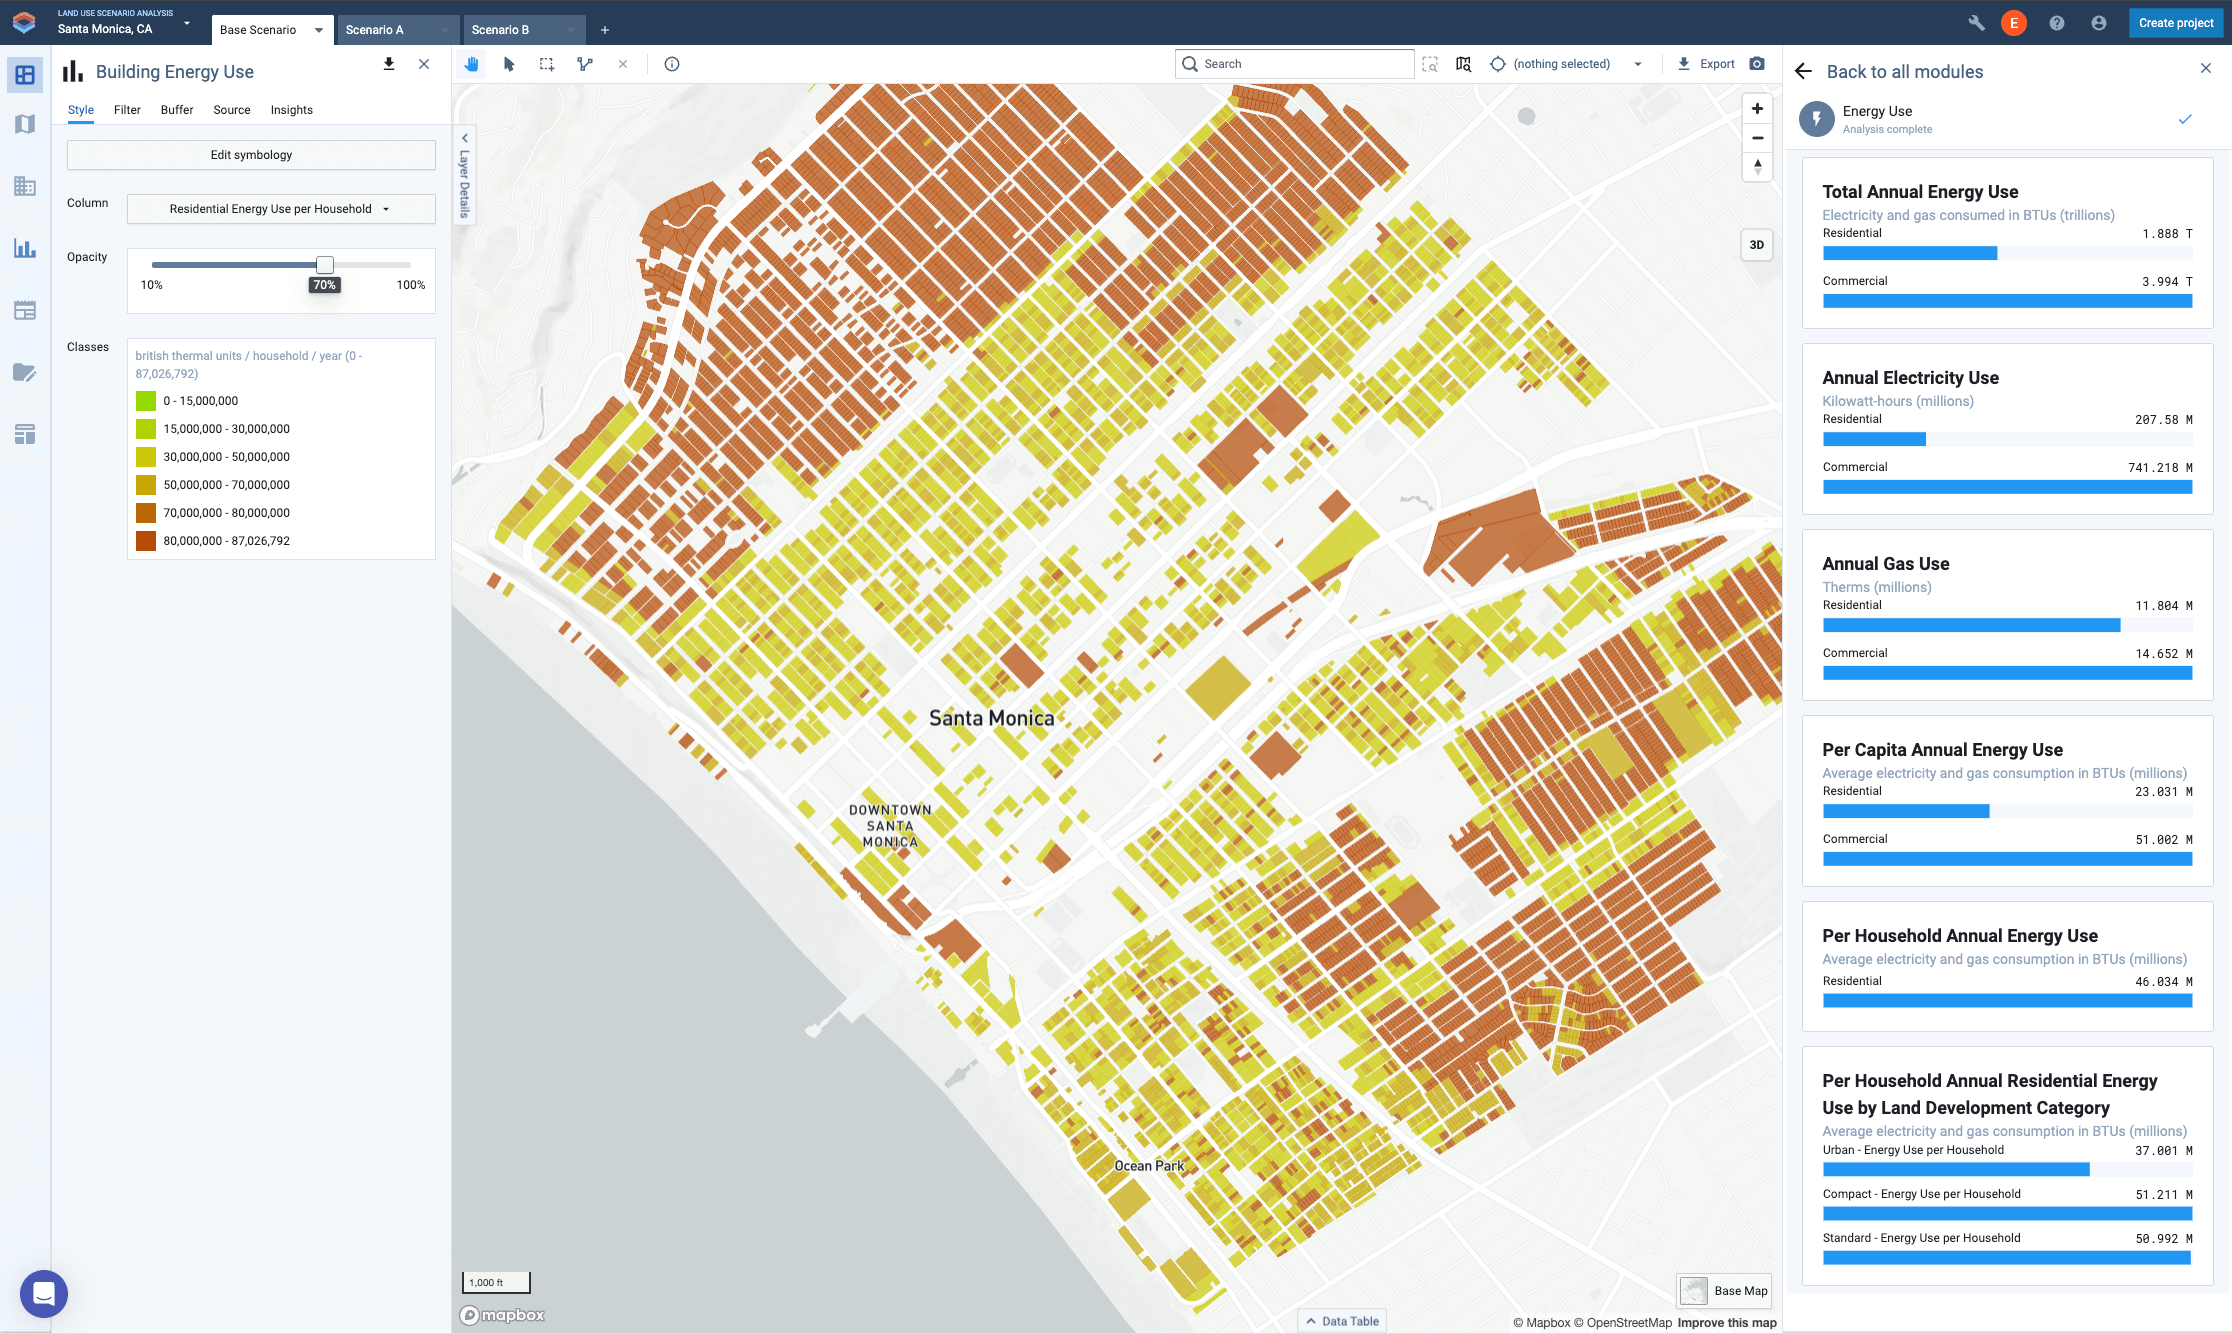
Estimate electricity and natural gas use for residential and commercial buildings at the district, city, or other planning scales. Map outputs to visualize how land use patterns and building types impact energy use. Use the pre-set energy use factors, enter custom factors based on local data, or apply adjustments to test policy scenarios for energy efficiency measures.
Water Use
Estimate indoor and outdoor water use for residential and commercial buildings at the district, city, or other planning scales. Map outputs to visualize how land use patterns and the demand for landscape irrigation affect water use. Use the pre-set default water use rates, enter custom rates based on local data, or apply adjustment factors to test policy scenarios for water conservation or efficiency measures.
Emissions
Evaluate greenhouse gas and air pollutant emissions from passenger vehicles, building energy use, and water use. Use the default fuel economy and emission rates, or adjust them to gauge the effects of policy scenarios for vehicle and energy portfolio improvements.
Household Costs
Estimate household driving and utility expenses for passenger vehicles, building energy use, and water use. Map results to show per-household variations across different locations and land use patterns.
Risk and Resilience
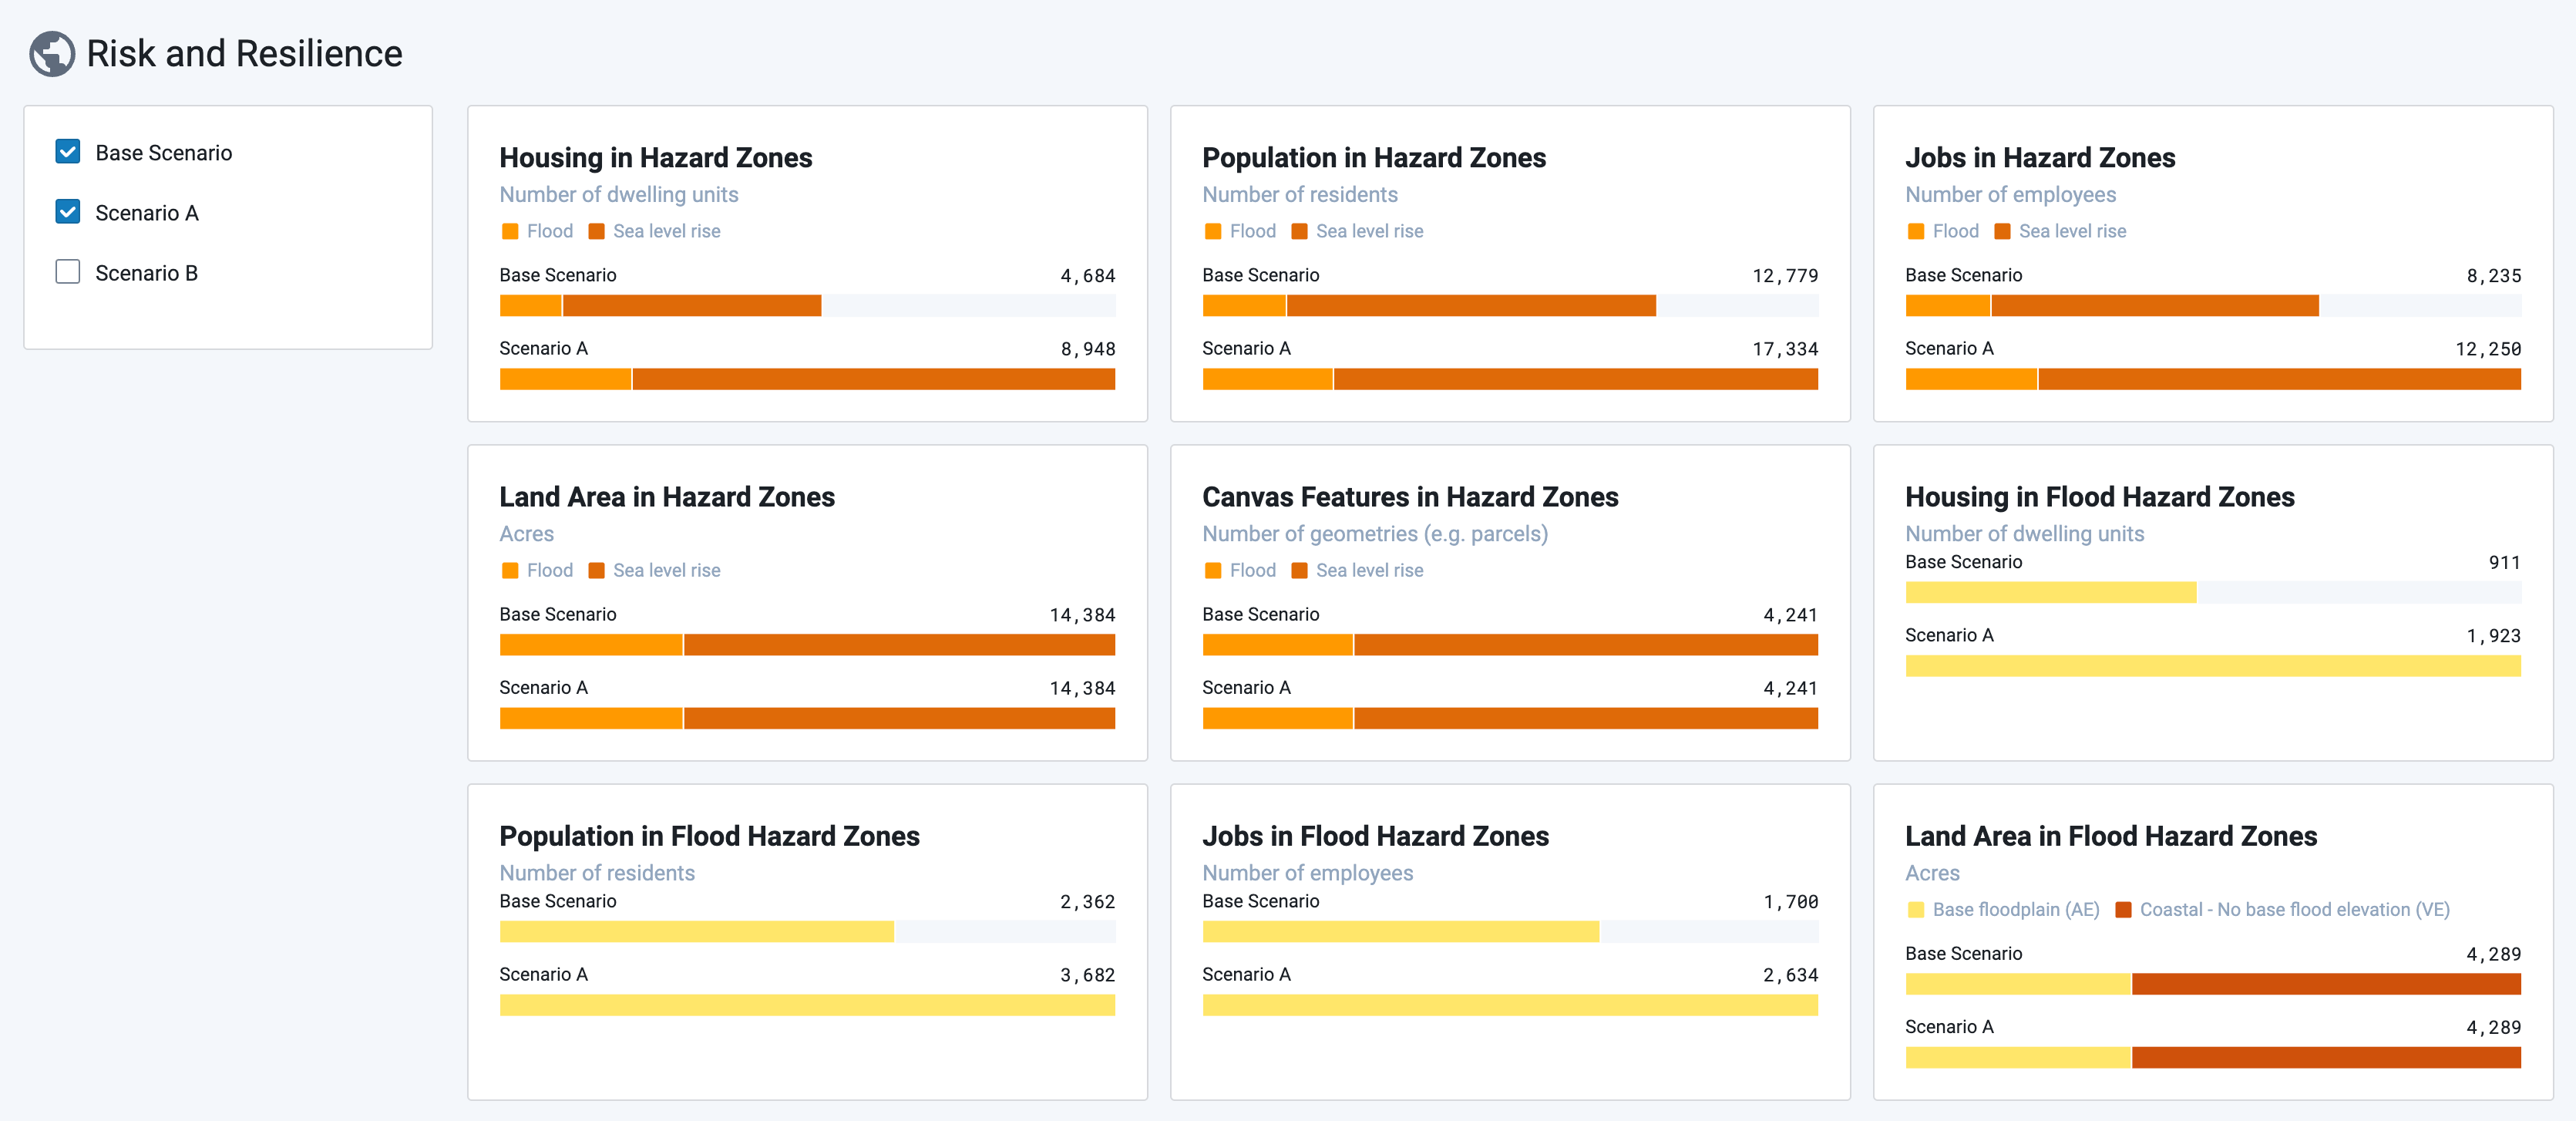
Quickly quantify housing, jobs, and land area at risk in flood, wildfire, and sea level rise zones. Map the results to visualize community risk alongside additional data and metrics from our catalog of curated hazard data.
Land Consumption
Measure how much land is consumed in varying growth scenarios and plan alternatives. Report on infill or redevelopment in already urbanized areas versus development on vacant, agriculture, woodland, and other greenfield lands.
Conservation
Measure the environmental impacts of land use change on a range of existing natural and agricultural resources. Report on water quality, habitat preservation, agricultural factors, and carbon sequestration and storage impacts. This module was developed in collaboration with The Nature Conservancy, and is available for analysis in California only.
Why These Modules Matter
For Existing Conditions
Get more informed, faster. Save time, reduce costs, and bring high-impact existing conditions analysis to any project, proposal, or stakeholder process. Push-button models deliver walk and transit access, transportation and emissions metrics, building energy and water use, and hazard risk analysis in a matter of minutes.
For Scenarios and Plan Alternatives
Compare land use alternatives to evaluate costs, resource use, climate risk, and land consumption. Iterate faster, evaluate deeper, and bring more compelling analysis to the public and stakeholders.
For Policy Analysis and Development
Quantify the effects of policies and interventions on accessibility, carbon emissions and pollution, household costs, and more. Use pre-set model parameters to move fast, and customize assumptions to test local policy options.
Discover the Power of Push-Button Insights
UrbanFootprint’s analysis modules are designed to save you time and deliver actionable results. They’re already in your UrbanFootprint toolkit—ready to transform your workflow and enhance your projects.
Ready to see them in action? Log in to UrbanFootprint or schedule a demo to explore how these tools can transform your workflow.
