


Introduction
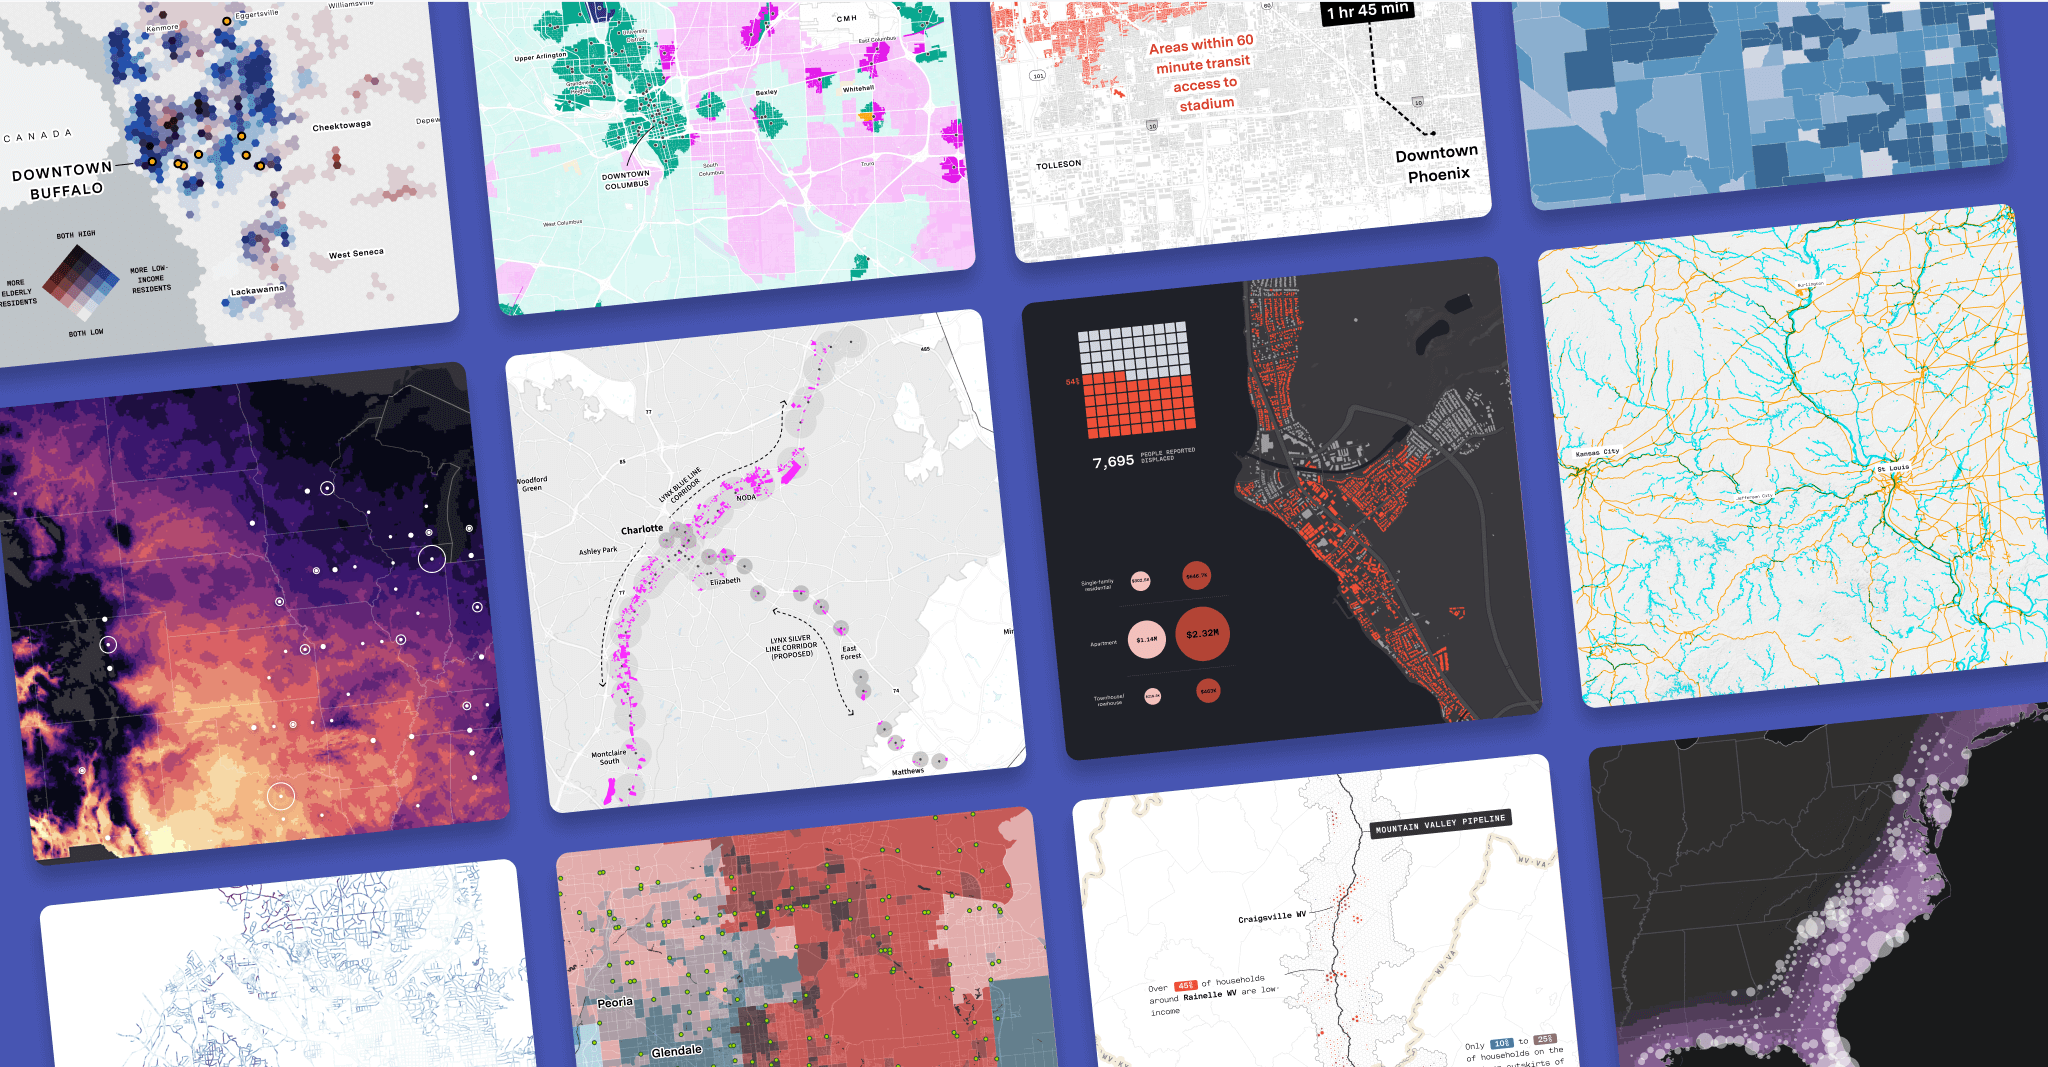
Each month, the UrbanFootprint team creates and shares a map featuring an interesting data discovery using our platform. Take a look at our previous Maps of the Month to see our Resilience Insights in action.
2024
January
Revealing hurricane vulnerabilities in Jacksonville, Florida
Jacksonville is one of America’s fastest growing cities. As we witness a trend of people moving into areas prone to extreme weather, we’ve taken a deeper dive into the hurricane risk that this booming city faces. We didn’t just look at the big picture; we zoomed down to the parcel level, combining our climate data, built environment characteristics, and community insights.


Key Takeaways
- Jacksonville is projected to grow by 53% by 2060.
- Analyzing risk at the parcel level and linking it to assessment value is beneficial to private sector businesses like property insurers and financial guarantors who need to look at site-specific risk through a financial lens. Staying informed about evolving risk landscapes is crucial for insurers to develop accurate risk models, set appropriate premiums, and prepare for potential claims.
- Step 1: During Hurricane Irma, 68.79% of claims were residential. That’s why we started our analysis by filtering down to residential areas, and visualizing the threat of category 3+ hurricane winds to homes.
- Step 2: Homes built before 2001 are likely at higher-risk, so we continue by filtering to show only these homes, and how their property value is distributed throughout the city.
- Step 3: Elderly people are more likely to struggle with evacuation and face heightened health risks, like injuries and disrupted medical care, during and after hurricanes. Over 90% of storm-related deaths in the past 32 years have happened in impoverished or disadvantaged communities. We’ve pinpointed where high concentrations of these socially vulnerable populations are also living in homes that are also at higher-risk of hurricane winds.
2023
December
A record-breaking year for billion-dollar climate and weather disasters
2023 saw a surge in billion-dollar climate and weather disasters, setting a new record at 25, surpassing the previous high of 22 in 2020. The average since 1980? Just 8.
What does this mean for 2024 and beyond? We took a look at the current and future risk of extreme heat, hurricanes, and severe storms, and how these risks correlate with domestic migration trends.
Key Takeaways
- Migration Trends – As extreme weather events become more frequent, domestic in-migration trends indicate the potential for an even greater surge in large-scale climate disasters. U.S. Census data shows a concerning pattern of people moving to high-risk areas for extreme weather. Even those escaping one type of climate risk often move to another type of risk zone.
- ️Extreme Heat – 12.8% of the population is currently at risk of extreme heat. This is set to more than double to 30.5% by 2060.
- Hurricane Winds – Currently, 4.2% of property value is at risk nationwide, projected to increase by 50% to 6.3% by 2060. The population at risk climbs by 20%, from 4.3% to 5.1%.
- Severe Storms – The risk of precipitation from severe storms is expected to increase from affecting 5.7% of the population and 4.2% of the nationwide property value to 7.8% and 7.7%, respectively, representing a significant 36% and 83% increase by 2060.
Local governments, utilities, insurers, and businesses will all have to grapple with the shifting nature of community and economic risk associated with climate events. With comprehensive data on climate, community, and the build environment, decision makers can optimize investments and interventions.
November
Hidden flood risk in the U.S.
Did you know that approximately 40% of the contiguous U.S. land area lacks flood risk data from FEMA? And that’s a big problem. Between 2017-2019, 40% of National Flood Insurance Program (NFIP) claims came from non-official flood hazard zones. With many insurance providers retreating from high-risk areas, full data coverage isn’t just valuable – it’s essential.


Key Takeaways
- We’ve mapped out areas across the U.S. where hidden flood risks exists beyond FEMA’s data. Discover the places you never knew were at risk.
- By the numbers – see how our data brings to light additional at-risk people, property values, and parcels not covered by FEMA.
- A side-by-side comparison of FEMA vs. our flood data. The difference is striking!
- Spotlight on the top 5 counties with the highest percentage of unidentified risk according to our analysis.
- A close-up on the Duluth, MN area. See how combining our data with FEMA’s provides a more comprehensive view of critical infrastructure and populations at risk – helping to build resilience.
October
The impact of extreme heat on data centers in the U.S.
We took a look at the convergence of the AI boom and future extreme heat—and the impact these will have on the energy consumption and costs of data centers.


Key Takeaways
- AI may soon require as much energy as entire countries. Projections show that by 2030, AI could account for 4% of global power demand!
- The rise in temperature will amplify the energy needs of data centers. But where will the impact be greatest? Cities like Dallas and Phoenix will likely see a huge increase in electricity consumption from extreme heat alone.
- Did you know? Siting data centers is no simple task. In addition to considerations like natural disaster risk and the existence of support infrastructure, industry standards recommend best practices for data center placement in relation to built environment characteristics such as airports, industrial facilities, landfills, railroads, and rivers – that can limit options.
September
The impact of the Lahaina wildfires
We took a detailed look at the devastating wildfires in Lahaina, Hawaii, focusing not just on the damage but also on profound economic implications for the community.


Key Takeaways
- The data highlights that the path to restoring normalcy for Lahaina’s families is steep and multifaceted.
- There is a staggering disparity between assessed value and estimated rebuild cost of the affected parcels.
- Further compounding the problem is the huge impact that the fires have had on local jobs.
To truly make these families whole again, a combination of support systems is essential. This includes insurance payouts, FEMA funding, the tireless work of relief organizations, and donations from the public.
August
Where does hunger meet extreme heat in Phoenix?
Inspired by an Axios article that shed light on the direct impact of extreme heat on those facing food insecurity – we used our intersectional approach to pinpoint where interventions may be needed in one of the hottest cities in the country.


Key Takeaway
High-quality foods, especially fruits & veggies, contain more water to help combat dehydration – so access to affordable, healthy food is critical during sweltering temperatures. While convenience stores may serve some immediate needs, their higher costs and limited fresh produce options further compound the problem.
July
Tree fall risk to powerlines in Atlanta, Georgia
As we continue to confront the realities of climate change and extreme temperatures, avoiding power outages is becoming increasingly critical, and challenging. Falling trees are one of the most common causes of power outages.
This series of maps illustrates our methodology for calculating tree fall risk to power lines in Atlanta – a city that had recently been impacted by power outages due to storms and falling trees.


Key Takeaway
Identifying where the risk is greatest enables utilities to strategically and proactively protect our infrastructure to keep the power on.
June
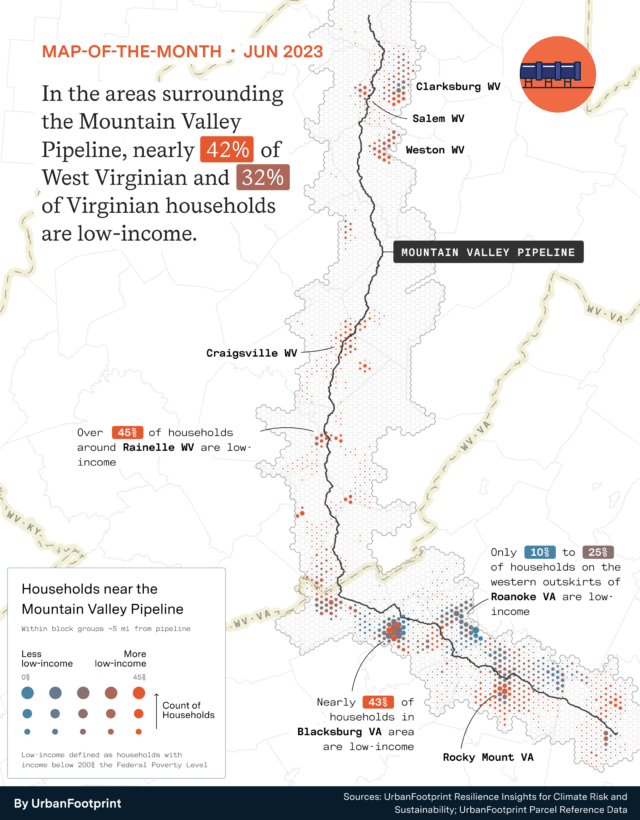
Economic impacts of the Mountain Valley Pipeline
We took a look at the Mountain Valley Pipeline and the surrounding area to assess some of it’s potential impacts. A significant proportion of the households in close proximity to the pipeline in both Virginia and West Virginia are low-income, and are likely more vulnerable to the environmental and economic impacts of the pipeline.
Key Takeaways
- In the areas surrounding the Mountain Valley Pipeline, nearly 42% of West Virginian and 32% of Virginian households are low-income.
- By understanding the relationship between infrastructure and the community, we can start to make better, more equitable and resilient decisions.
To learn more about the economic impact of the Mountain Valley Pipeline, see this article from the Charleston Gazette-Mail. We’re happy we could support with some of our findings!
May
Transit-oriented development – the key to solving the housing crisis?
How can we simultaneously address the housing crisis AND fight climate change? As RMI’s Land Use Reform report suggests, one way is by redeveloping parcels of land near transit stops to allow for high-density housing and mixed-use development. We took a closer look at the potential impact of a Transit-Oriented Development (TOD) approach.


Key Takeaway
A Transit-Oriented Development (TOD) approach could create hundreds of thousands of new housing units in Austin, Charlotte, and Denver – all while significantly reducing greenhouse gas emissions and vehicle miles traveled (VMT).
April
Where major rail routes and waterways coincide in the U.S.
Did you know that waterways and railroads often coincide? With recent incidents like the East Palestine train derailment, it’s more important than ever to understand the impact of our infrastructure on critical sources of water for drinking and recreation.


Key Takeaway
These maps highlight the overlap and serve as a reminder of how important it is to invest in infrastructure to prevent future incidents and protect our environment.
March
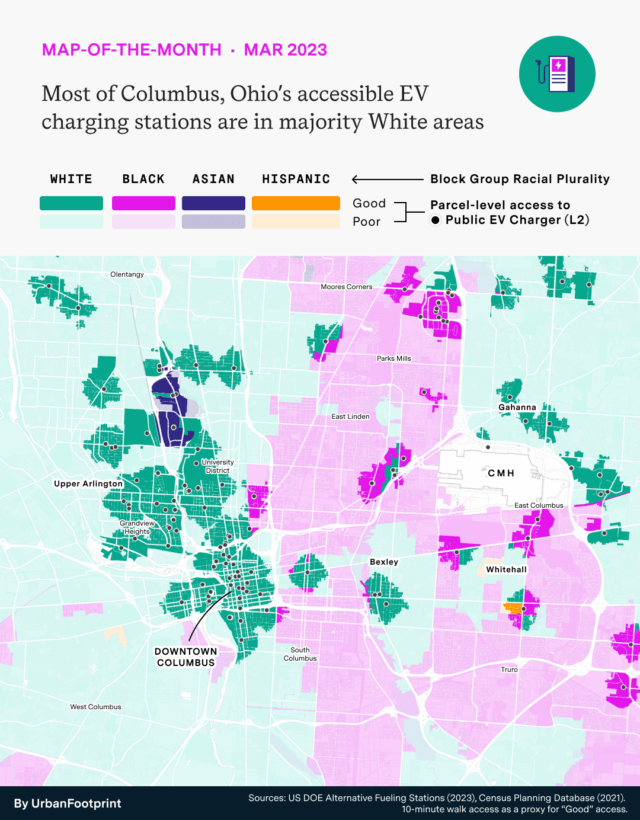
Analyzing the distribution of public EV chargers in Columbus, Ohio
Looking at the distribution of public EV charging stations in Columbus, Ohio, it’s hard not to notice that they are mostly located in majority white areas. Access to clean transportation options should be available to all communities, regardless of race or socioeconomic status.
Key Takeaways
- In 2023, the White House announced the first round of Charging and Fueling Infrastructure Discretionary Grant funding. Clearly, there’s work to be done to address the disparities that exist, but visualizing the problem can be a good first step toward addressing it.
- Read our blog for the full analysis of public EV chargers in Columbus
- Download our eBook to see how data can be used to site EV charging infrastructure equitably, building a sustainable future that benefits everyone.
February
Transit access to the Super Bowl
With the big game approaching, our team began to wonder how accessible the Super Bowl host State Farm Stadium is.
Key Takeaway
For a mega-event, transit is key for workers and attendees to avoid traffic, so we took to our Transit Accessibility Analysis Module to map where is within 60 minutes via transit.
January
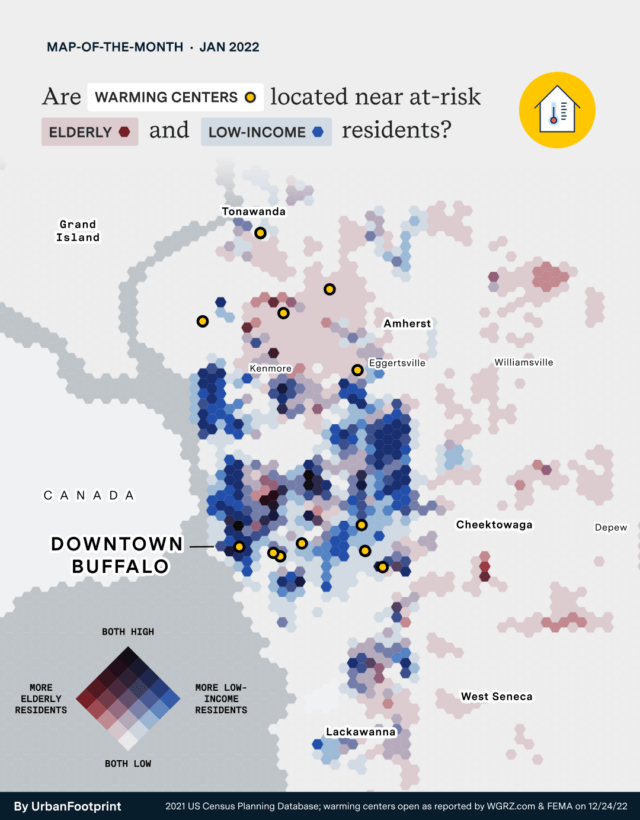
Surviving the storm
Following the worst winter storm in over 50 years, New York agencies were overwhelmed and challenged to quickly target limited support resources to those most in need. Our first Map of the Month explored whether warming centers effectively serve the most vulnerable populations in the hardest-hit Buffalo, NY region.
Key Takeaway
By looking at the intersection of low-income and elderly populations, we can identify where vulnerability exists and compare it to the locations of warming centers to identify gaps.
