


UrbanFootprint’s Base Canvas, our 160 million+ parcel dataset, is the most comprehensive land use data source available anywhere and sits at the center of our Data Core. We built the Base Canvas because we realized that there isn’t a publicly available, nationally-consistent view of land use. We bring together public and proprietary data and algorithms to create a robust understanding of what is on every parcel throughout the country.
The Base Canvas starts with parcel data from county tax assessors, which we supplement with point of interest data, Census data, and various other geographic datasets. We triangulate on the land use conditions on each parcel using dozens of data sources and powerful data science, which yields a more complete view than can be achieved using assessor data alone.
The Problem with Right-of-Way
Customers have highlighted that some parcels that are actually public Right-of-Way (ROW), especially roads, are misclassified as other land uses in the Base Canvas. We have noticed this to be an issue in the majority of parcel datasets that we have evaluated, and find that it is generally due to a lack of information about land use in the underlying county assessor data. These parcels typically are entirely missing land use data, or have vague descriptors like “tax exempt” or “vacant land”. This makes sense because tax assessors are primarily concerned with non-tax exempt parcels. While our Analyst application allows users to manually adjust land use designations in the Base Canvas in the scope of their projects, we wanted to try to resolve the issue more holistically for all users.
When ROWs are classified as other land uses, it can lead to inaccurate population, household, and jobs data due to these numbers getting assigned to roads etc. This can be especially problematic when working at granular levels and/or trying to do very precise work. Until now, customers were faced with two choices when ROWs were misclassified: live with the inaccuracies, or manually reclassify the parcels which could take hours or days depending on the scope of the project.
After digging into the parcel data, we noticed that different tax assessors appear to handle ROWs in a variety of ways, including omitting them entirely, coding individual street segments as individual parcels, and even coding the entire road network for a region as a single “parcel.”
Because there is no consistently clear identification of these ROW parcels in the parcel data, we sometimes misidentify the land use on them. Additionally, while for many other land uses we pull in supplementary datasets to identify the presence of a given land use, such as point-of-interest data, there is not an obvious candidate for identifying parcels consistently as roads. For example, if we were to take a GIS layer containing roads depicted as lines and simply intersect it with parcels, we would have many false positives as roads frequently cross over the edges of parcels.
How did we solve the problem?
Our data exploration identified that our existing algorithm was not working well for public ROWs due to a lack of information in the sources at hand, so we built a machine learning (ML) model to help identify these parcels.
Labeling parcels
The first step in developing our binary classifier model was labeling a sample of parcel data as ROW or non-ROW. Given that only a small proportion of parcels are actually ROWs, we needed to be economical in our data collection to avoid spending too much time labeling non-ROW parcels. For instance, if true ROW parcels only comprise 0.5% of the overall Base Canvas, if we labeled an entirely naively chosen sample of 200 parcels, only 1 of them would be expected to be a true case. This would make it hard for our model to learn the features that are predictive of a parcel being a right-of-way, as there would be very little variation in the available information.
To help guide this data labeling, we first developed metrics that we suspected might be strong predictors of a parcel being a ROW. We then performed an exploratory analysis of these variables to develop simple heuristics for identifying “potential ROW” parcels. Our goal was to collect a balanced (50/50) sample of ROW and non-ROW parcels. UrbanFootprint staff labeled parcels based on aerial and street level imagery, and we adjusted the pool of candidate parcels as we went to guide towards a balanced sample. In the end, our sample ended up closer to a 30/70 split of ROW vs non-ROW parcels, which we accounted for in the model development process.
Feature Engineering
After collecting our data labels, we built our predictor variables for modeling. Our predictors fell into three broad groupings:
- Metrics summarizing the shape of the parcels, such as an index that describes whether a polygon is “long and skinny” vs. “wide and fat”
- Metrics summarizing the extent to which each parcel intersects with other datasets describing public ROWs, such as Census TIGER lines describing roads
- Characteristics of the parcel itself, such as whether it has an address and the value of structures on the parcel
Our overarching goal in feature engineering was to build metrics that could easily be calculated for any parcel dataset and which do not rely too heavily on the subjective determination of the tax assessor collecting the data. One challenge with working with parcel data at the national scale is that it is collected by each tax assessor separately, typically at the county-level, which can lead to major differences in how different concepts are represented. Relying on relatively simple geometry-based measures helps to reduce the impact of this variation.
Model Estimation
With our data sample collected and predictor variables developed, we turned our attention to developing a model. One of the most exciting aspects of this project was using Google’s BigQueryML platform. Our data team has been working on migrating most of our analytical work to BigQuery for over a year, and building this model showed the payoff of that effort.
In building ML models, a large amount of the work is in the process of “hyperparameter tuning,” or turning the levers that affect how the model is constructed. This is in contrast to model parameters, which are adjusted based on the data fed to the model and based on the hyperparameters. We found that, given the relatively small amount of labeled data we’re working with (on the order of 1000s of records), BigQueryML was inefficient for tuning, so we opted instead to do this in Python using scikit-learn. We then fit our chosen model in BigQueryML using the hyperparameters selected with scikit-learn.
The payoff of building the final model in BigQuery was immediate. Predicting whether each of our 160 million parcel records was ROW ran in a matter of 30 seconds, based on a single SQL query. For anybody who has struggled with applying ML models at scale, this is a huge leap forward in quality of life.
What do the results look like?
After all this talking about the implementation, you must be asking – how well are you actually doing at prediction? There are a few different ways we evaluated this.
Out-of-sample prediction
The first way we evaluated our results is while developing the model itself. Before developing the model, we split our data into a training set (80%) and a testing set (20%). We performed all hyperparameter tuning and model estimation on the training set, then evaluated performance across models with the test set. We selected our model and a threshold for positive identification of ROWs very conservatively in an effort to minimize false positives. At the probability threshold we selected, our model yields a false positive rate of 0% and a true positive rate of 59% on our test set. In other words, we opted for results that do not successfully detect all ROWs in order to avoid adding any additional false predictions to our Base Canvas. We see our approach here as one of making iterative improvements to data quality, and in the future plan to revisit this model to improve our true positive rate.
Net effect on number of ROW parcels
Before incorporating this model in our Base Canvas data pipeline, only approximately 0.002% of parcels nationwide were flagged as ROW. However, after implementing, we see this share increase to approximately 0.482%, which tracks much more closely with our anecdotal experience of how many parcels are actually public ROWs.
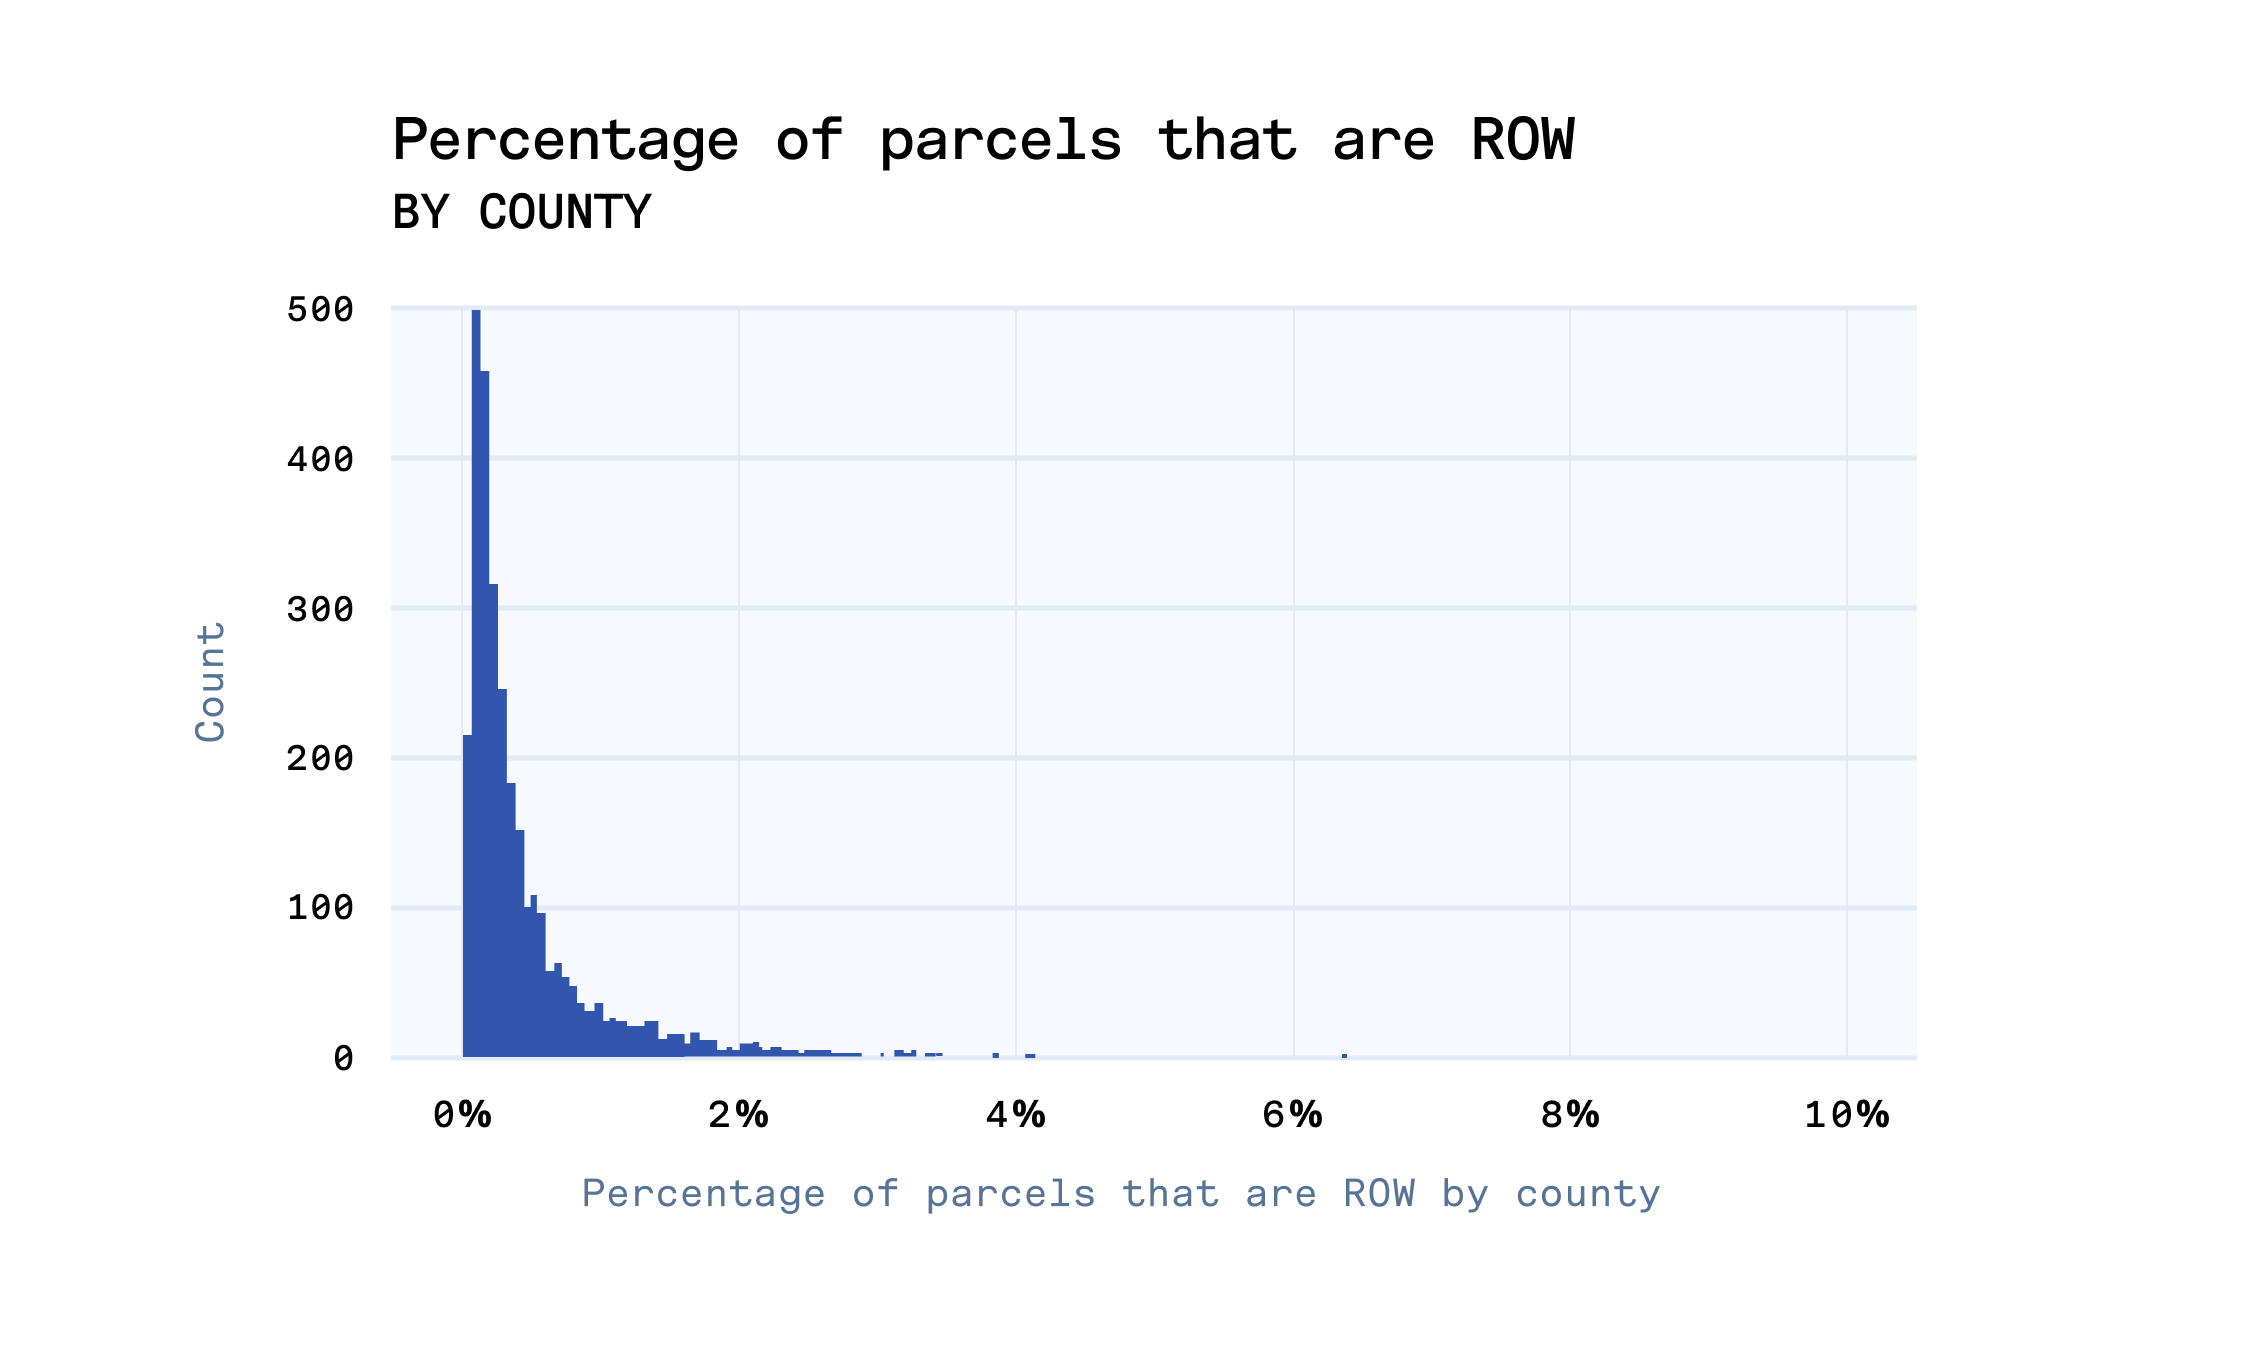
As we previously mentioned, counties do not code ROW in their parcel data consistently. We can see this in the share of parcels by county that our revised Base Canvas flags as right-of-way. The vast majority have below 2% of their parcels as ROW, with a large spike close to 0%, but a small number of counties have as many as 10% of their parcels that are actually public right-of-way. Manually verifying the results for these outlier counties suggests that the model predictions are true, and there are in fact a very large number of road parcels in these places.
Visualizing results
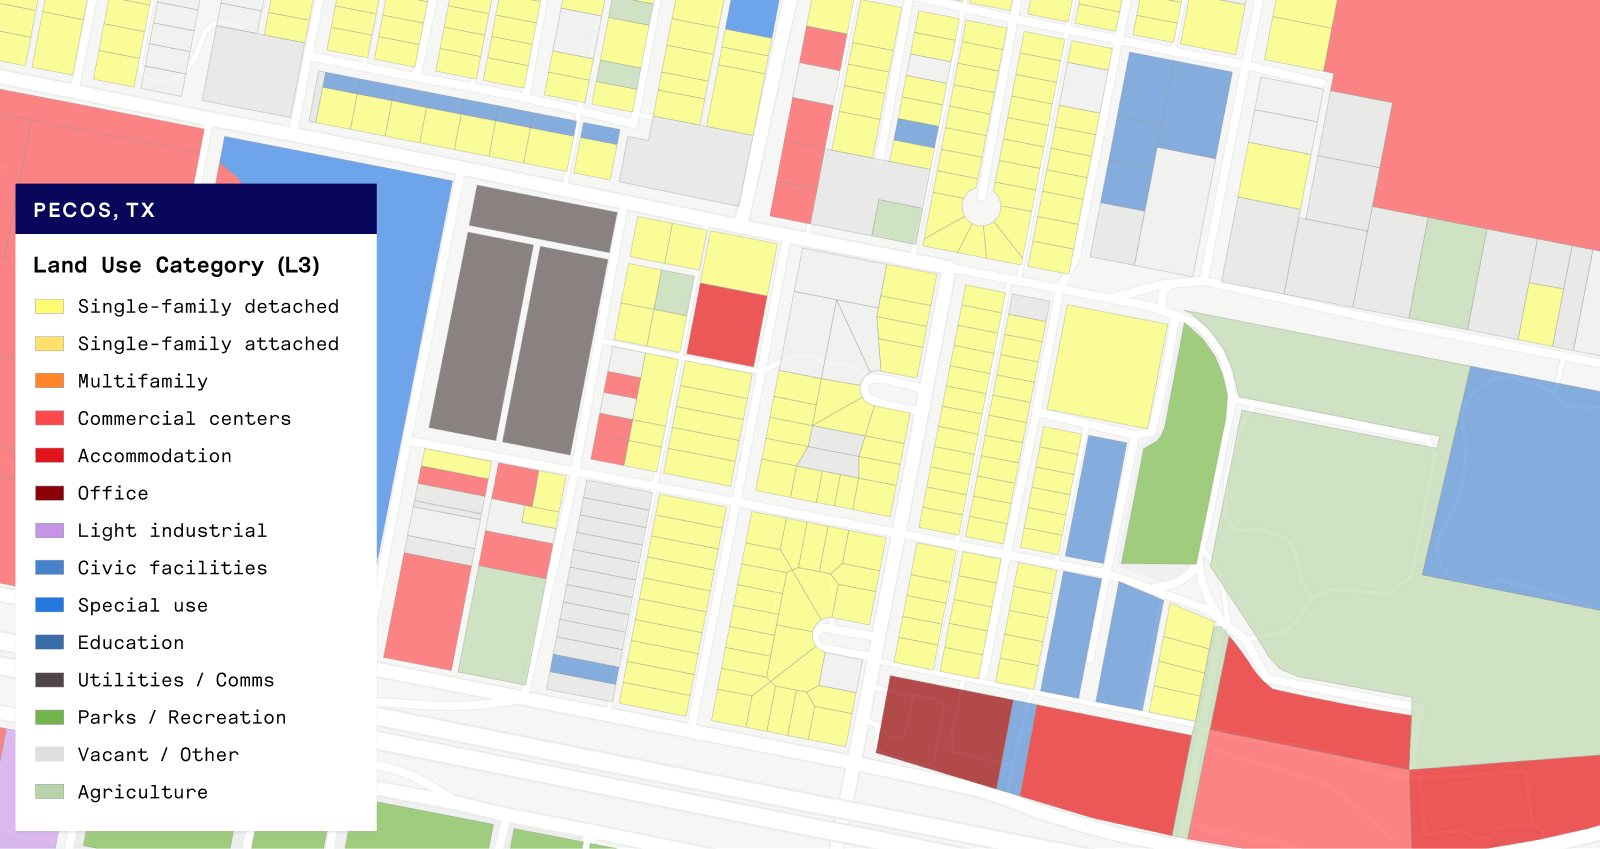
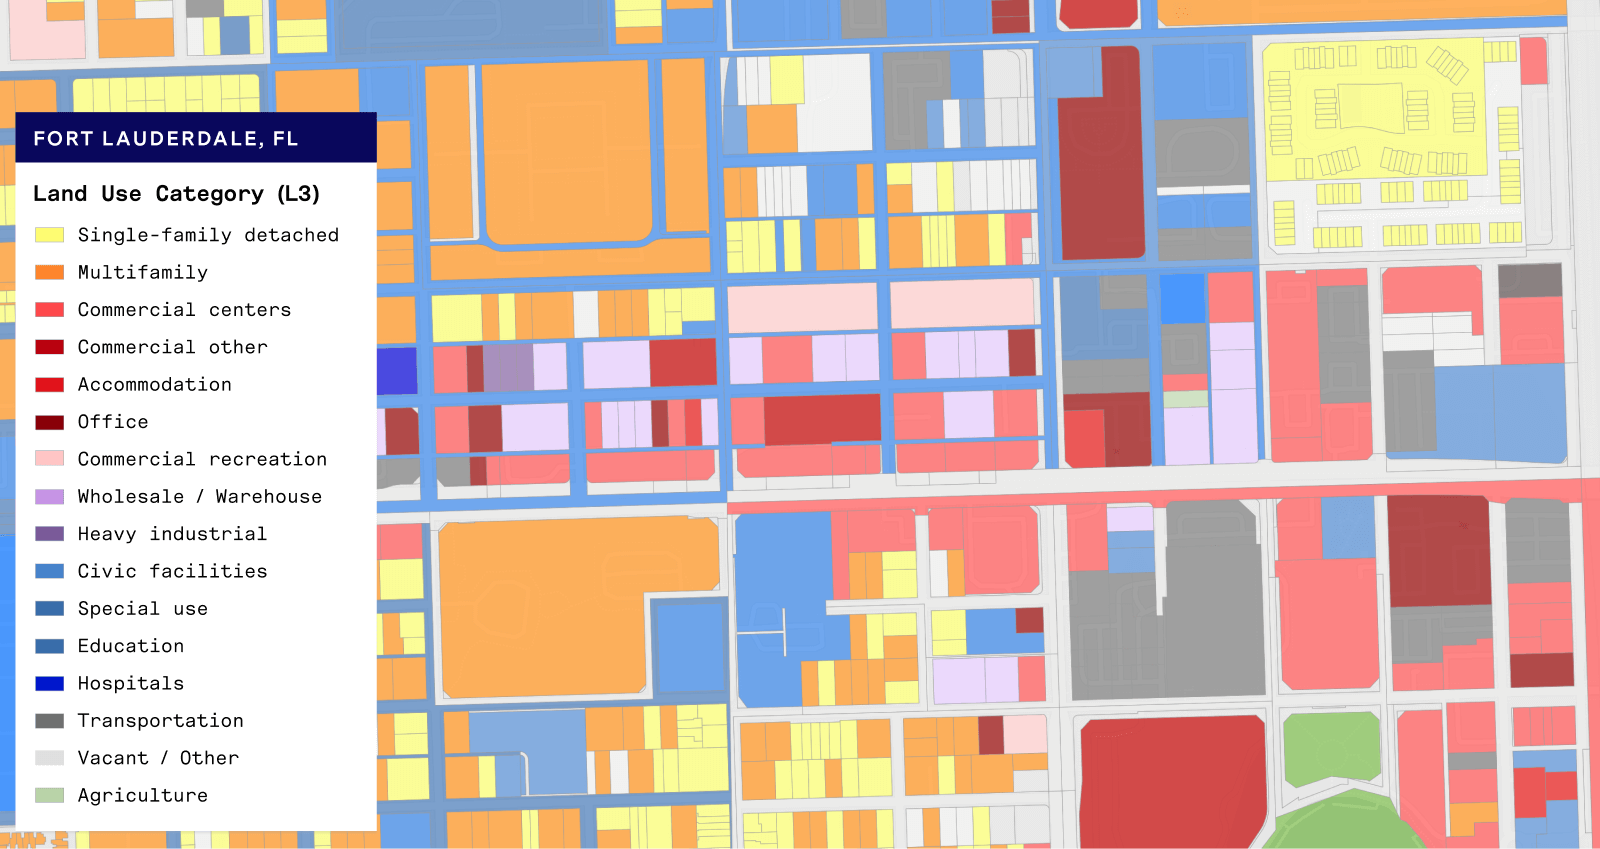
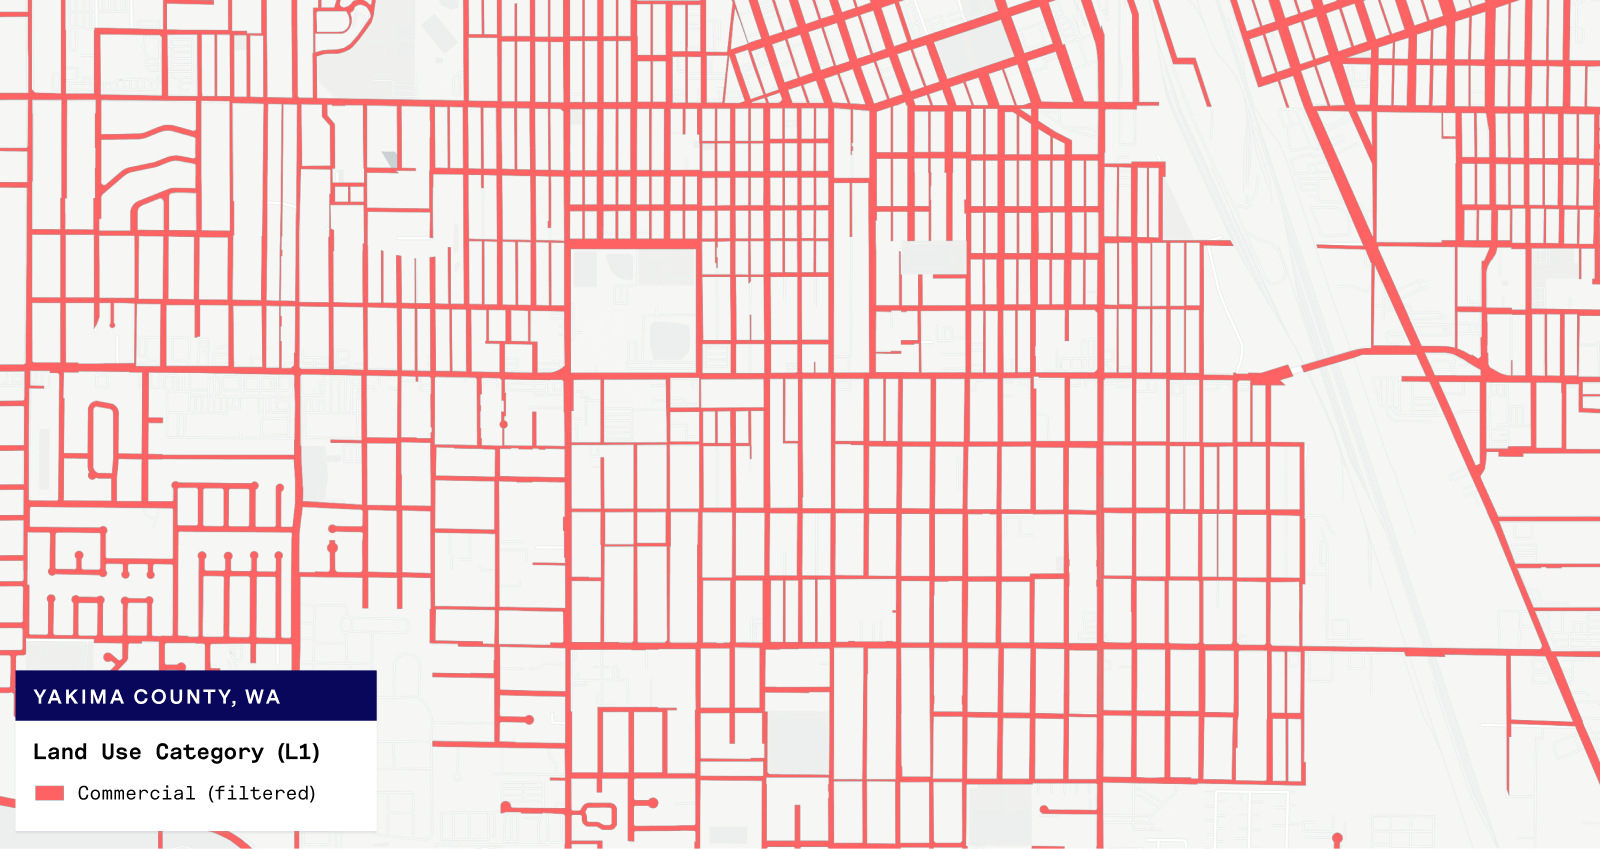
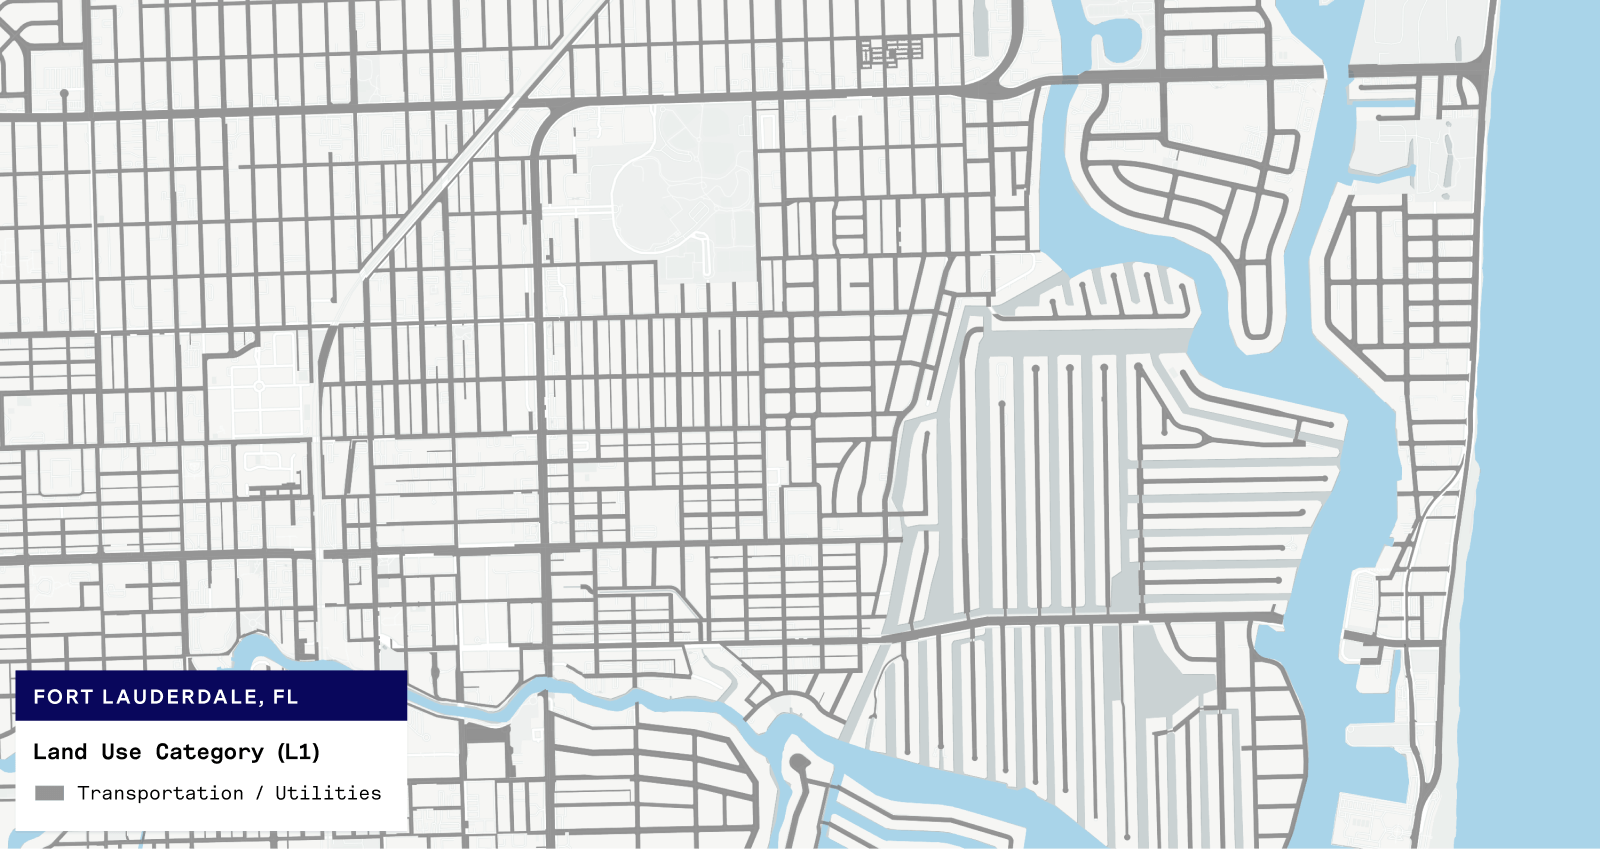
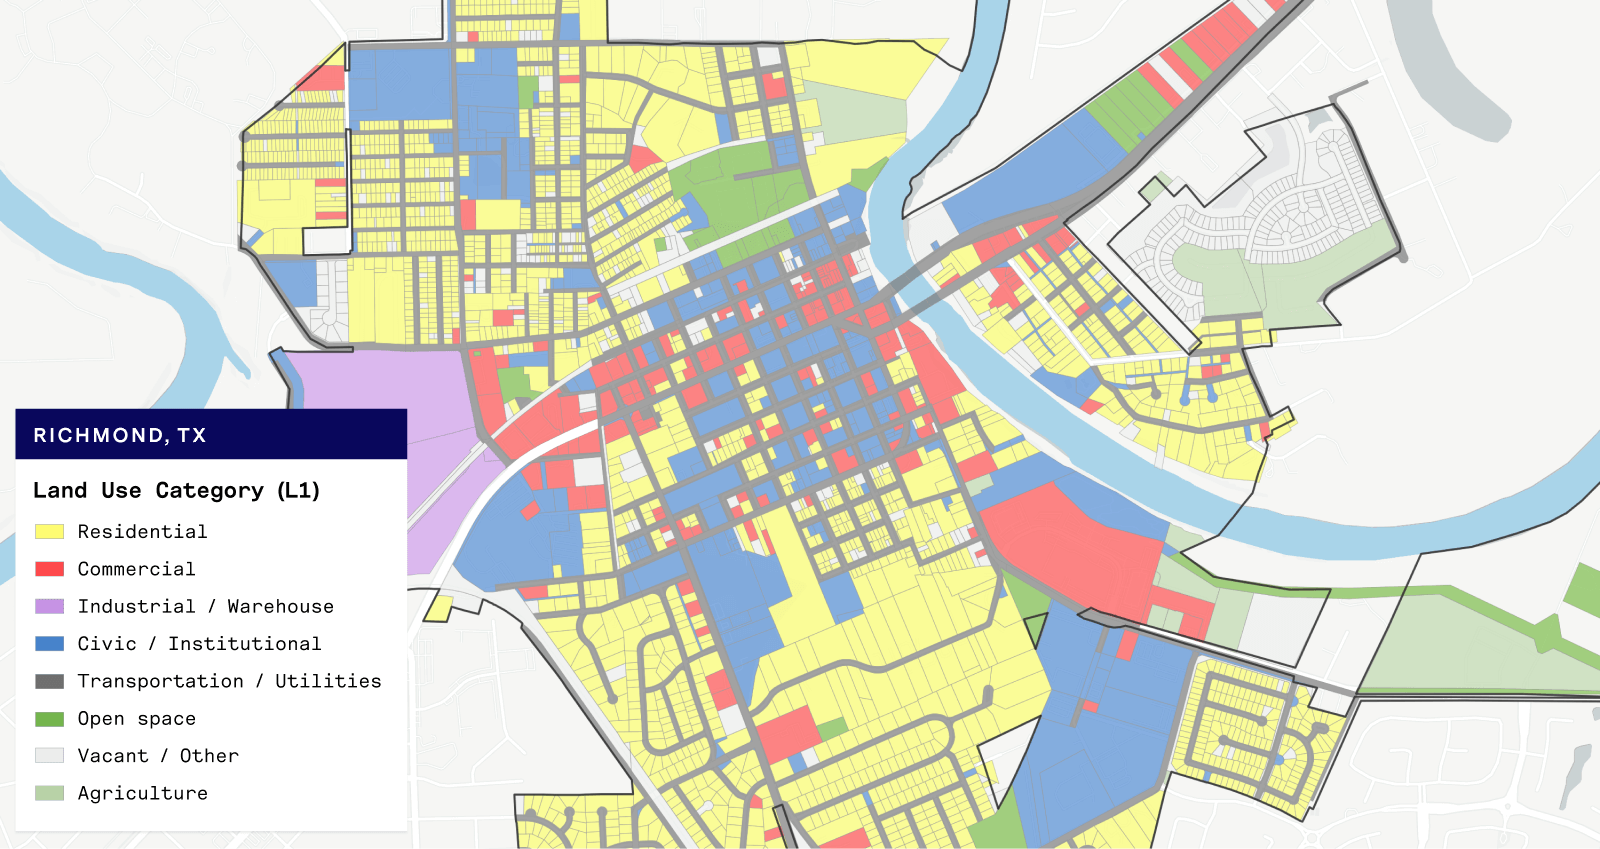
The final way we validated our results was through one of our favorite activities, making maps! We evaluated counties that appeared to have very large numbers of ROW parcels to see if the parcels flagged as ROW appear to truly be roads and other public rights-of-way.
From the examples below, we can see that the parcels we are now flagging as ROW look very much like street maps!
A better data foundation
Making iterative accuracy improvements to our Base Canvas data pipeline like this is one of our data team’s favorite activities. Our goal is to have the most comprehensive and up-to-date data foundation available for land use and other built environment data, and improving the land use typing on our parcel data is core to that effort. While our apps make it easy to edit data to reflect local knowledge, providing a high quality starting point allows our customers to more easily work with our data off-the-shelf.
Having ROWs classified correctly will provide users with more accurate population, household, and jobs data, providing a better foundation for analysis while saving time for end-users.
Subscribe to our blog using the form below to stay up-to-date on additional enhancements and refinement to our data products!
