


If you’re interested in creating a project like this, let us know!
How does zoning policy impact your city? We supported a recent New York Times’ study examining the extent of detached single-family zoning in cities across the U.S. The data behind this analysis is available out-of-the-box in UrbanFootprint. In this post, we’ll show you how to quickly get up and running in UrbanFootprint to do a zoning analysis for a city of your choosing.
Create a project for any U.S. location
If you’ve never used UrbanFootprint before, you can start by creating a free seven day trial.
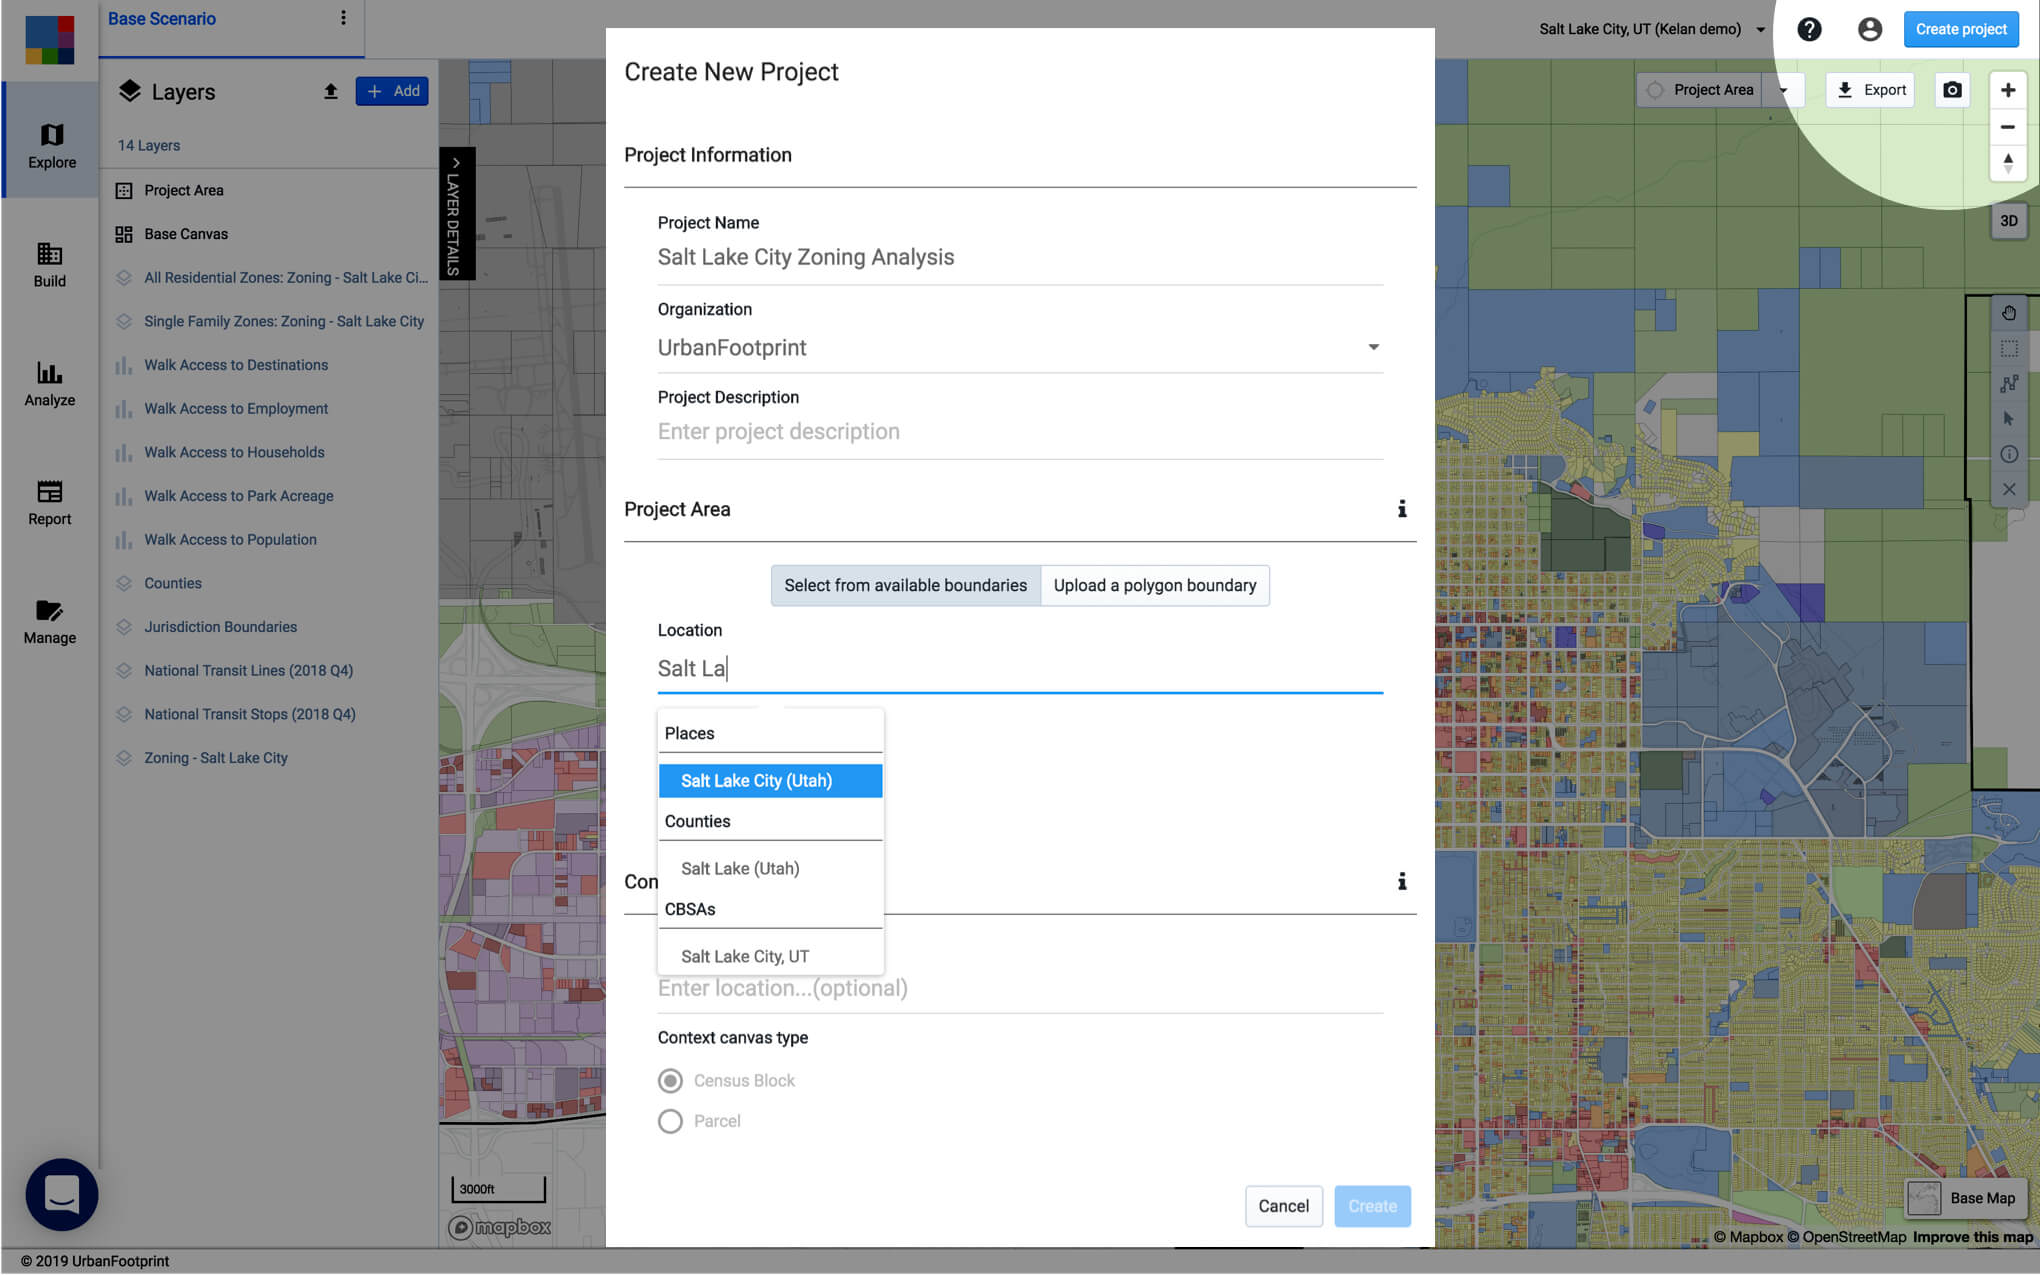
Once we’re in the app, click the “Create Project” button to quickly start a project anywhere in the United States. For this example, we’ll look at Salt Lake City.
Map and explore the zoning data
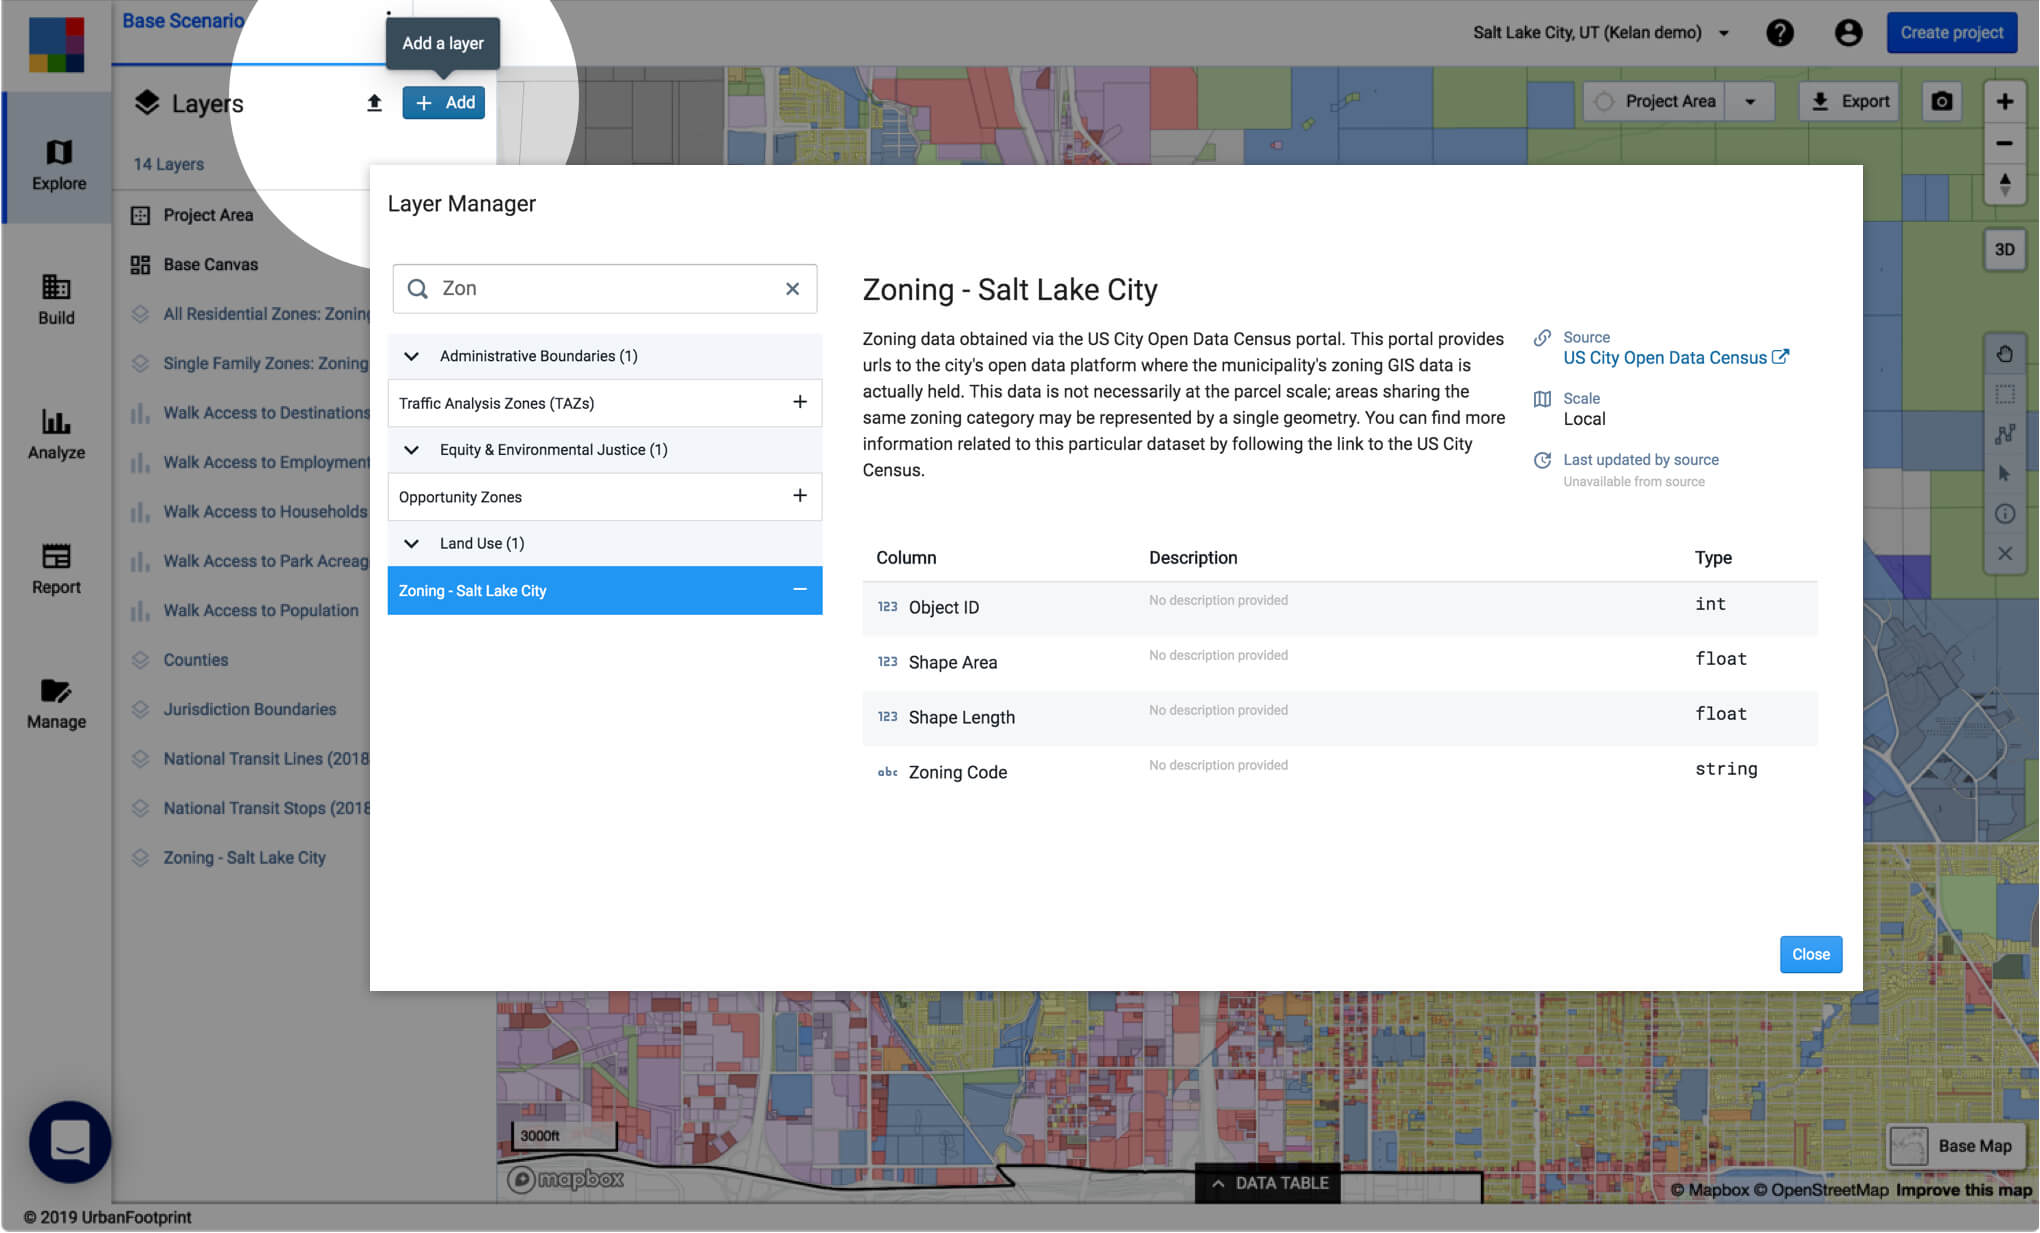
Next, we’ll go to the Layer Manager to see if UrbanFootprint already has zoning data available for our project area. UrbanFootprint comes preloaded with hundreds of useful reference datasets, including zoning data for major cities such as Los Angeles, Chicago, Philadelphia, and more.
While UrbanFootprint already has the zoning data for our Salt Lake City example, if we don’t happen to have zoning data for your city preloaded in the platform, you can easily upload the information as a shapefile from open data portals, such as Socrata.
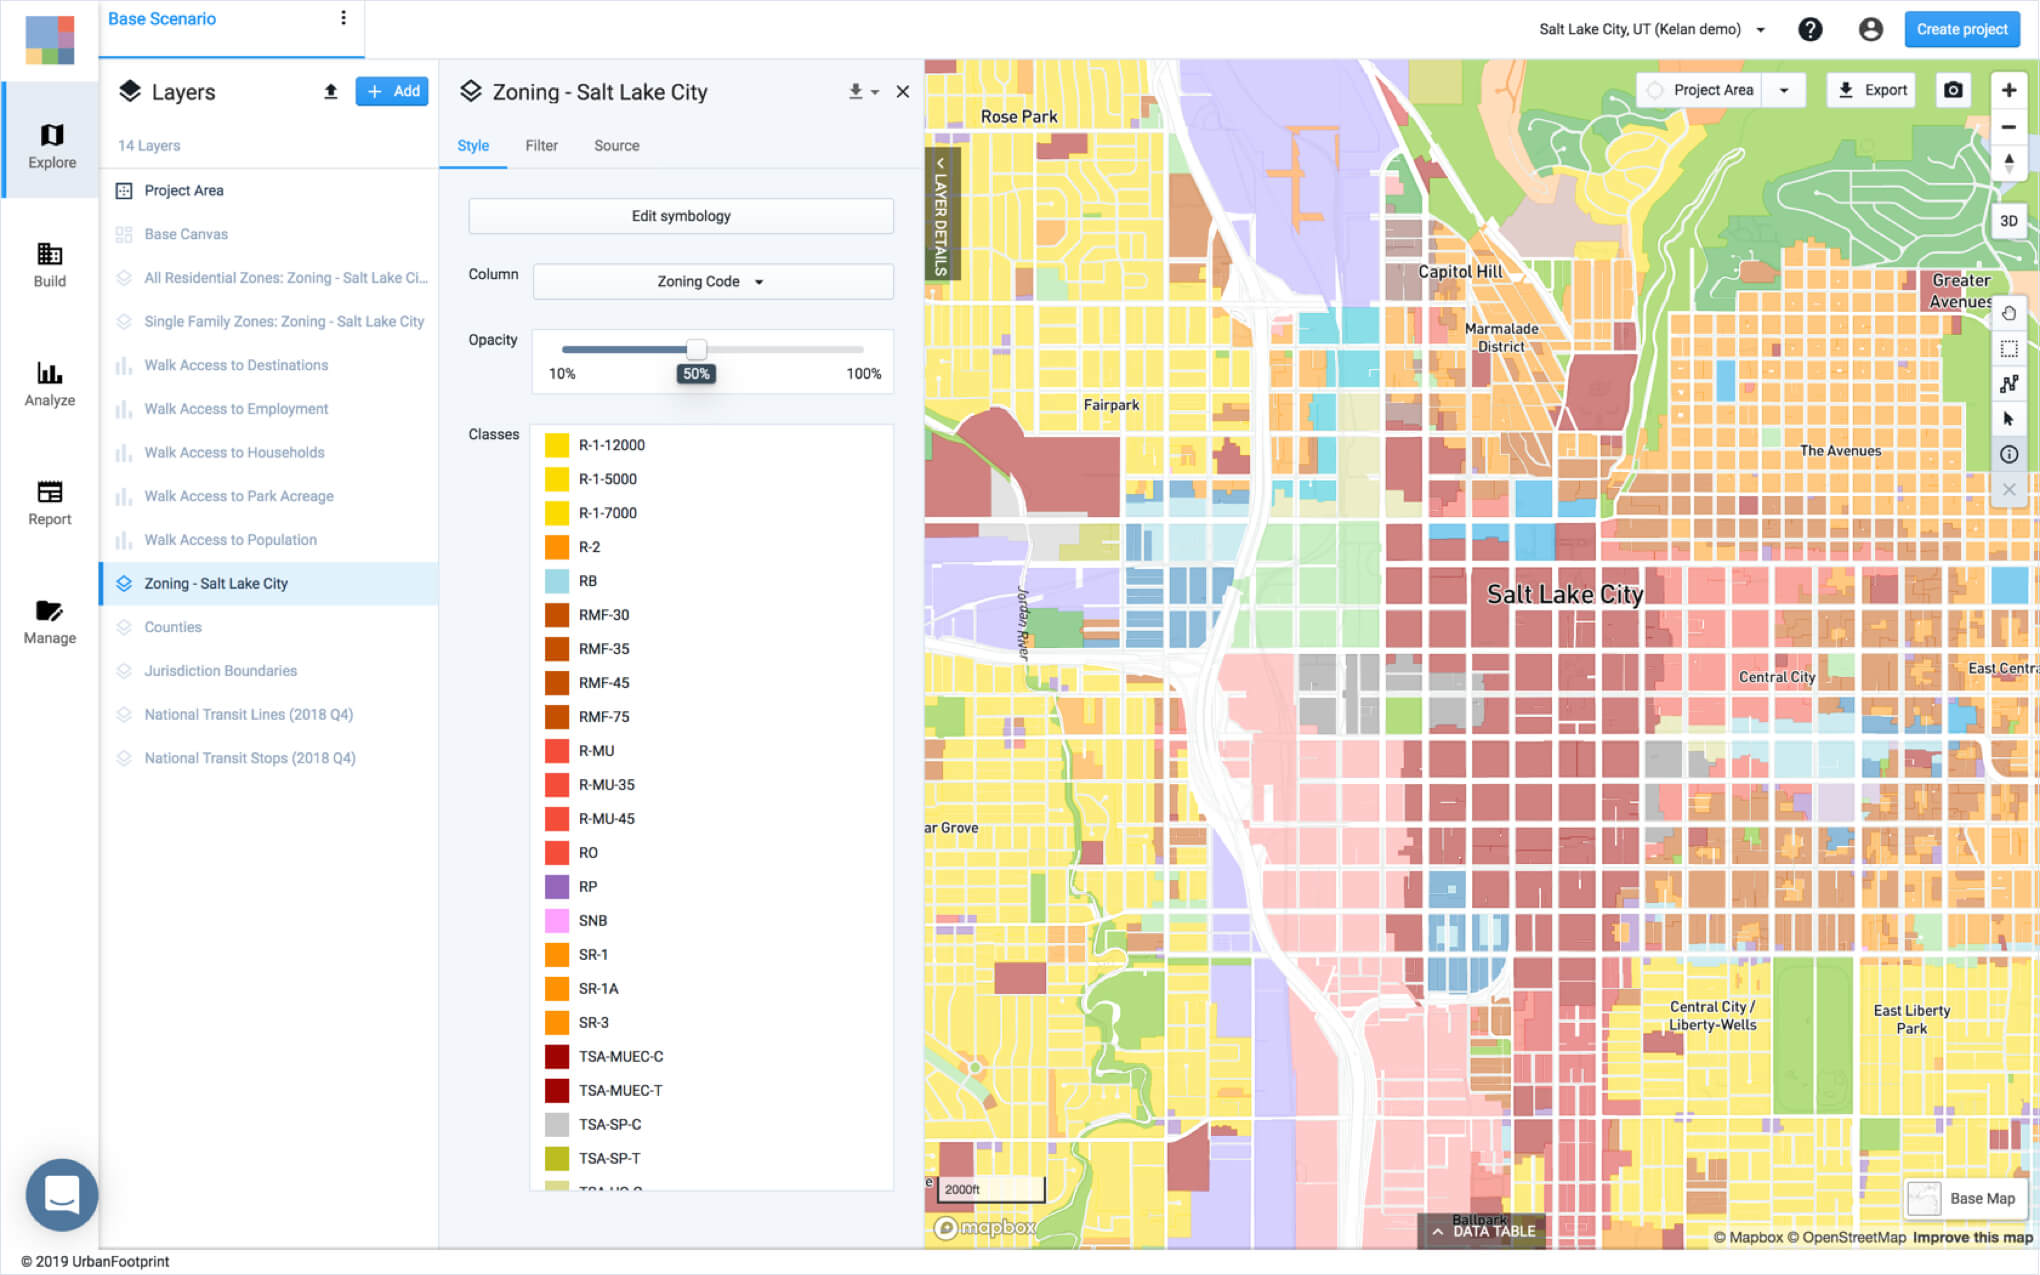
Now, we can easily map the layer by selecting it from the layer list and choosing to display the zoning column. In this case, it’s called “Zoning Code”.
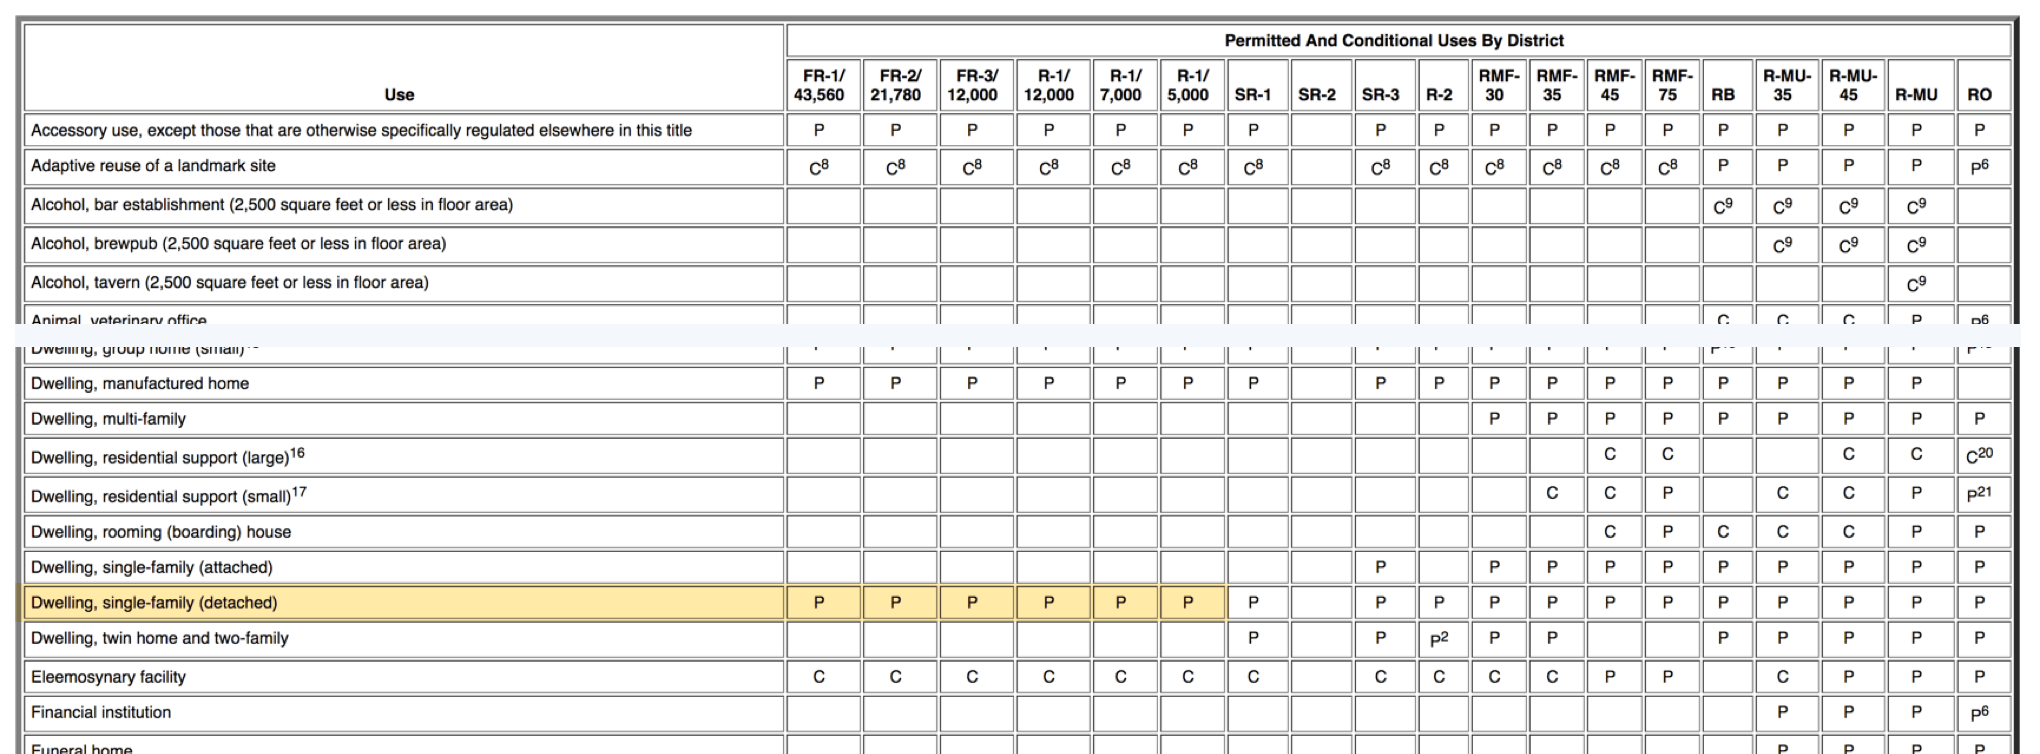
Next comes the tough part – parsing what the zoning codes mean for your project area. Zoning codes are notoriously complex, often with each city having its own way of structuring codes as well as having a different template for documenting what the codes mean.
For Salt Lake City, the meaning behind each code can be found here after going to the city’s zoning page.
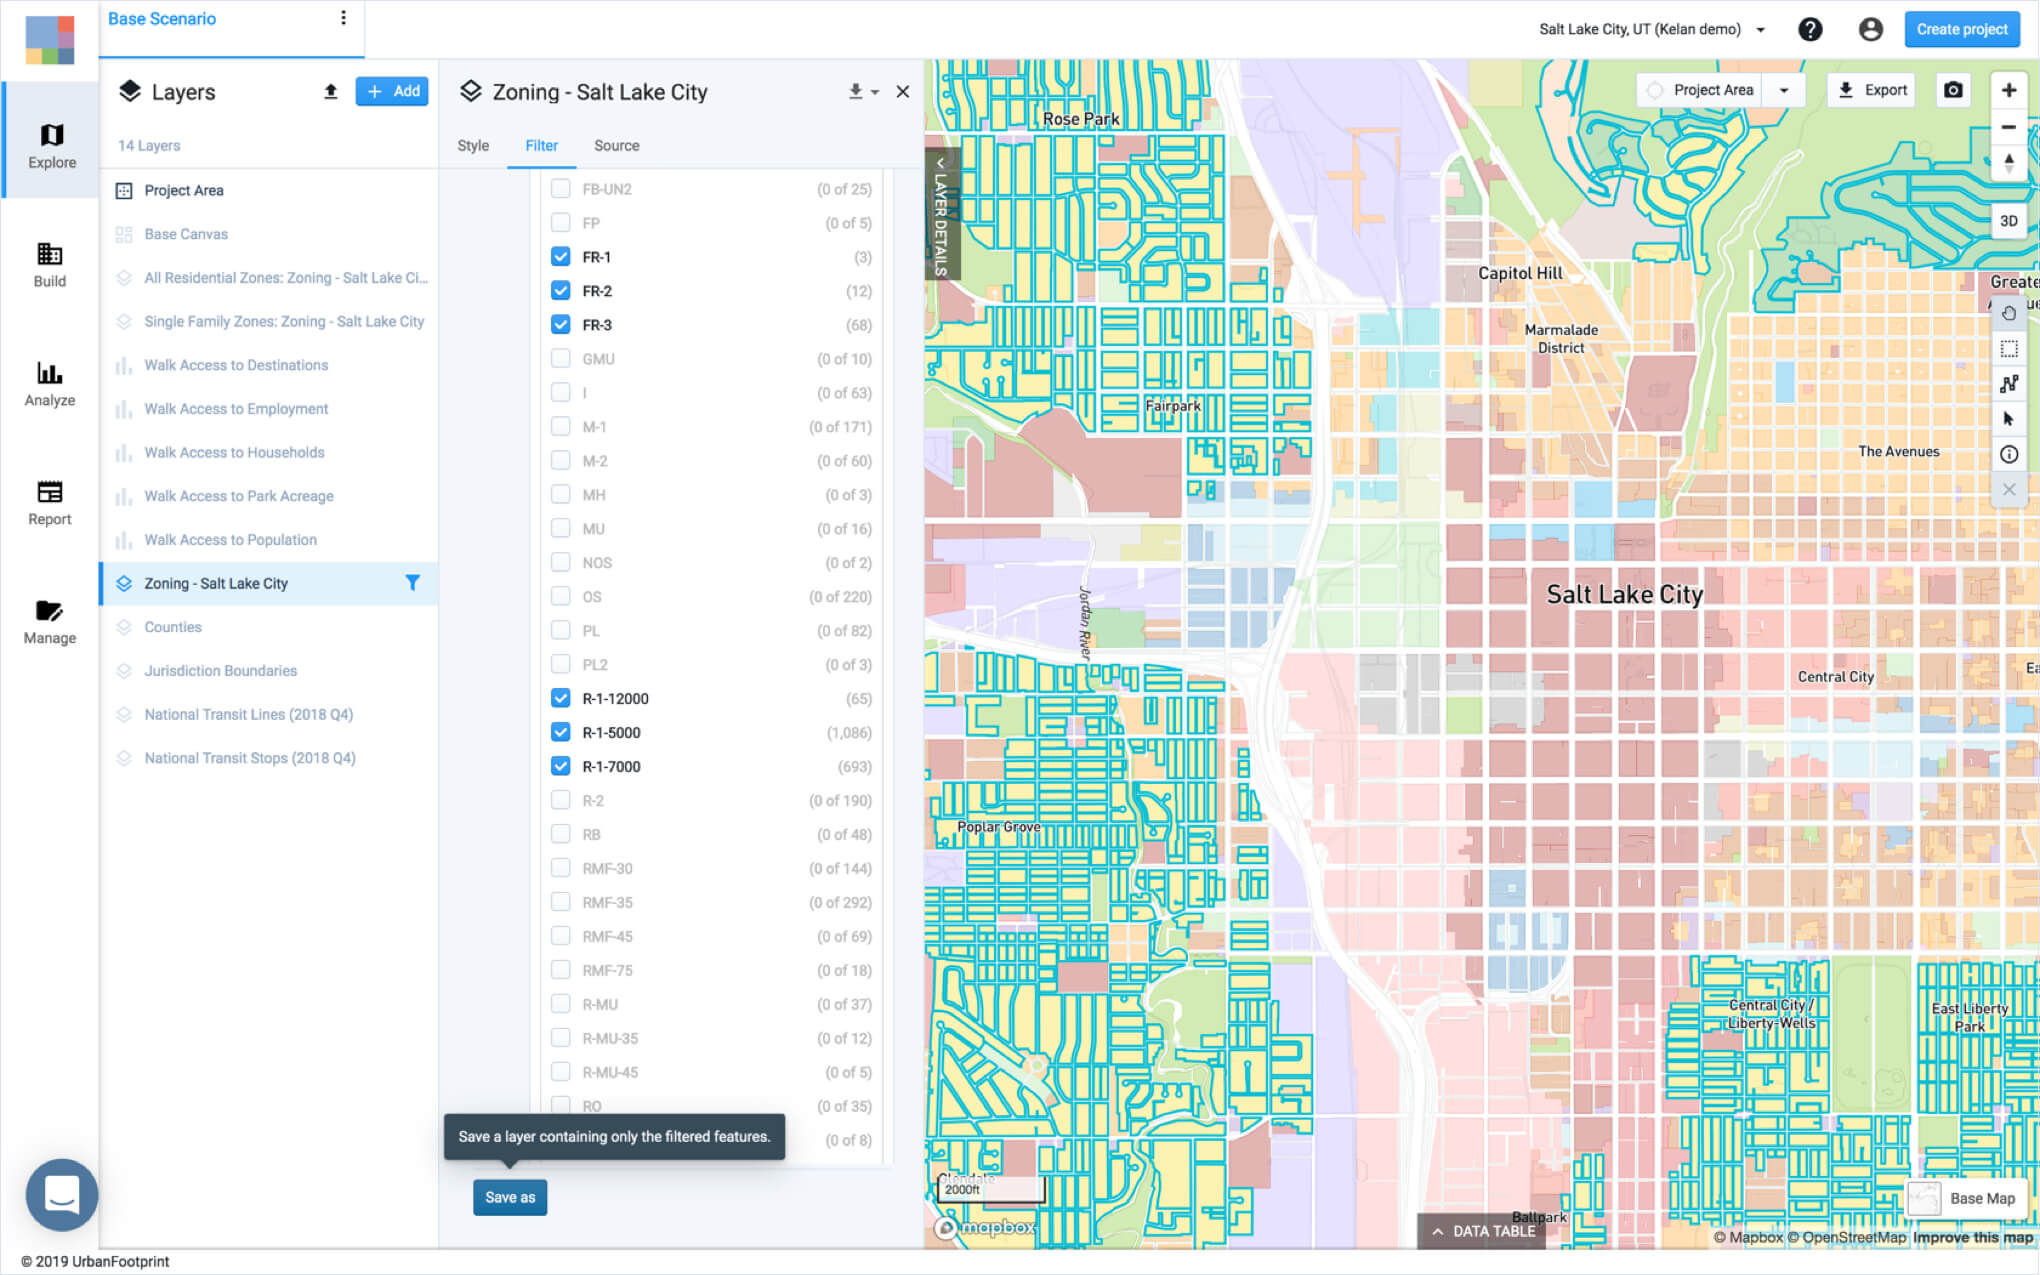
Next, if you’d like to highlight the reach of detached single-family zoning in your project area, similar to the New York Times study mentioned above, we can use UrbanFootprint’s filter tool to select just the zones that permit detached single-family housing. In Salt Lake City, those zones are ‘FR-1’, ‘FR-2’, ‘FR-3’, ‘R-1-1200’, ‘R-1-7000-‘, and ‘R-1-5000’.
As shown below, we can separate these zones to be a new layer in UrbanFootprint.
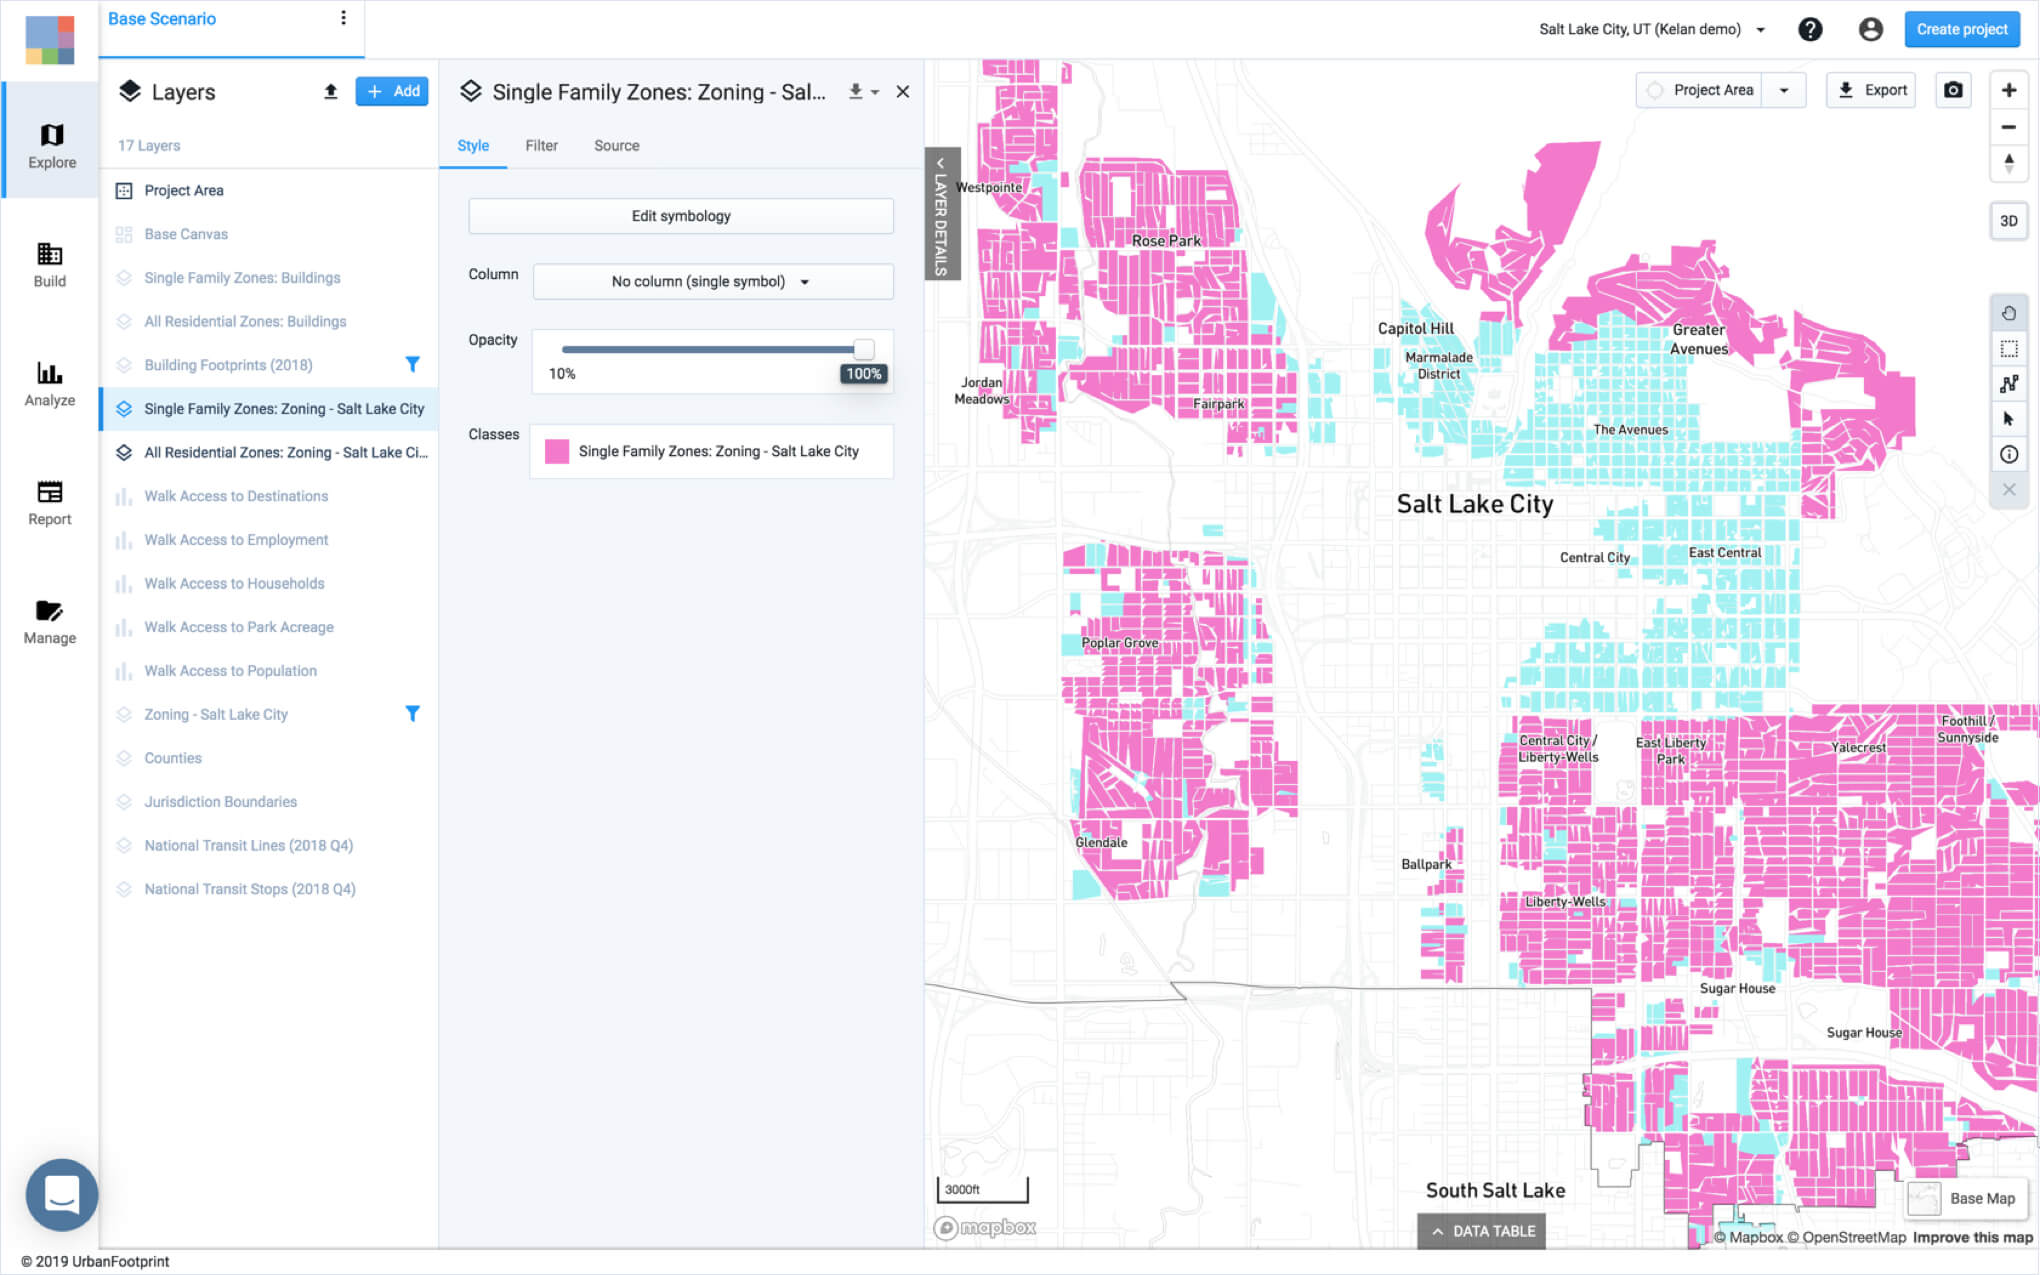
Next, we’ll make another layer that includes all other residential zones, including townhouses and multifamily units.
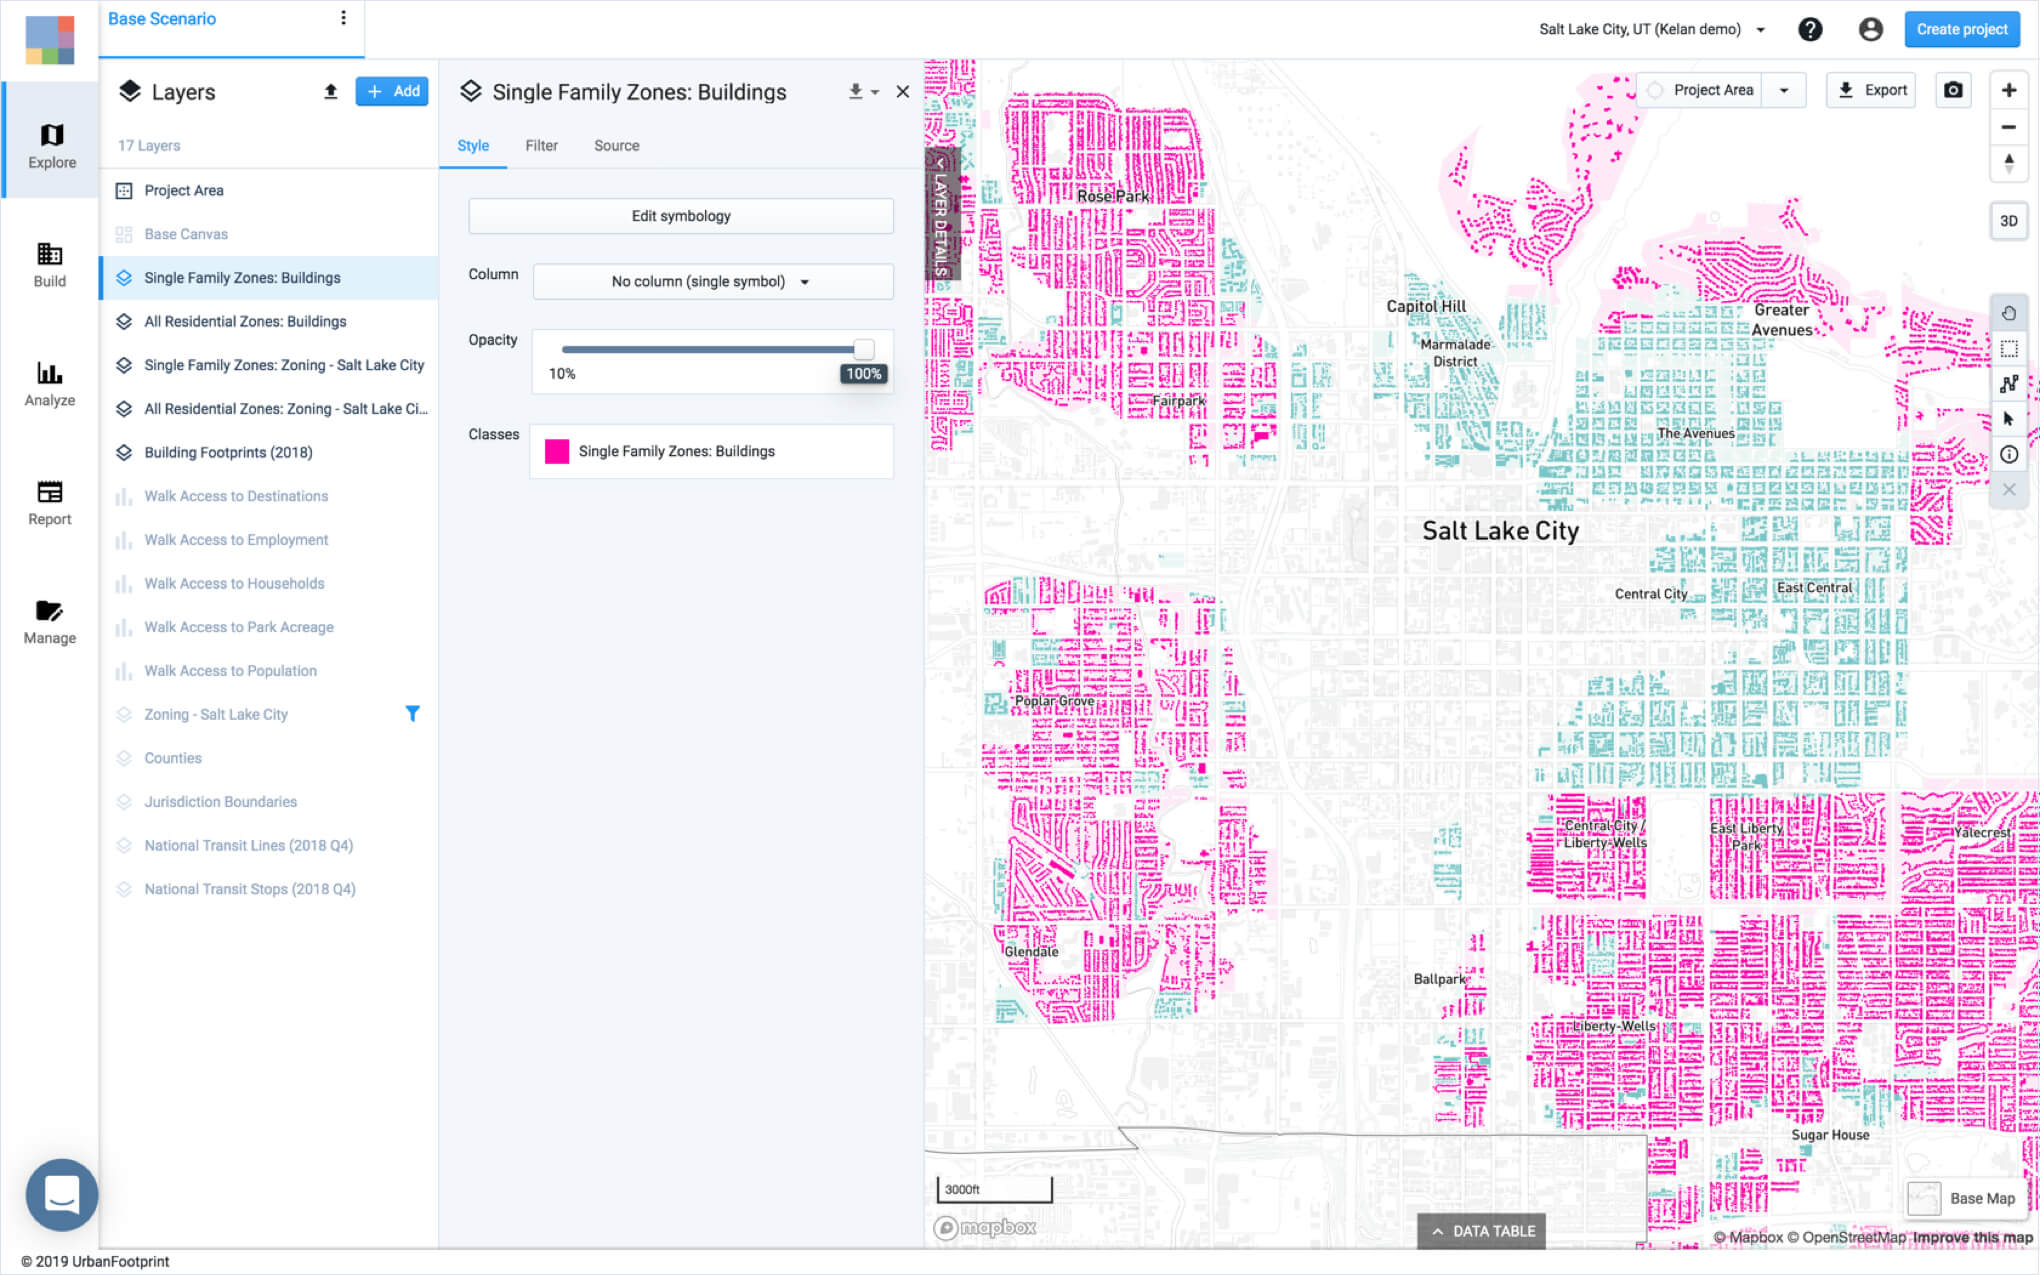
For New York Times bonus cartography points, you can use the “Building Footprints” layer to create two more layers that represent the residential building footprints in both of the residential zones we’re highlighting. Use the “Join” functionality under the “Filter” tab to create these two new layers.
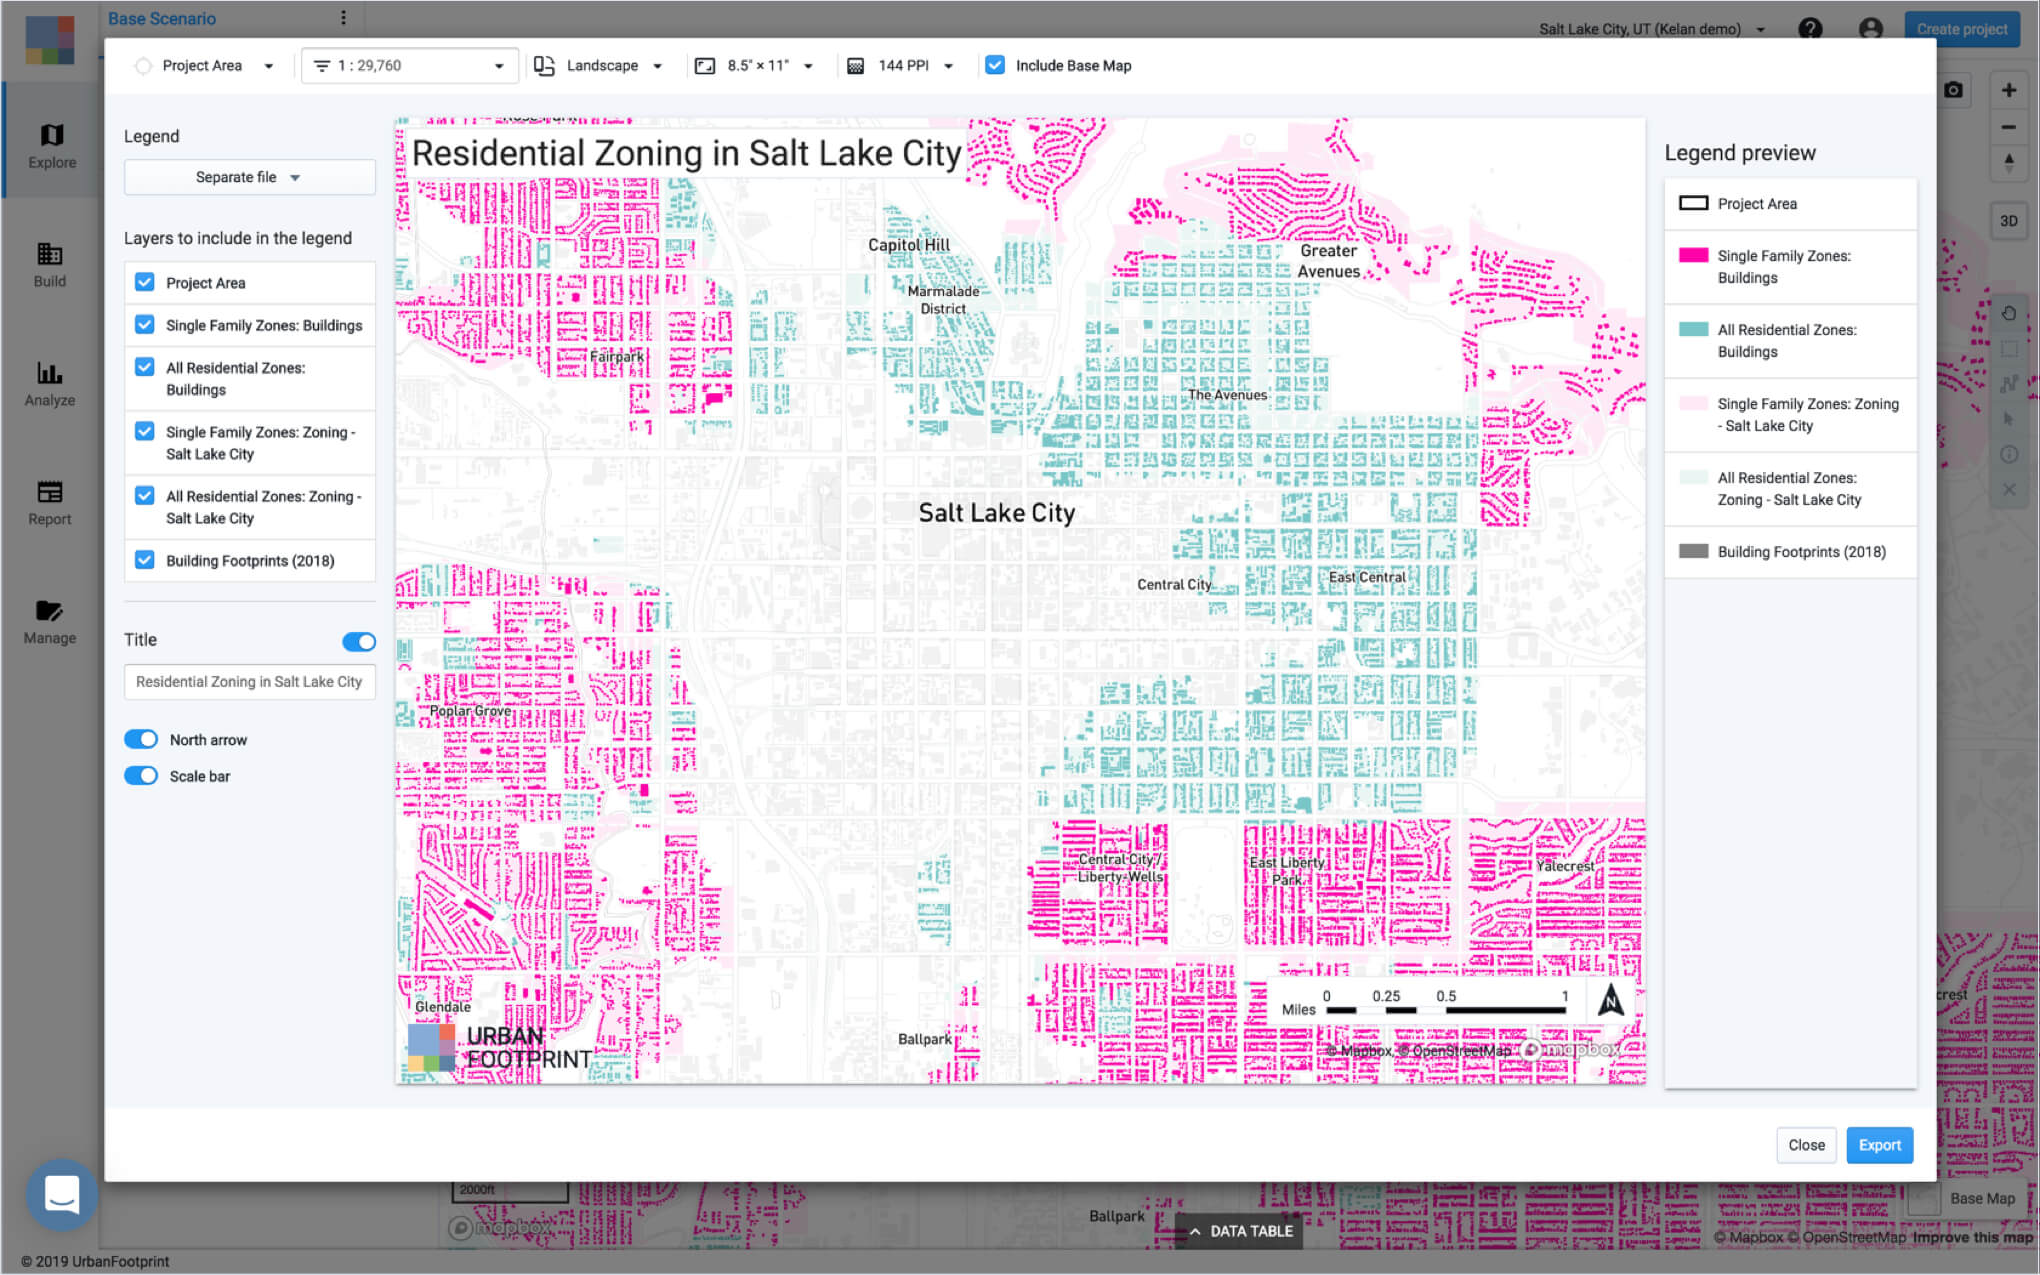
We can style these different layers and use the map export functionality to get a high-quality map of our area. In our map below, pink indicates detached single-family housing zones, and teal denotes all other residential zoning, such as townhouses and multi-family units.
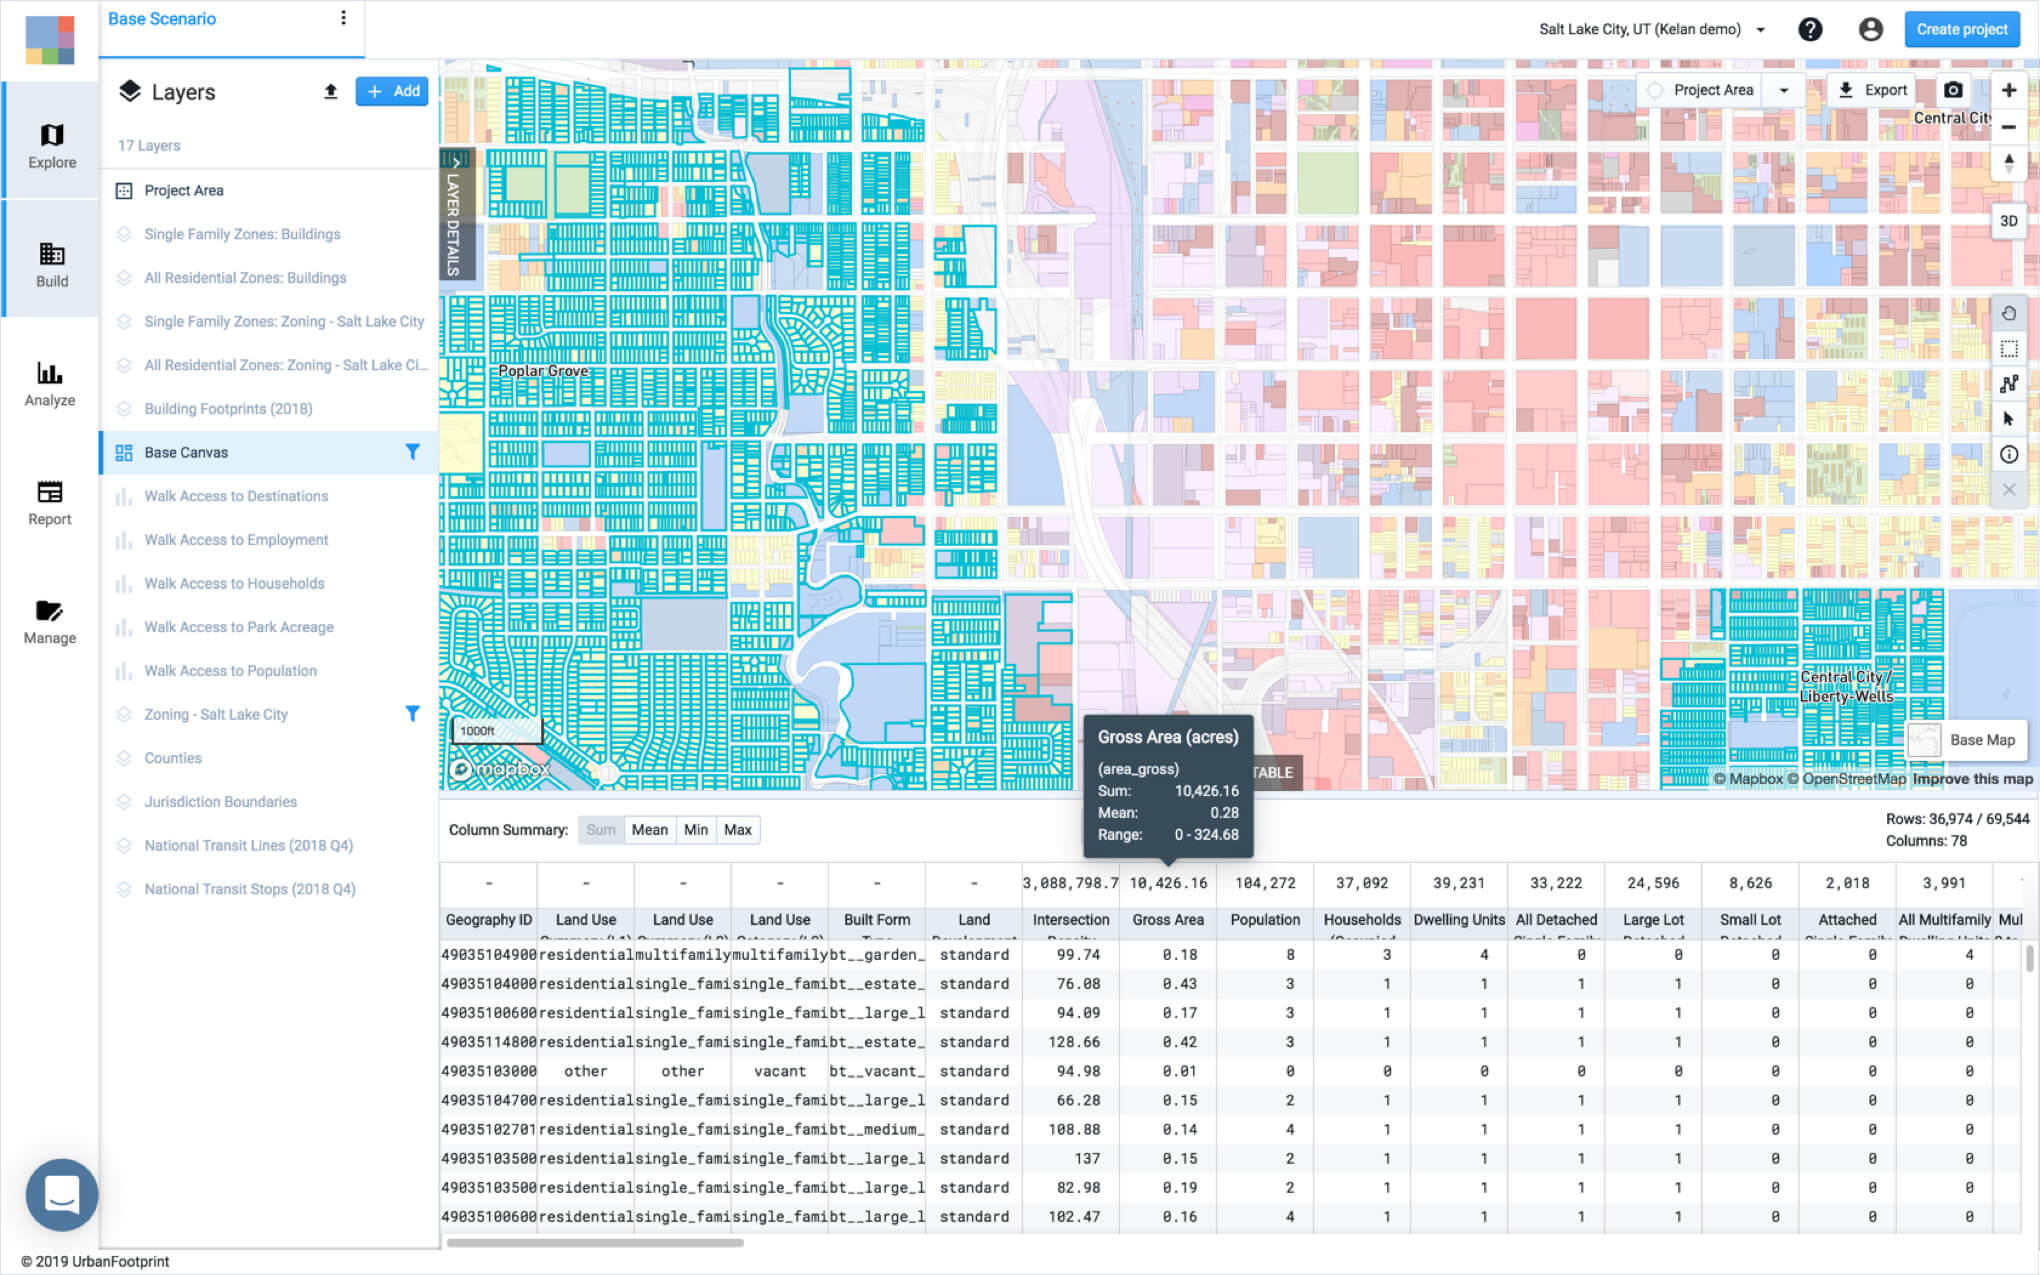
Analyze the numbers for quick policy insights
Now that we have visualized the zoning, we can also use UrbanFootprint to dive into the numbers. To do this, we’ll start by joining the Base Canvas with the detached single-family zones layer. Looking at the data table, we can see this spans roughly 10,400 acres of land.
Next, we can extract a number for the total amount of land zoned as residential by joining against the other housing layer we created. This gives us 12,500 acres.
This analysis shows that roughly 83% of all parcelized residentially zoned land in Salt Lake City permits exclusively detached single family homes. Or in other words, only 17% of land zoned for residential use in Salt Lake City permits anything besides single-family housing.
From here, we can also begin to ask some policy questions. For example, how many units could be added if duplexes were permitted on all single family parcels? How might this benefit residents’ access to transit? How could this impact vehicle-miles traveled? With the ability to quickly model future scenarios and analyze impacts, we can glean interesting insights from exploring the potential impacts of zoning policy updates.
Ready to learn more about UrbanFootprint?
Book a demo with our team and learn how to create beautiful maps in minutes, including existing conditions exhibits, future scenario planning, and more.
