


If you’re interested in creating a project like this, let us know!
In 2017, hurricanes Harvey, Irma, Maria, and Jose resulted in one of the most deadly and costly hurricane seasons in recent U.S. history. Studies have shown that climate change is creating more extreme weather events than ever before, including a substantial increase in heavy rainfall and precipitation events.
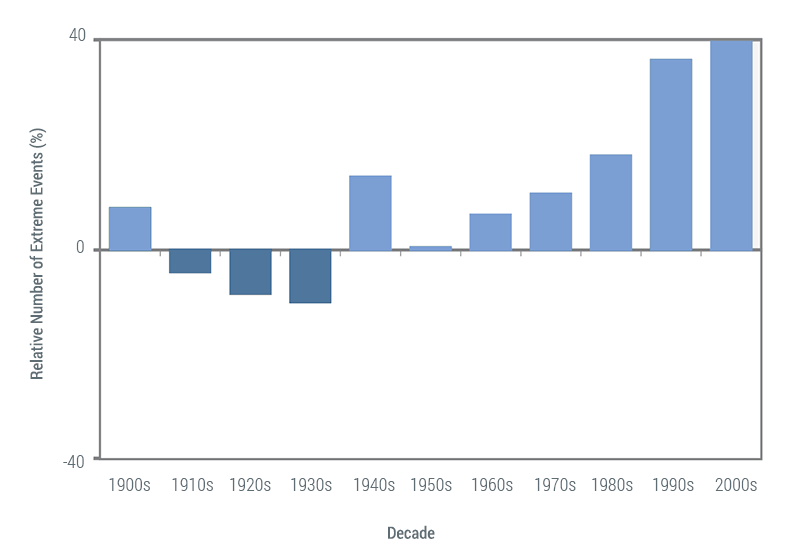
One measure of a heavy precipitation event is a two-day precipitation total that is exceeded on average only once in a five-year period. This is also known as a once-in-five year event. As the extreme precipitation index for 1901-2012 shows below, such events have become much more common in recent decades.
Observed U.S. Trend in Heavy Precipitation
As planners work to brace their communities for the increasing impacts of climate change and natural disasters, planning for resilient, sustainable, and equitable places often necessitates planning for flood risk. In the example of Hurricane Harvey, numerous articles have been written about the storm’s devastating impacts on the city of Houston, ranging from the effects of urban design and zoning to regional politics. City planners and local government are often called out for not preparing enough for these extreme events and their disastrous outcomes. One factor leading to this lack of preparation is that planners do not have access to the critical urban data and tools needed to produce actionable insights. Without those data and tools in place, the ability for public agencies and practitioners to develop effective risk and resilience strategies can be impaired.
How can planners, local governments, and community stakeholders craft smarter climate adaptation, resilience, and recovery plans for their citizens? In part two of our Planning for Resilience blog series, we’ll take a look at flood risk and explore how UrbanFootprint’s Risk and Resilience Module can support planners in their efforts to build safe, strong communities by delivering better data and actionable insights, faster.
Planning for Flood Risk
In the U.S., the Federal Emergency Management Agency (FEMA) creates nationwide flood risk maps. FEMA’s Risk Mapping, Assessment and Planning (MAP) program partners with states and communities to provide flood hazard and risk data, including the National Flood Hazard Layer (NFHL). The NFHL identifies Special Flood Hazard Areas (SFHA) that are subject to inundation by a 100-year flood, or in other words, a flood with a 1-percent chance of occurrence in any given year. Over the course of a 30-year mortgage, that means there is a 26 percent chance of having at least one flood.
FEMA maps provide a useful national standard for evaluating flood risk, yet for planners the real challenge often lies in quickly analyzing and communicating the potential impacts of flooding on current and future land use. The datasets to run these critical numbers are typically siloed and difficult to clean and curate into meaningful insights. Below we’ll walk through how UrbanFootprint helps to visualize and understand how SFHAs may affect community resiliency by quantifying the projected population, homes, and jobs impacted.
Visualizing and Analyzing Flood Risk
In UrbanFootprint, FEMA flood risk maps are provided as a reference dataset that can be easily added to current land use maps or future scenarios to provide context, build exhibits, and further analyze planning outcomes. FEMA data is also used by the built-in Risk and Resilience Module to measure the impacts of flood risk on population, homes, and jobs. Below, we’ll use the module to analyze flood risk in three U.S. cities especially prone to heavy rains and flooding: Miami, Sacramento, and Topeka.
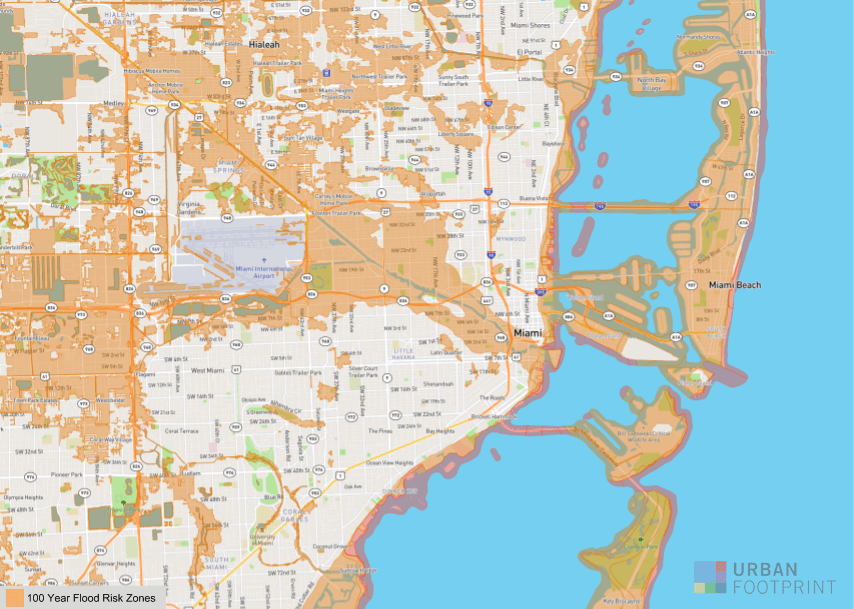
Miami, Florida
As a coastal city that also faces hurricanes, Miami is vulnerable to flooding from both sea level rise and heavy rains. Using UrbanFootprint’s Risk and Resilience Module, we can get insights about both sea level rise scenarios and flood risk concurrently. For this study, we will focus solely on flood risk.
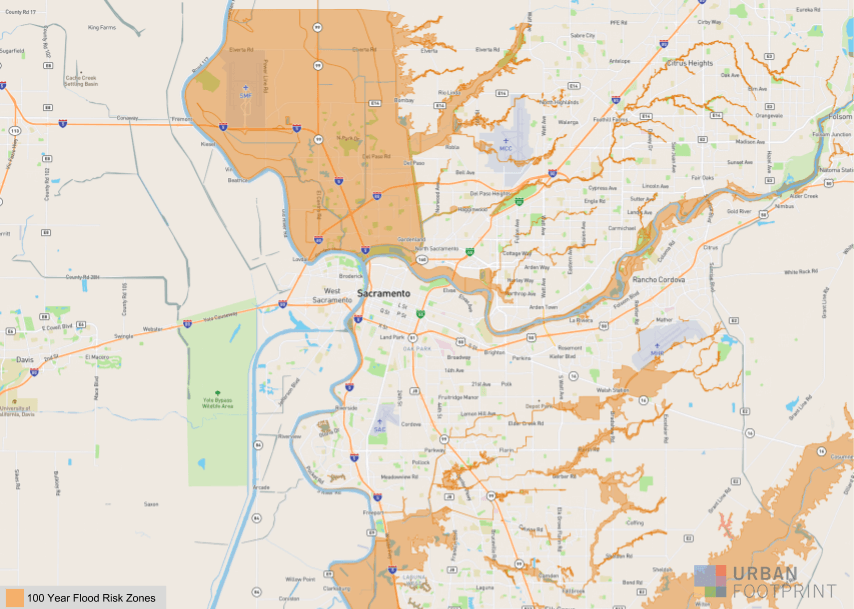
Sacramento, California
Over the past few decades, Sacramento has experienced significant, sometimes devastating, flooding, most notably in 1986, 1995, 1997, 2006, and 2017. The Sacramento Area Flood Control Agency identifies Sacramento as having the nation’s greatest metropolitan flood risk.
Topeka, Kansas
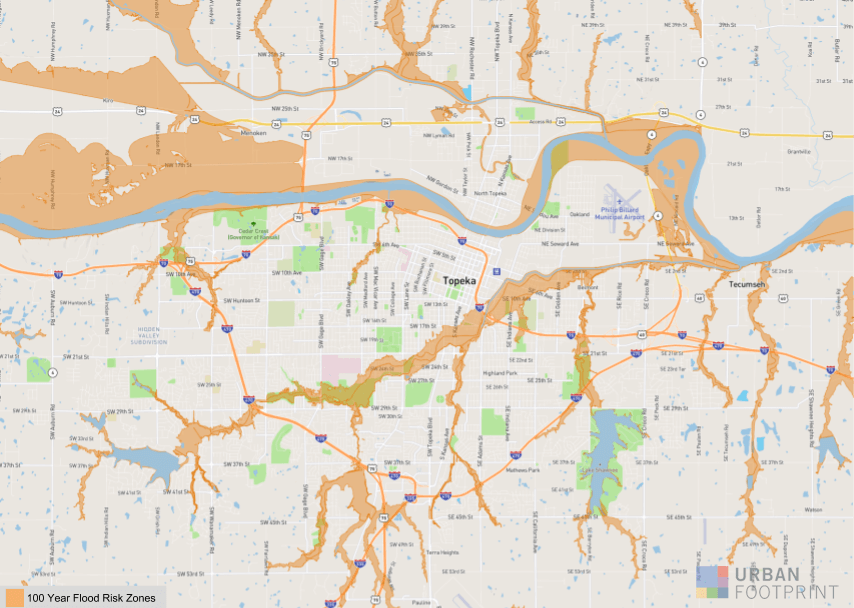
Like many midwestern cities, Topeka is prone to flooding by nearby rivers. The Kansas River flows through Topeka and during heavy downpours risks causing significant damage to homes, businesses, and city infrastructure.
The following charts compare the potential impacts of flood risk on these three cities by number of parcels, land area, population, dwelling units, and number of jobs.
Population at Risk of 100-Year Flood Impact
![]()
Our analysis shows that over 145,000 people, about a third of Miami’s current population, are at risk of a 100-year flood. Around 82,000 people in Sacramento and 4,800 in Topeka are at risk.
The Risk and Resilience Module also measures risk by FEMA’s subclassifications of Special Flood Hazard Areas. For example, in Sacramento, of the 82,000 people who are at risk, nearly all (97%) fall into FEMA’s SFHA “A99” classification. A99 areas are at risk from a 100-year flood but will ultimately be protected upon completion of an under-construction federal flood protection system, such as dams, dikes, or levees.
Dwelling Units at Risk of 100-Year Flood Impact
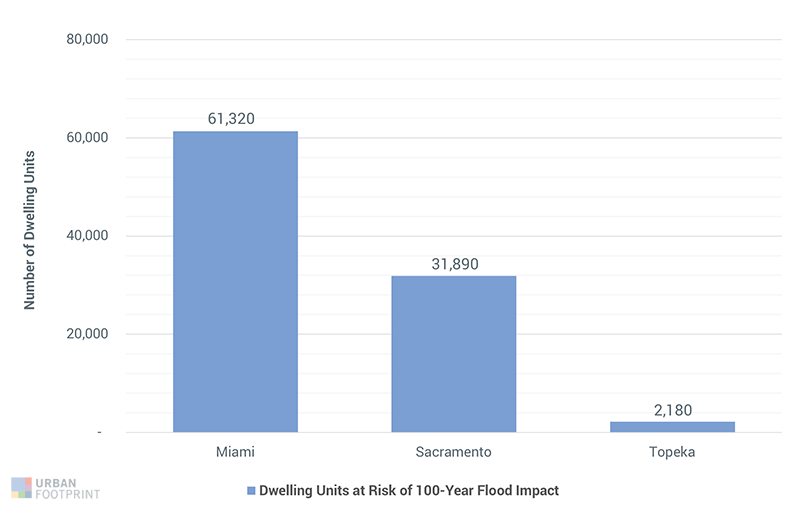
The number of dwelling units impacted follows a similar pattern as population. Over 61,000 dwelling units in Miami, nearly 32,000 dwelling units in Sacramento, and over 2,100 dwelling units in Topeka are impacted by flood risk.
Land Area at Risk of 100-Year Flood Impact
![]()
The land area at risk tells an interesting story as well. Even though the area of at-risk parcels is lesser in Miami than in Sacramento, about 7,200 acres compared to 15,600 acres, respectively, the at-risk population is much higher in Miami. This indicates a much higher population density in flood risk areas in Miami compared to Sacramento. A small increase in flood risk area in Miami impacts substantially more people and dwelling units than in Sacramento.
Jobs at Risk of 100-Year Flood Impact
![]()
About 130,700 jobs in Miami, 31,000 jobs in Sacramento and 1,300 jobs in Topeka are impacted by flood risk.
Parcels at Risk of 100-Year Flood Impact
![]()
About 16,100 parcels are impacted in Miami while around 30,600 parcels are impacted in Sacramento and 2,600 parcels are impacted in Topeka.
One important aspect to note is the above analyses only account for current land use conditions and do not factor in projected growth for population, jobs, and housing. While we will stick with visualizing flood impacts for current land use conditions for the scope of this post, demonstrating the potential future impacts of flooding is also a key component of resilience planning. UrbanFootprint’s scenario planning capabilities can support planners in their efforts to clearly communicate and effectively engage the public in exploring the costs and benefits of proposed plans or policies and why land use planning plays an important role in mitigating flood risk.
While the Risk and Resilience Module currently runs on FEMA data, the module is designed to adapt and can use new datasets as they become available. If you have a new or regional flood risk dataset you’d like to run in the Risk and Resilience Module, let us know. We’d love to hear your thoughts.
How Did We Get These Numbers?
To illustrate how we pulled these numbers together, let’s walk through the step by step process of running a flood risk resiliency analysis in UrbanFootprint.
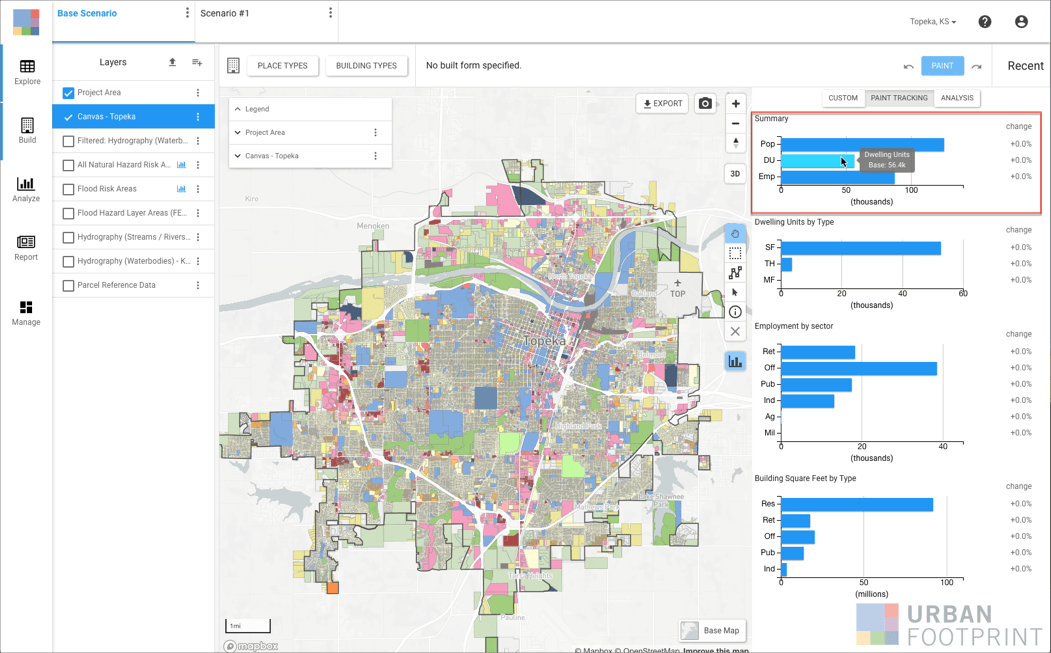
First, start by creating a project and defining the work area you’d like to study. In this case we’ll start with Topeka, KS.
In less than a minute, the Base Canvas will load to display the current parcel land use data for the project area. After clicking Build Mode, one can also view charts summarizing population, housing units by type, employment by sector, and building square feet by type.
Next, switch to Analyze mode and click the blue globe icon to run the Risk and Resilience Module. To evaluate flood risk, the module references FEMA’s flood risk maps and assesses risk by Special Flood Hazard Areas (SFHAs).
Once the module completes the analysis, the module reports the parcel area, the number of parcels, and the associated dwelling units, population, and jobs at risk for each special flood hazard zone. Users can also map the impacted parcels alongside other datasets in the reference layer list.
Planners and community stakeholders can also take the analysis one step further with UrbanFootprint’s scenario building capacity. With the ability to easily draft future land use alternatives, practitioners can compare multiple scenarios and their respective outcomes with the Risk and Resilience Module.
Data-Driven Planning
We hope with reduced friction to obtaining, cleaning, and processing meaningful flood risk insights, planners will be better equipped to design data-driven climate adaptation and recovery plans for communities nationwide. The Risk and Resilience Module, which also includes data and analytical capability for sea level rise and fire, helps planners understand and communicate the current and potential future impacts of natural disasters, extreme weather, and climate change.
Curious to see UrbanFootprint in action? Request a custom demo with our team or sign up for a free trial to get started. Stay tuned for more installments of our Planning for Resilience blog series. In the meantime, feel free to tweet or email us your thoughts and questions.
Note: UrbanFootprint map images are supported by © Mapbox and © OpenStreetMap.
