


If you’re interested in creating a project like this, let us know!
As cities nationwide are feeling the increasing impacts of climate change, extreme weather, and natural disasters, urban planners are on the frontlines working to safeguard their communities from these challenges.
In addition to the everyday tasks of planning for sustainable, equitable, and economically strong communities, planners must now simultaneously tackle the imminent ramifications of climate change to ensure the design of safe, resilient cities.
In response, UrbanFootprint’s Risk and Resilience Module helps planners and communities better prepare for the projected impacts of sea level rise, flood inundation, fire hazard, and more. By arming planners and community stakeholders with the tools they need to quantify and illustrate the impacts of climate change on populations, job centers, infrastructure, and beyond, it’s our hope data-driven conversations and increased transparency will accelerate the adoption of essential community resilience plans.
In the first installment of our new Planning for Resilience blog series, we’ll cover the critical issue of sea level rise and coastal city planning.
Planning for Sea Level Rise
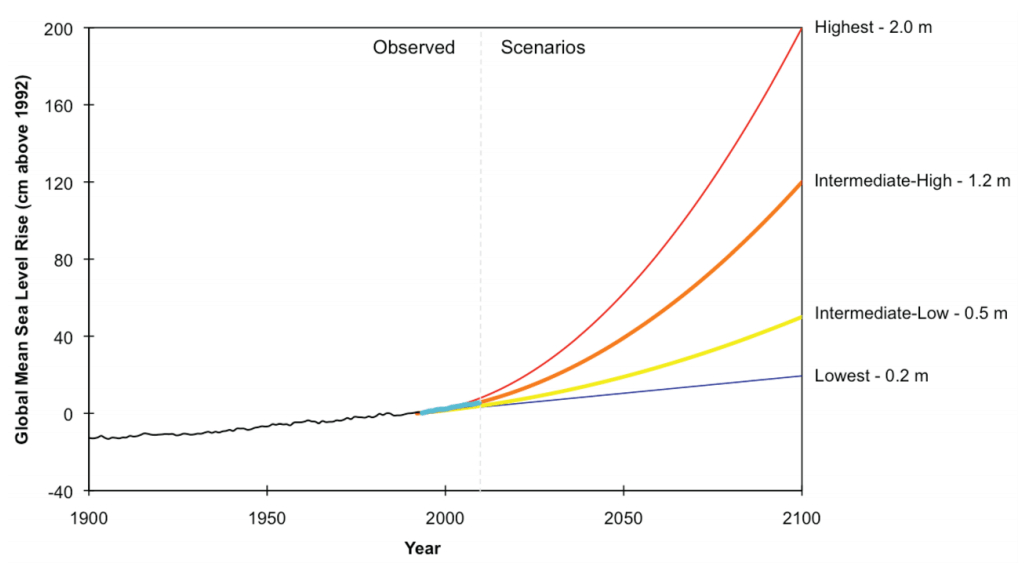
Perhaps the most common topic of the climate resilience discussion, both for those who reside in cities and for those who plan for them, is sea level rise and its impacts on cities and communities along our coastlines. The New York Times reported 2017 to be the most expensive year for insurers, who are paying for liabilities attributed to natural hazards caused by anthropogenic climate change or otherwise. Local and regional governments increasingly view these threats as contingencies that should be integral to the urban planning process, especially those that spur changes to land use or the introduction of infrastructure that’s essential to the safety and economic livelihood of residents.
In this post, we’ll use the UrbanFootprint Resilience Module to evaluate and illustrate the projected outcomes of sea level rise on coastal city populations, job centers, and housing infrastructure.
Analyzing Sea Level Rise in Honolulu, Tampa, and Charleston
We used UrbanFootprint to evaluate the impacts of sea level rise on three coastal cities: Honolulu (HI), Tampa (FL), and Charleston (SC). We started by using UrbanFootprint’s built-in data to map the likely progression from existing conditions to the National Oceanic and Atmospheric Administration’s (NOAA) estimate for an anticipated six-foot sea level rise by 2100.
Below, we see the effects of sea level rise in one-foot increments on Tampa, Florida.
In UrbanFootprint: Mapping projected impacts of sea level rise in Tampa, Florida.And the projected impacts on Charleston, South Carolina.
In UrbanFootprint: Mapping projected impacts of sea level rise in Charleston, South Carolina.And finally, the estimated outcomes of sea level rise in the central Primary Urban Center (PUC) of Honolulu, Hawaii.
In UrbanFootprint: Mapping projected impacts of sea level rise in Honolulu, Hawaii.While these maps present dramatic impacts, we wanted to further evaluate the outcomes of sea rise in these communities. We used UrbanFootprint’s built-in data and Resilience Module to quantify the population, employment, and property impacts of these sea rise scenarios.
A six-foot sea rise scenario sees about 24,200 acres impacted in Charleston, while Tampa is expected to see over 6,100 inundated acres. The Honolulu PUC is estimated to see nearly 3,100 inundated acres in a six-foot sea rise scenario.
More than 13,600 properties in Charleston are at risk in a six-foot sea level rise scenario, with over 8,400 and 3,300 parcels at risk in Tampa and Honolulu, respectively.
The six-foot sea level rise projection indicates about 19,700 residents of Tampa, 33,700 residents in Charleston, and 90,700 residents of Honolulu would be affected by rising seas in 2100.
About 8,800 homes are at risk in Tampa under a six-foot rise scenario. More than 16,500 homes are at risk in Charleston, and roughly 33,400 homes in Honolulu are at risk in a six-foot scenario.
With a six-foot sea level rise, an estimated 21,700 jobs in Tampa would be affected, nearly 38,400 in Charleston, and about 84,400 jobs Honolulu would be at risk.
When we compare the market value, encompassing land and improvement value of inundated properties, all three cities surpass $1 billion in total property value at risk with a four-foot sea level rise scenario. At six-feet, Honolulu sees major increases in property value at risk with more than $13 billion of potential impact in a six-foot rise scenario.
Note that, for the purposes of this post, this analysis only accounts for the impacts of NOAA’s anticipated sea level rise scenarios on present land use conditions. It does not account for potential changes to future land use or a projected increase or decrease in development. UrbanFootprint can be used to build and analyze the impact of future land use scenarios, but the impacts on current conditions already demonstrate the need for proactive planning to address climate resilience. The ability to illuminate this challenge and clearly convey the numbers behind this threat can facilitate informed discussions within the community and a smarter path forward to a prosperous future.
How Did We Get to These Numbers?
Finding and wrangling the right data to assess the potential outcomes of sea level rise is a process that typically takes days or even weeks. UrbanFootprint’s extensive data library and powerful analytics modules streamline this process to clearly map and evaluate impacts in a matter of minutes. To illustrate how we pulled these numbers together, let’s walk through the step by step process to running a sea level rise resilience analysis in UrbanFootprint.
First, start by creating a project and defining the work area you’d like to study. In this case we’ll start with Tampa, Florida.
In less than a minute, the Base Canvas will load to display the current parcel land use data for your selected area along with charts that summarize population, housing units by type, employment by sector, and building square feet by type.
Next, switch to Analyze mode and click to run the Resilience Module. To evaluate sea level rise, the Resilience Module references NOAA’s sea level rise data and assesses risk associated with different sea-rise levels, including the parcel area, the number of parcels, and the associated dwelling units, population, jobs, and land value.
Once the Resilience Module completes the analysis, we’re now able to map inundated parcels in one-foot increments and view the corresponding effects on population, homes, jobs, and more. We can also update the map style with just a few clicks to edit the look and feel of map symbology.
Planners and community stakeholders can also take the analysis one step further with UrbanFootprint’s scenario building capacity. With the ability to easily draft future land use alternatives, practitioners can compare multiple scenarios and their respective sea level rise outcomes with the Resilience Module.
Data-Driven Resilience Planning
Planning for city resilience is now an essential component to fostering an environmentally sound, socially equitable, and economically strong future for our communities. By removing the data obstacles and reducing the cost hurdles associated with running sea level rise analyses, we hope to enhance conversations surrounding climate change preparedness and open the door for more practitioners, communities, and advocacy groups to participate in advanced resilience planning. As we come together to build a future vision for our communities, unlocking the data to forecast the potential outcomes of sea level rise and mapping the expected trajectory of the changing environment will illuminate the path to creating healthy and thriving places.
Curious to see UrbanFootprint in action? Request a custom demo with our team or sign up for a free trial to get started. Stay tuned for more installments of our Planning for Resilience blog series. We’ll be covering more key resilience topics like spatial risk assessment for floods, fire, earthquakes, and beyond. In the meantime, feel free to tweet or email us your thoughts and questions.
