


If you’re interested in creating a project like this, let us know!
Corporate site selection involves an iterative analysis of several costs, benefits, and trade-offs through a geospatial lens. Today’s companies want to be sure their next location will be cost-effective, attractive to top talent, and supportive to long-term business growth. Without the right tools at your disposal, this type of analysis typically requires extensive knowledge in both data science and GIS, and often demands a time-intensive data collection process. In this blog, we’ll show you how UrbanFootprint helps businesses analyze location decisions for expansion or relocation with no GIS training required.
Ready to get started? Read on to learn how UrbanFootprint supports corporate real estate and urban planning teams with intuitive mapping and geospatial query tools, an extensive data library, and advanced analytics. We’ll walk through an example analysis for corporate site selection, including how to optimize for development cost and attracting target employees.
The premise: Your company wants to explore potential locations for a new corporate campus
For the purposes of our site selection analysis walk-through, let’s say you work on the planning and real estate team for a Fortune 500 company looking to find it’s next office location. Spurred by a combination of Indianapolis’s relatively low-cost real estate, central location, skilled labor force, and favorable business policy, your company would like to explore expanding their corporate footprint there.
As a business analyst on the team, you’ve been tasked with identifying potential sites, determining their suitability, and assessing development impact. In choosing a new office location your company wants to optimize for the following considerations:
- The new corporate office is within the city of Indianapolis
- Site development cost is reasonable
- Accommodation of 1,000 employees today with room to double in the next decade
- Office location is attractive to target employees (college-educated knowledge workers, 25-44 age range)
- The campus is well-serviced by public transit
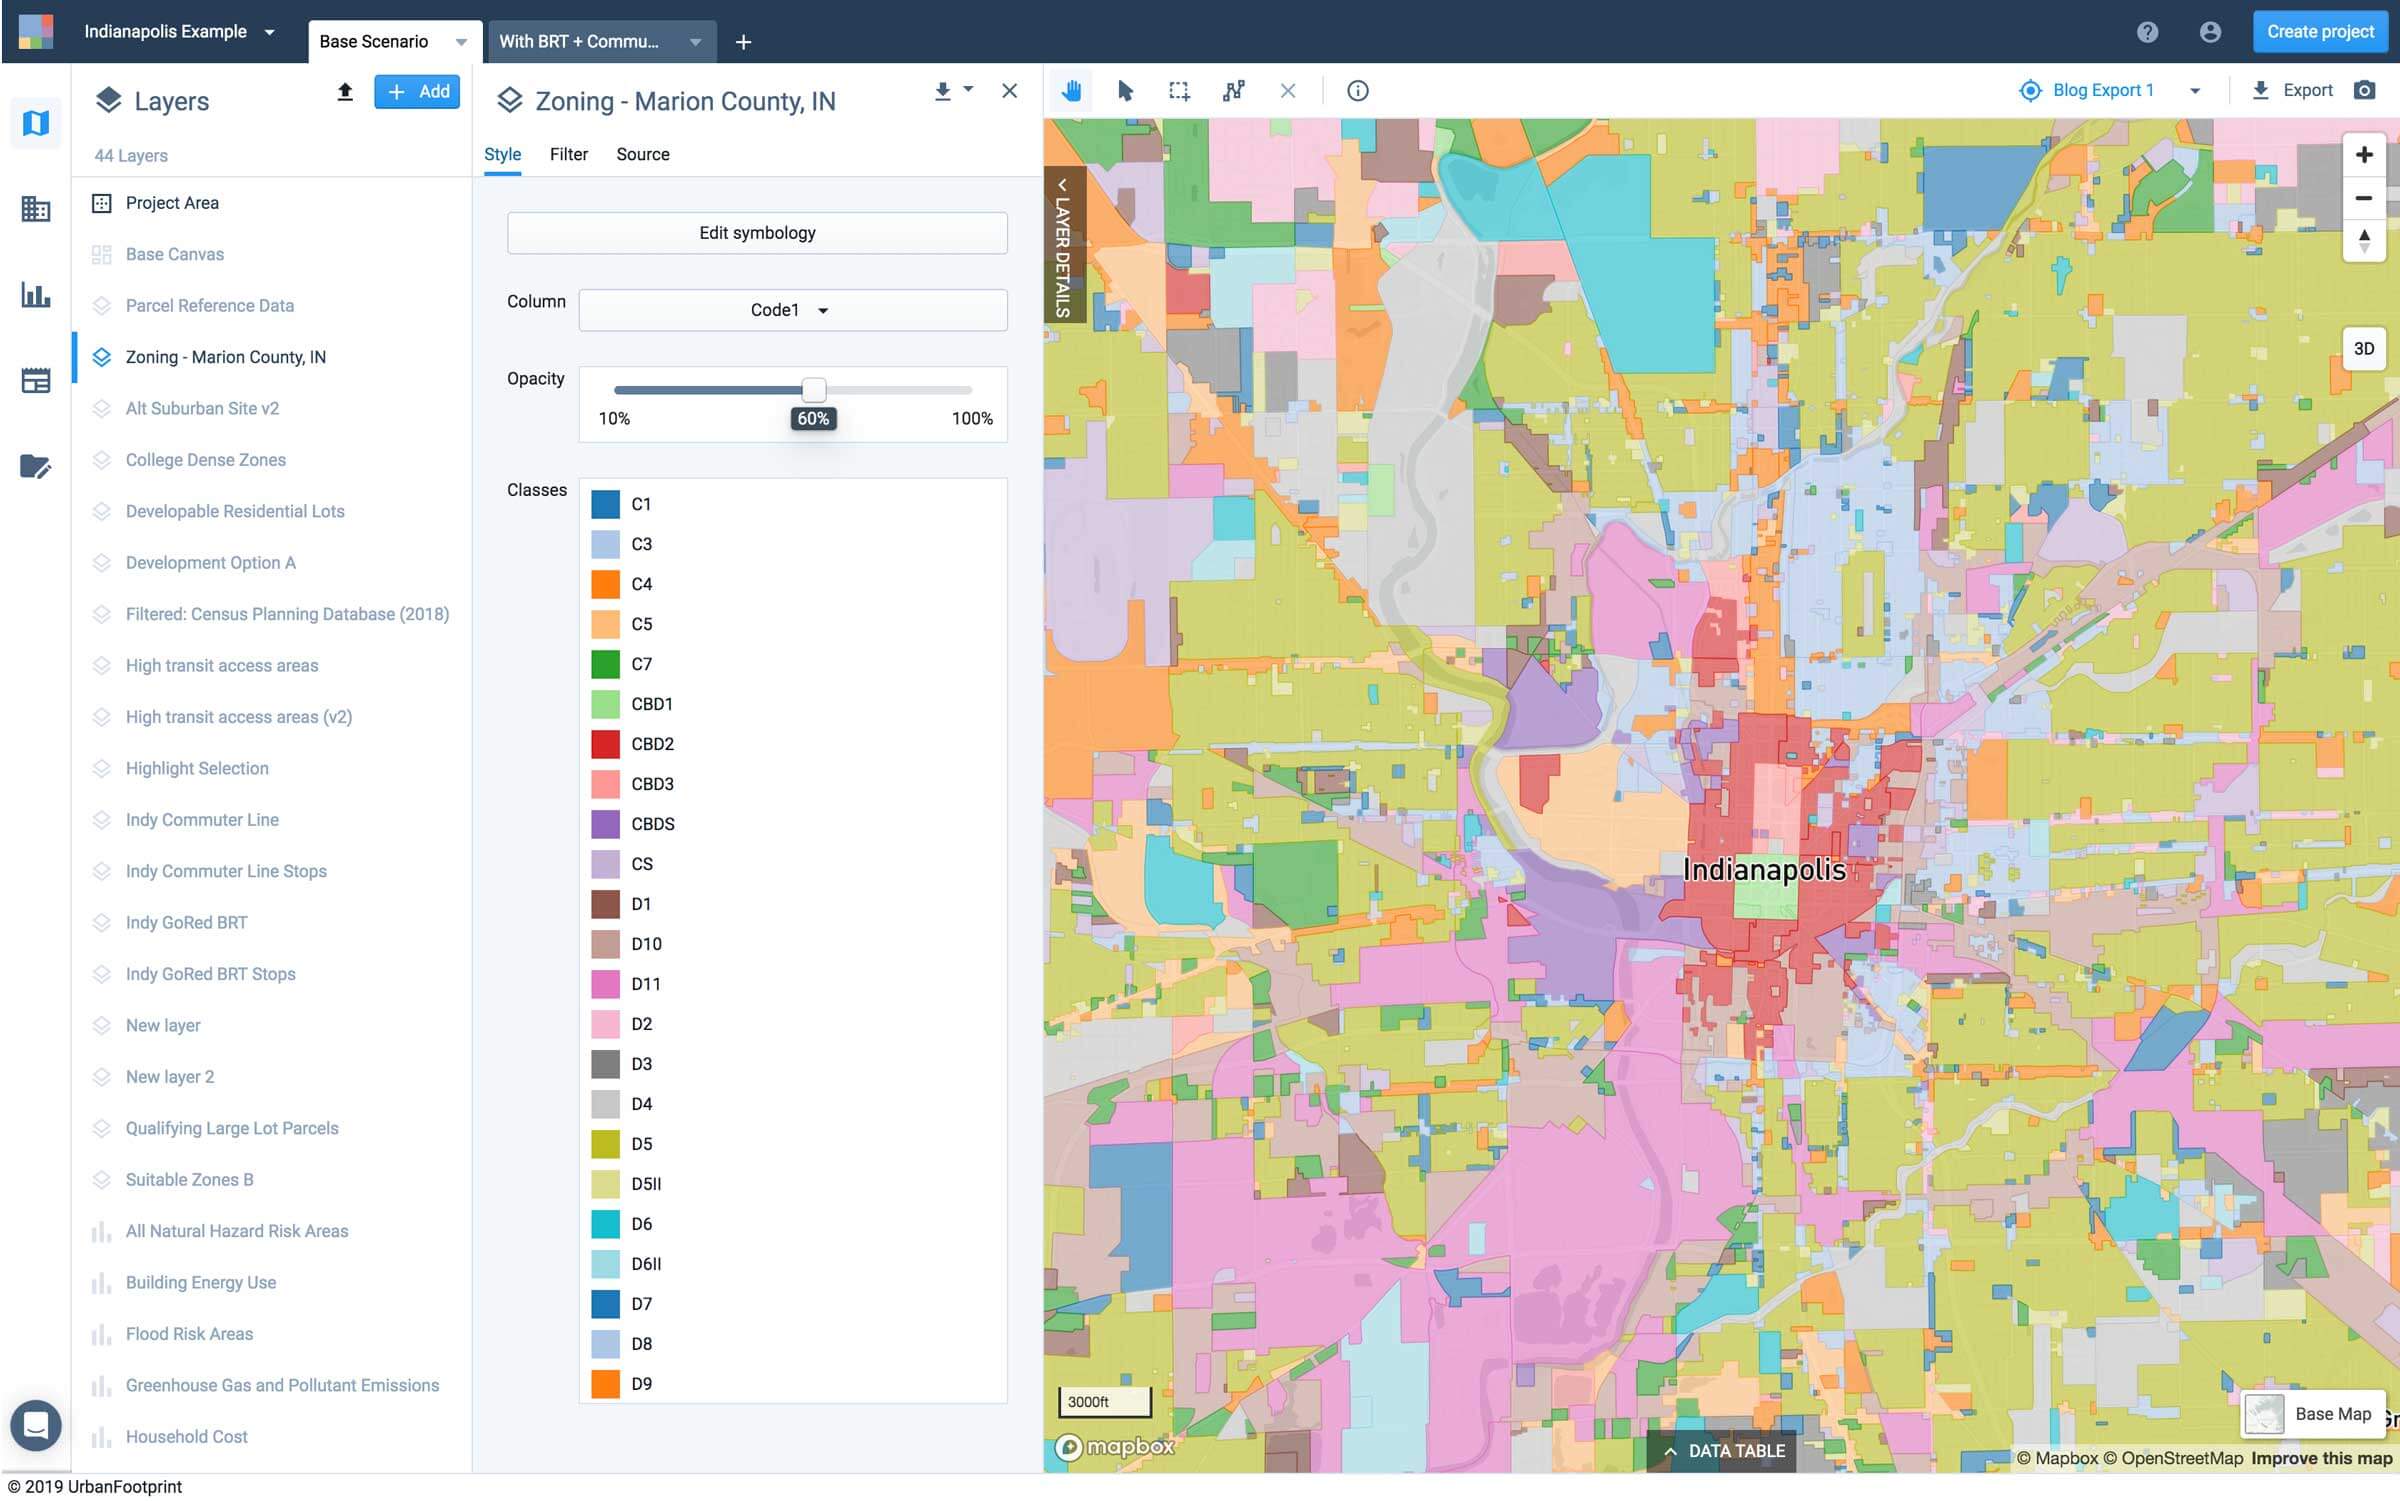
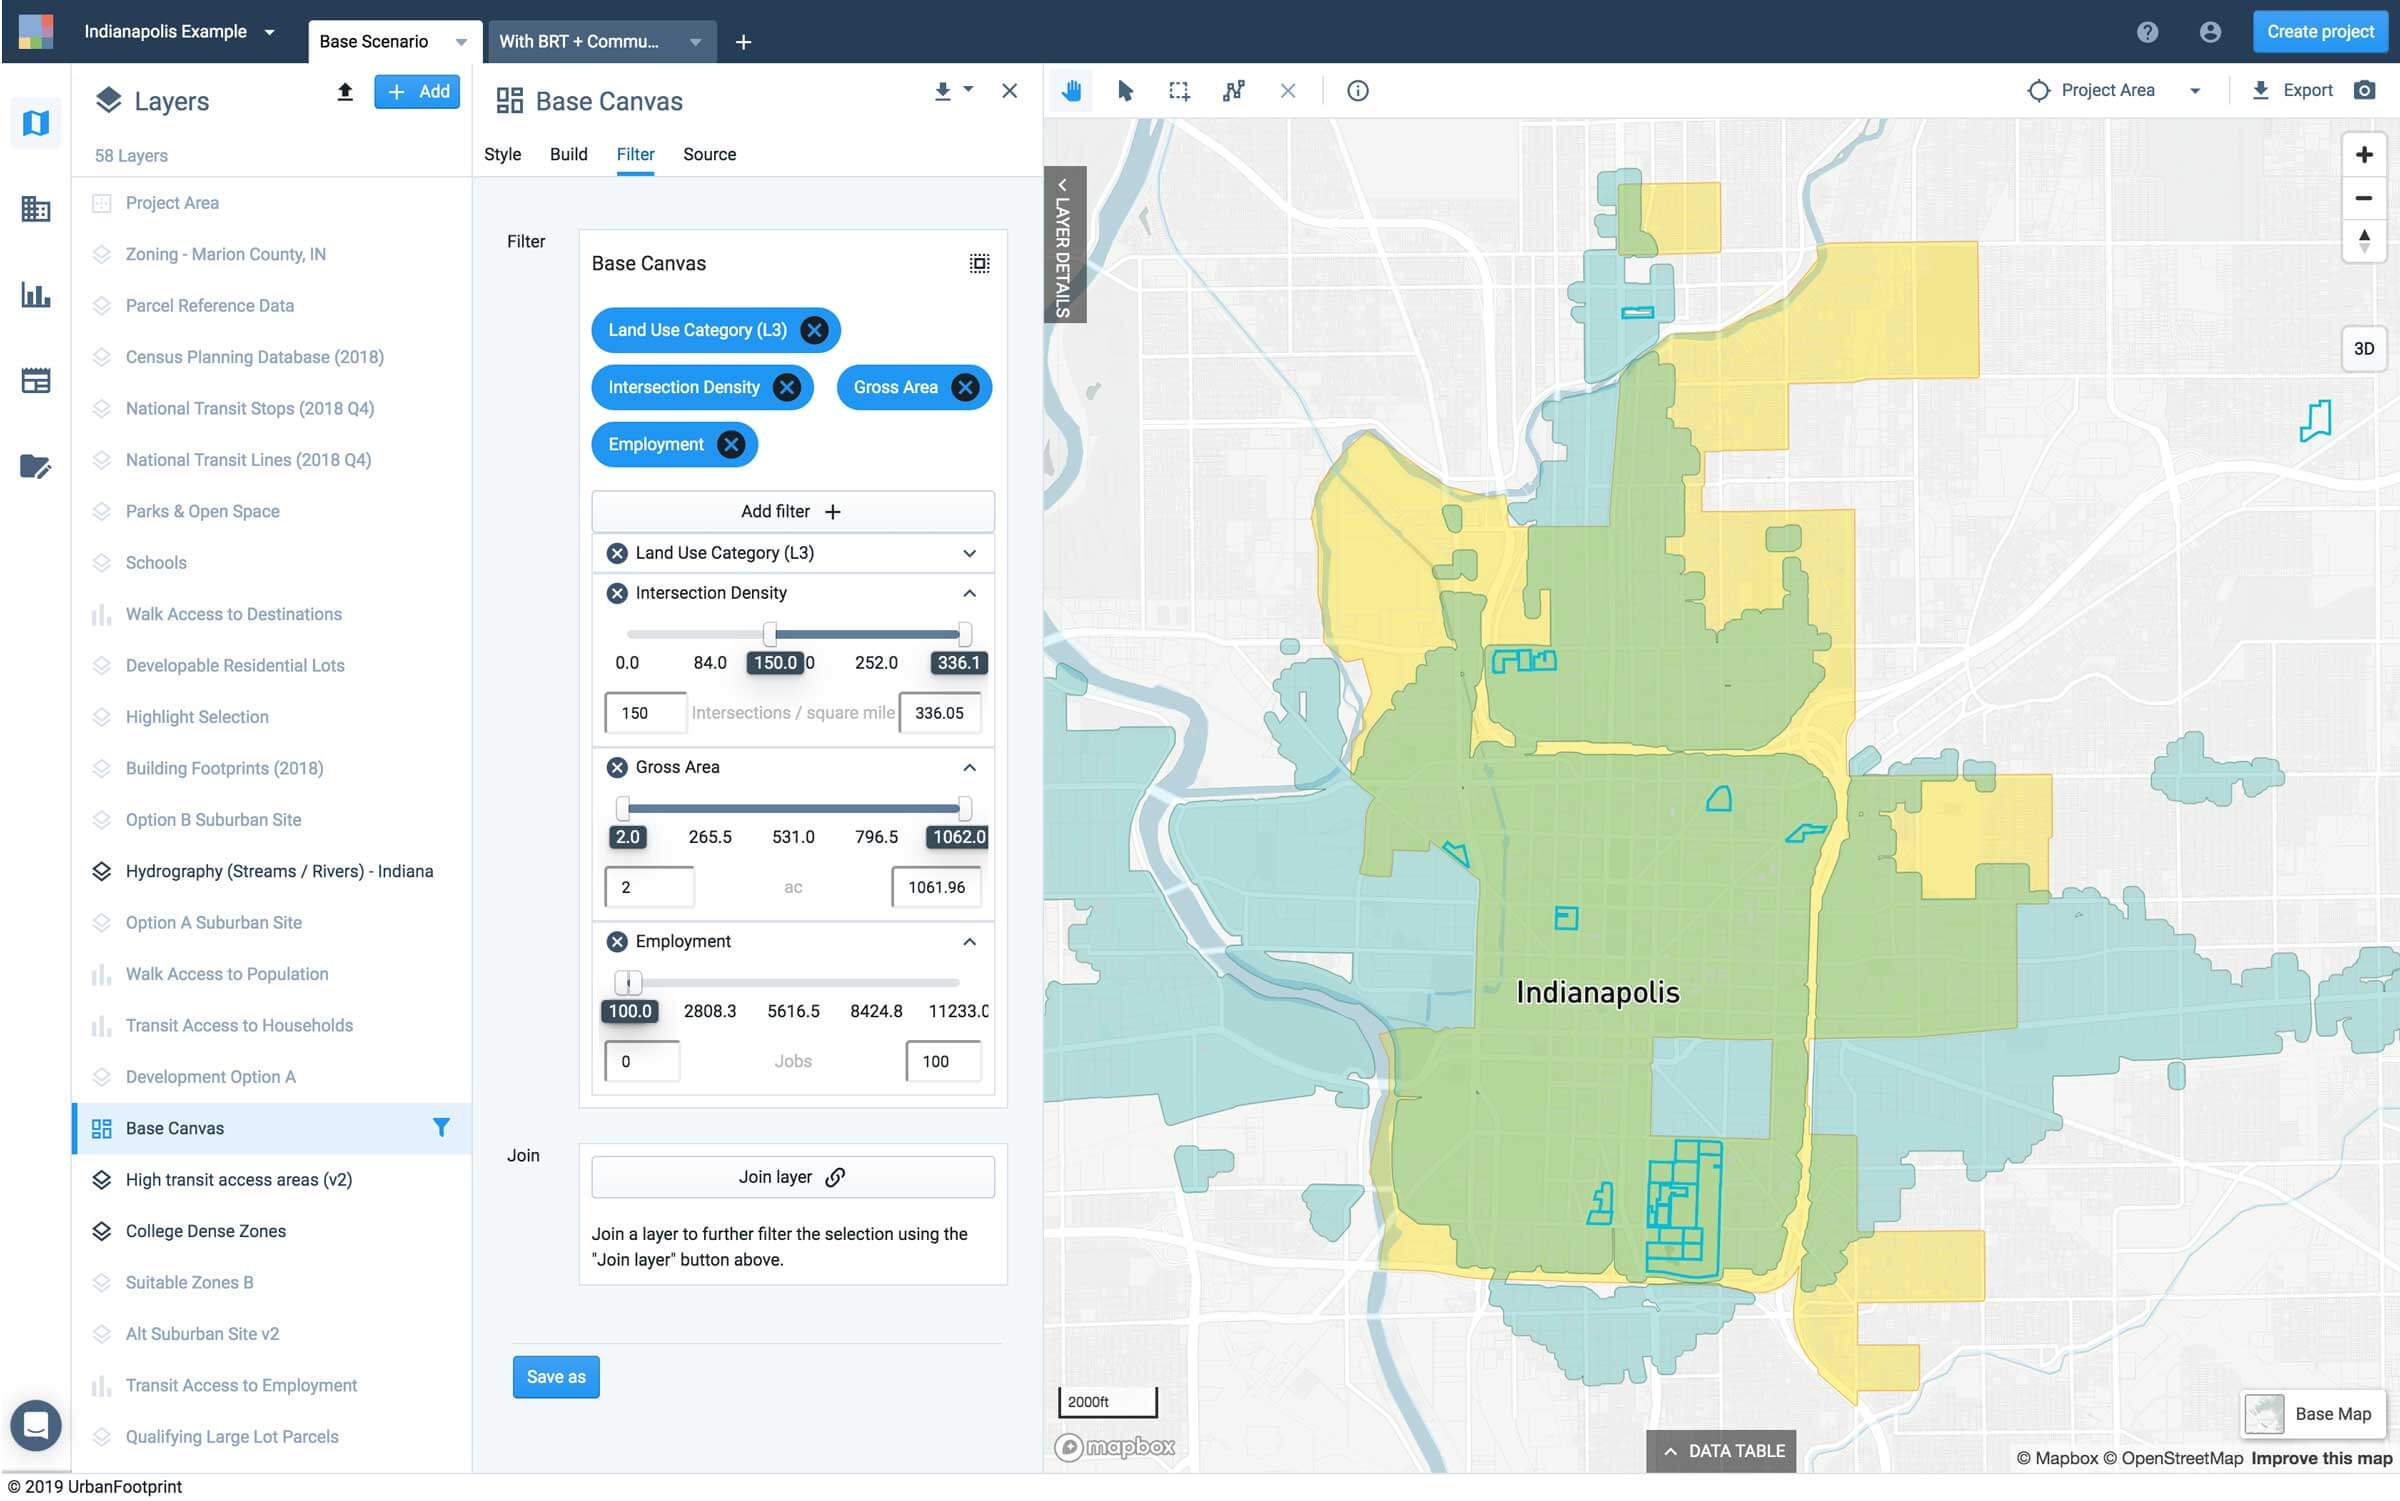
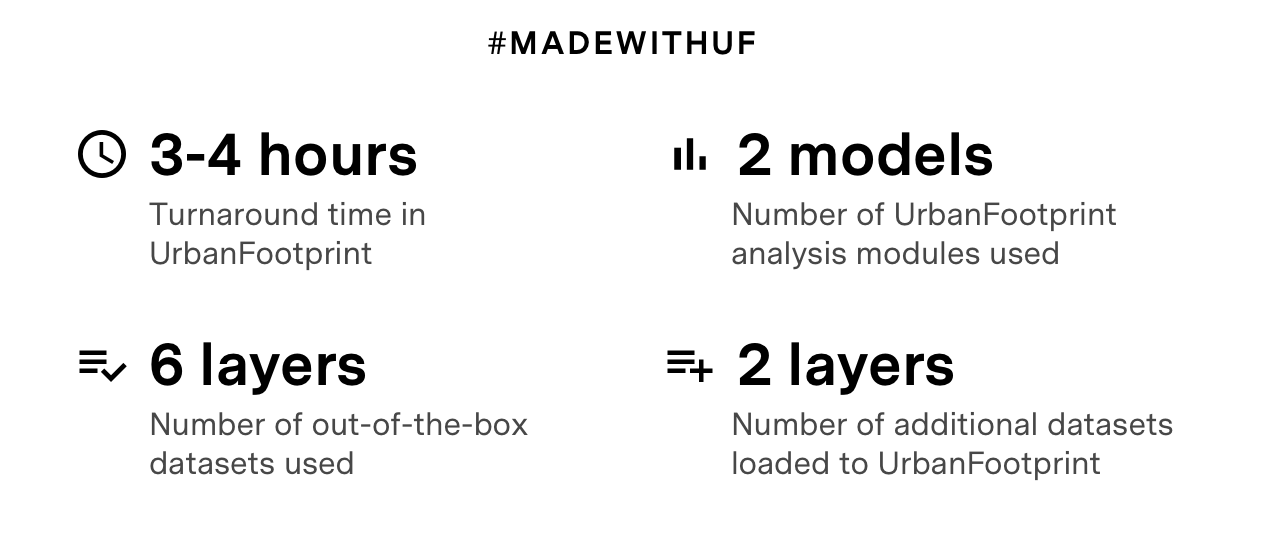
To kick off the analysis in UrbanFootprint, we’ll first create a parcel-scale project in Indianapolis. The resulting UrbanFootprint workspace includes 200,000+ parcels and a few dozen pre-curated reference datasets detailing current land use and a number of key existing conditions factors, like population, residential and employment characteristics, intersection density, and more.
Let’s dive into the site selection analysis
Now that our project is set up, we can use UrbanFootprint to ask a series of business questions using intuitive query and join operations to progressively narrow down potential locations, identify promising sites, and assess development impacts for the larger city and region. In our example, we’ll focus on UrbanFootprint workflows that will help your company understand which location choices would optimize for lower development cost while also attracting top talent.
Approach A: Optimize for development cost
Where is it most cost-effective to build a corporate campus in Indianapolis?
Question 1: Where are cost-effective parcels? We can determine cost-effective locations by identifying parcels that match the following criteria:
- Large parcels
- Low cost per acre market land value
- Near a freeway
- Will comply with current zoning
Step 1: Property values
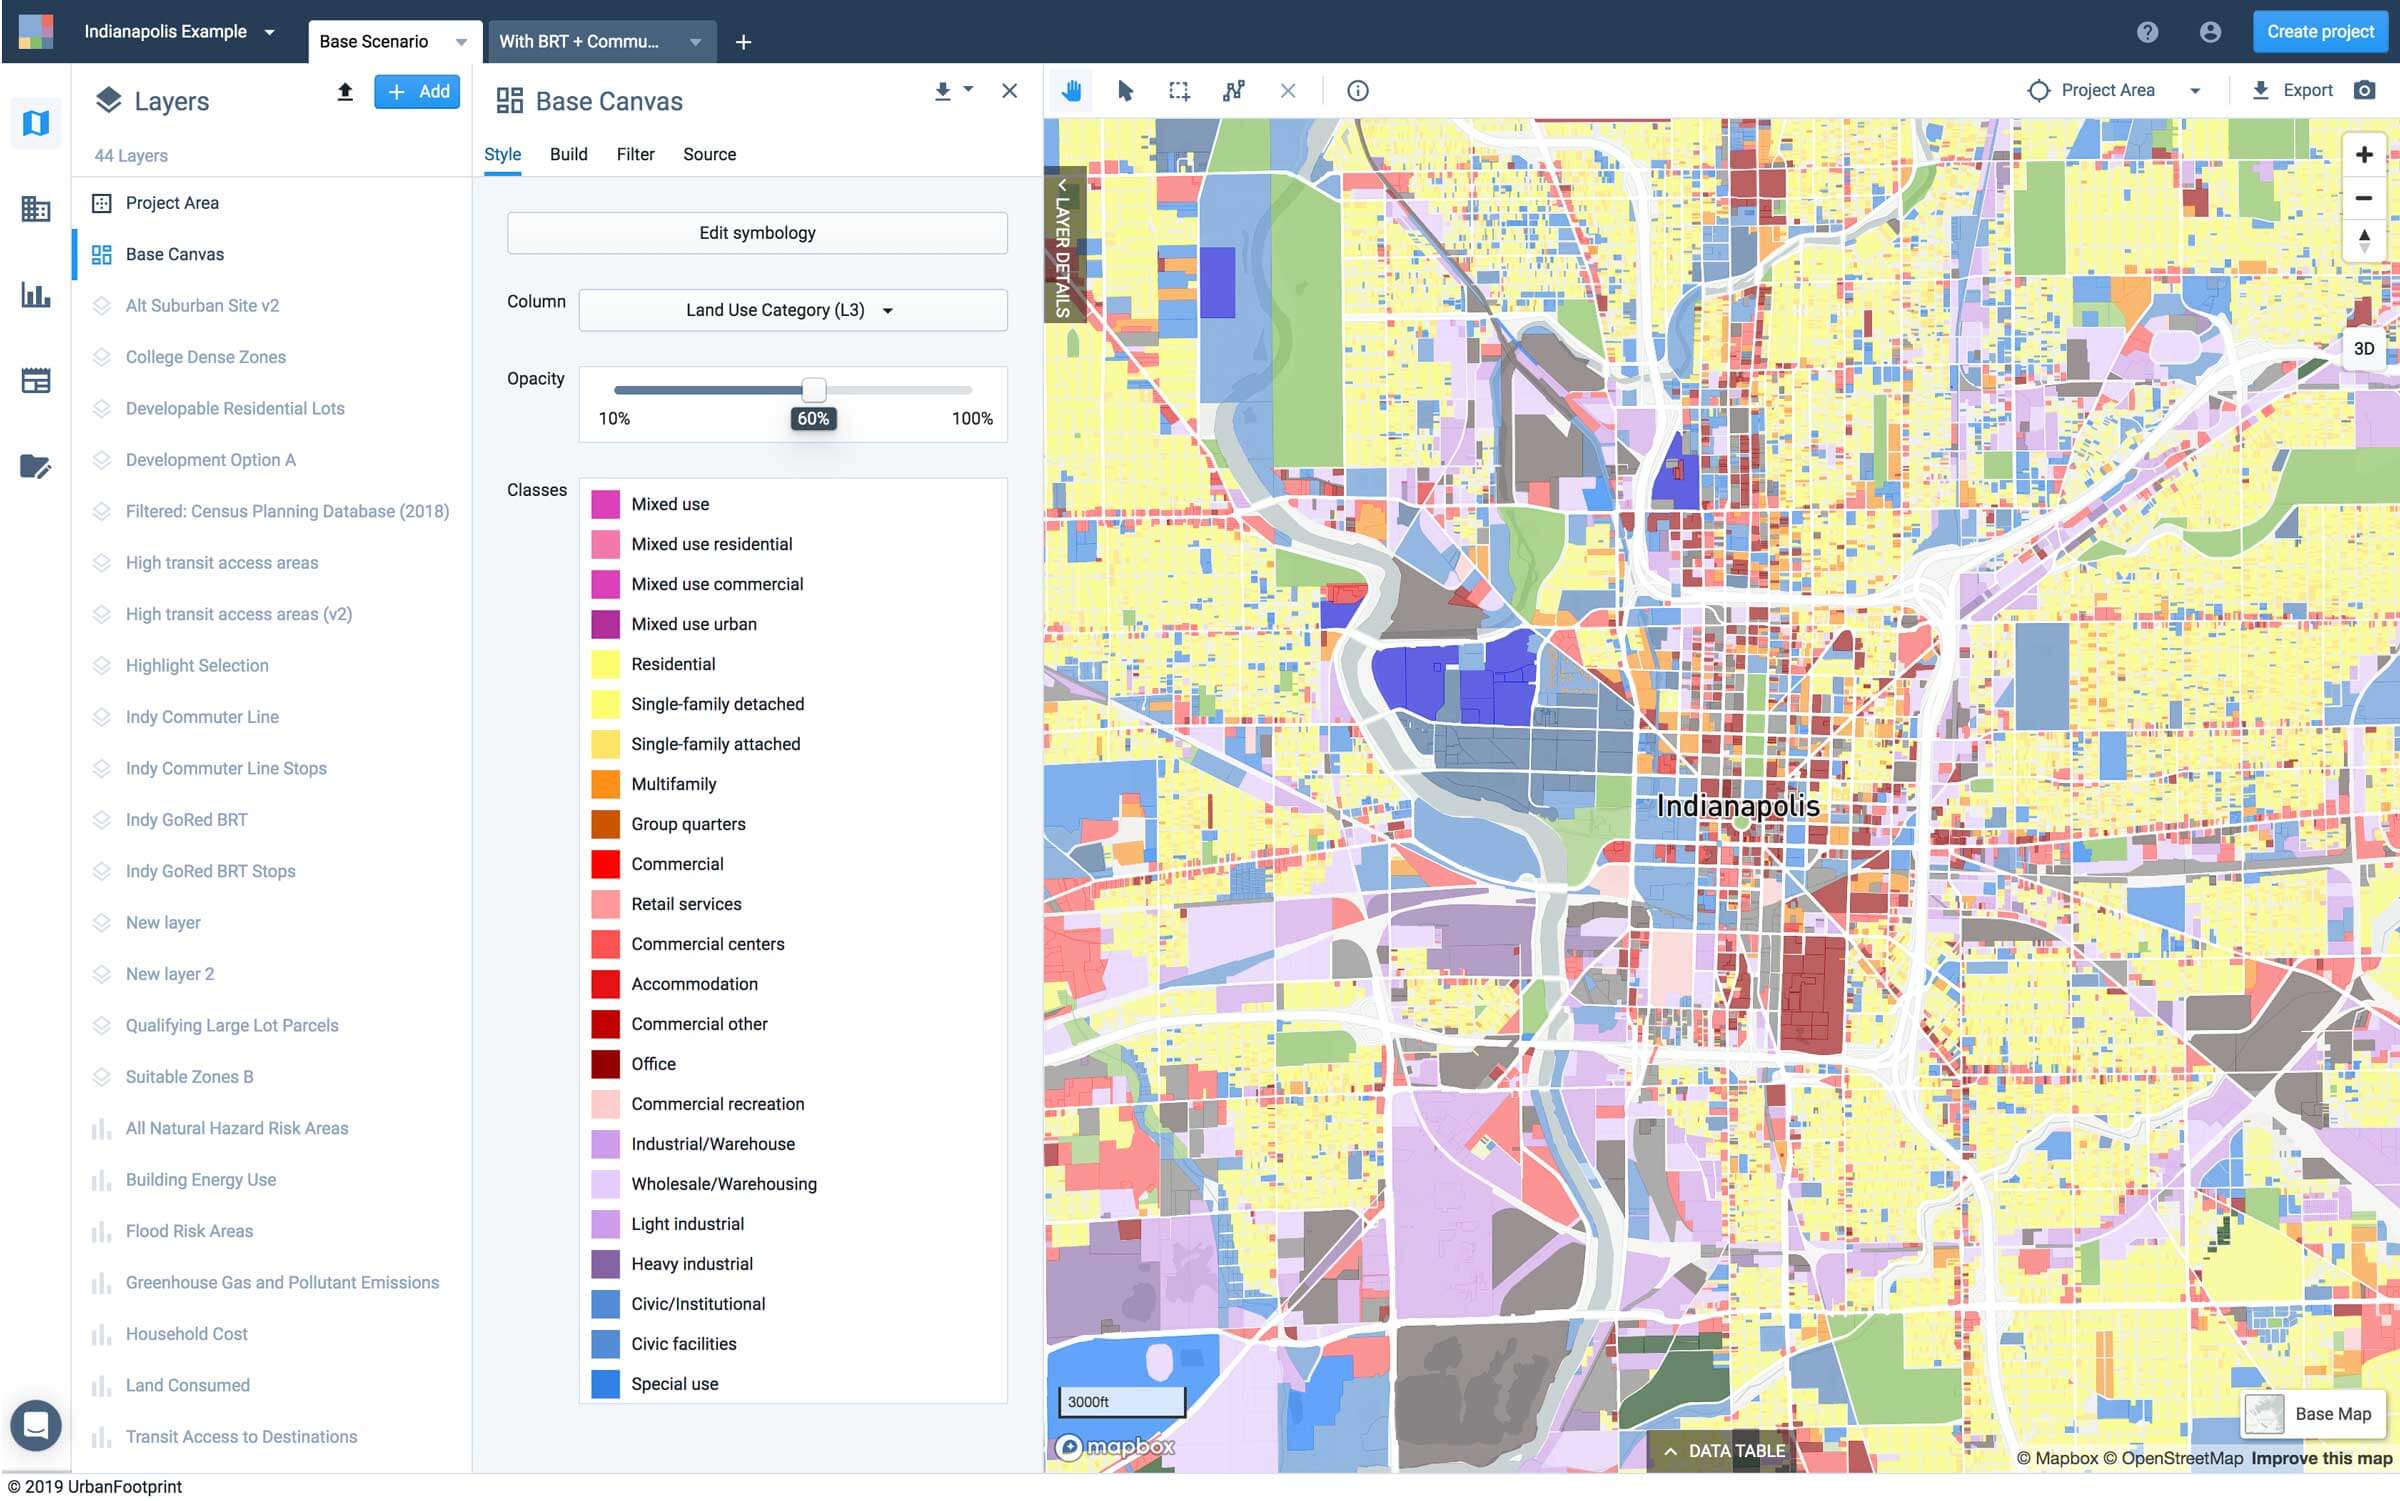
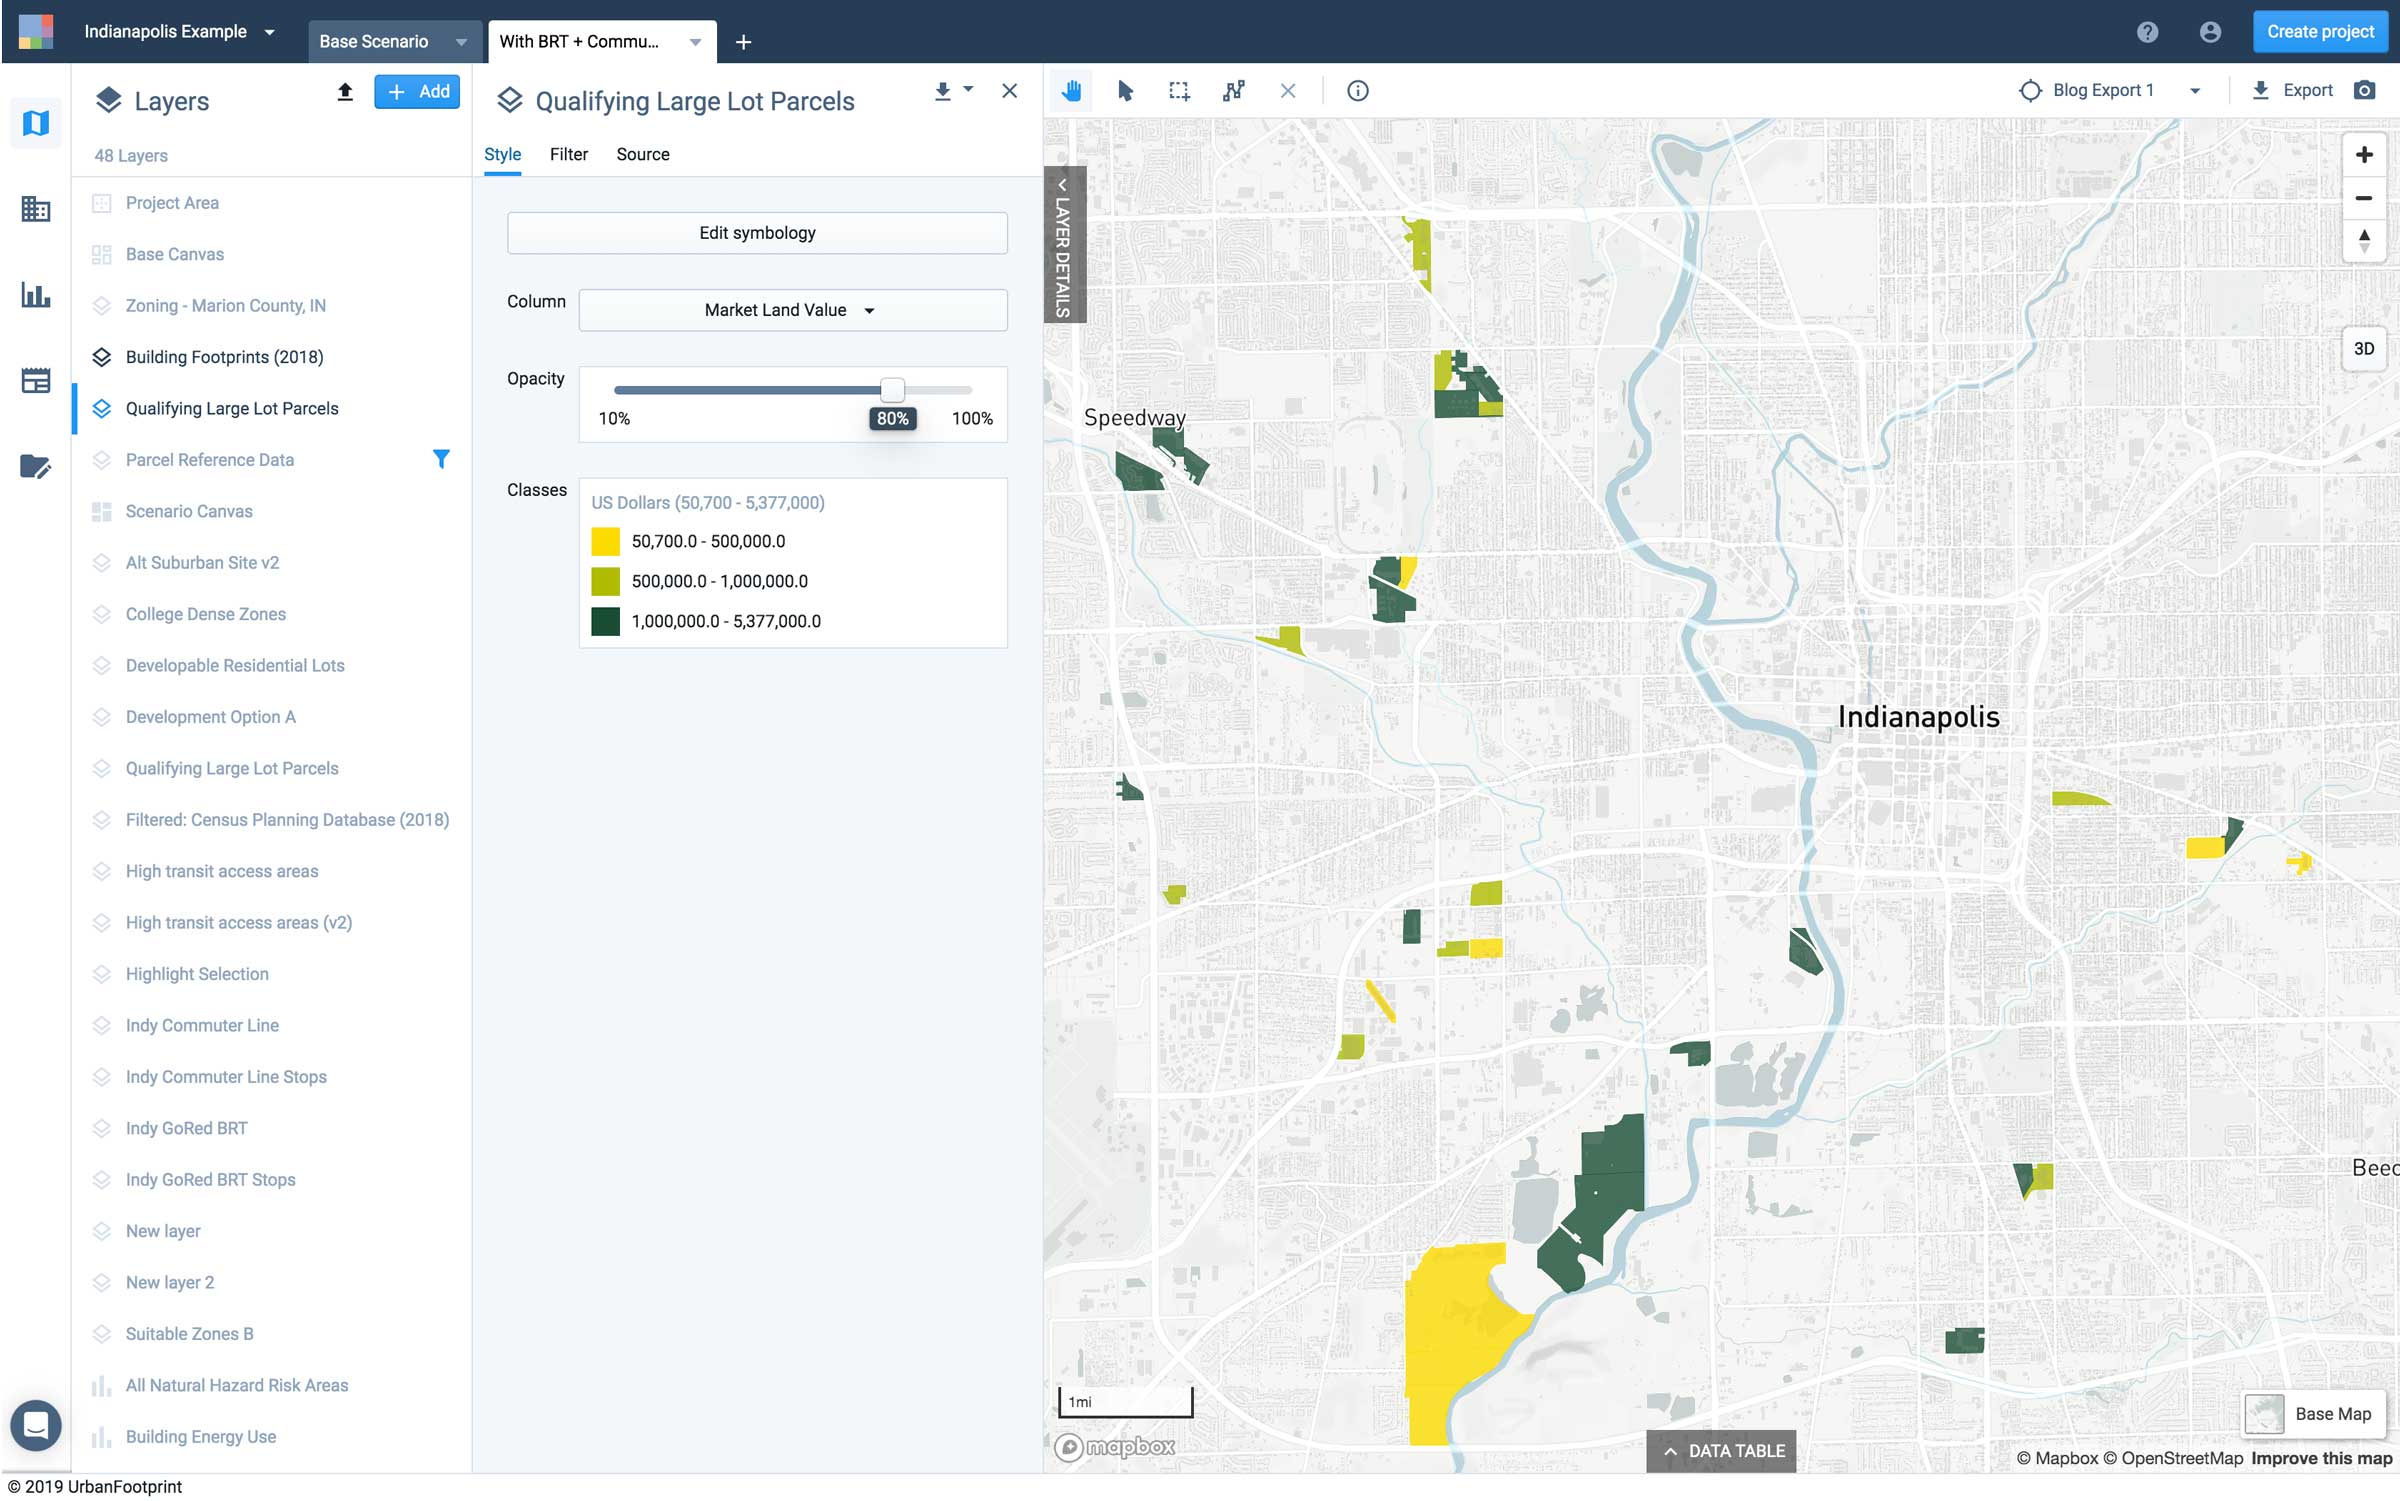
Let’s start by looking at the total property value of parcels. As shown below, we can use UrbanFootprint’s symbology features to produce a choropleth map for total property value of parcels in Indianapolis.
Lower value parcels are colored lighter shades of green and higher value parcels are colored darker shades of blue. You can also use this layer to further examine tax assessment, land value, and other key data.
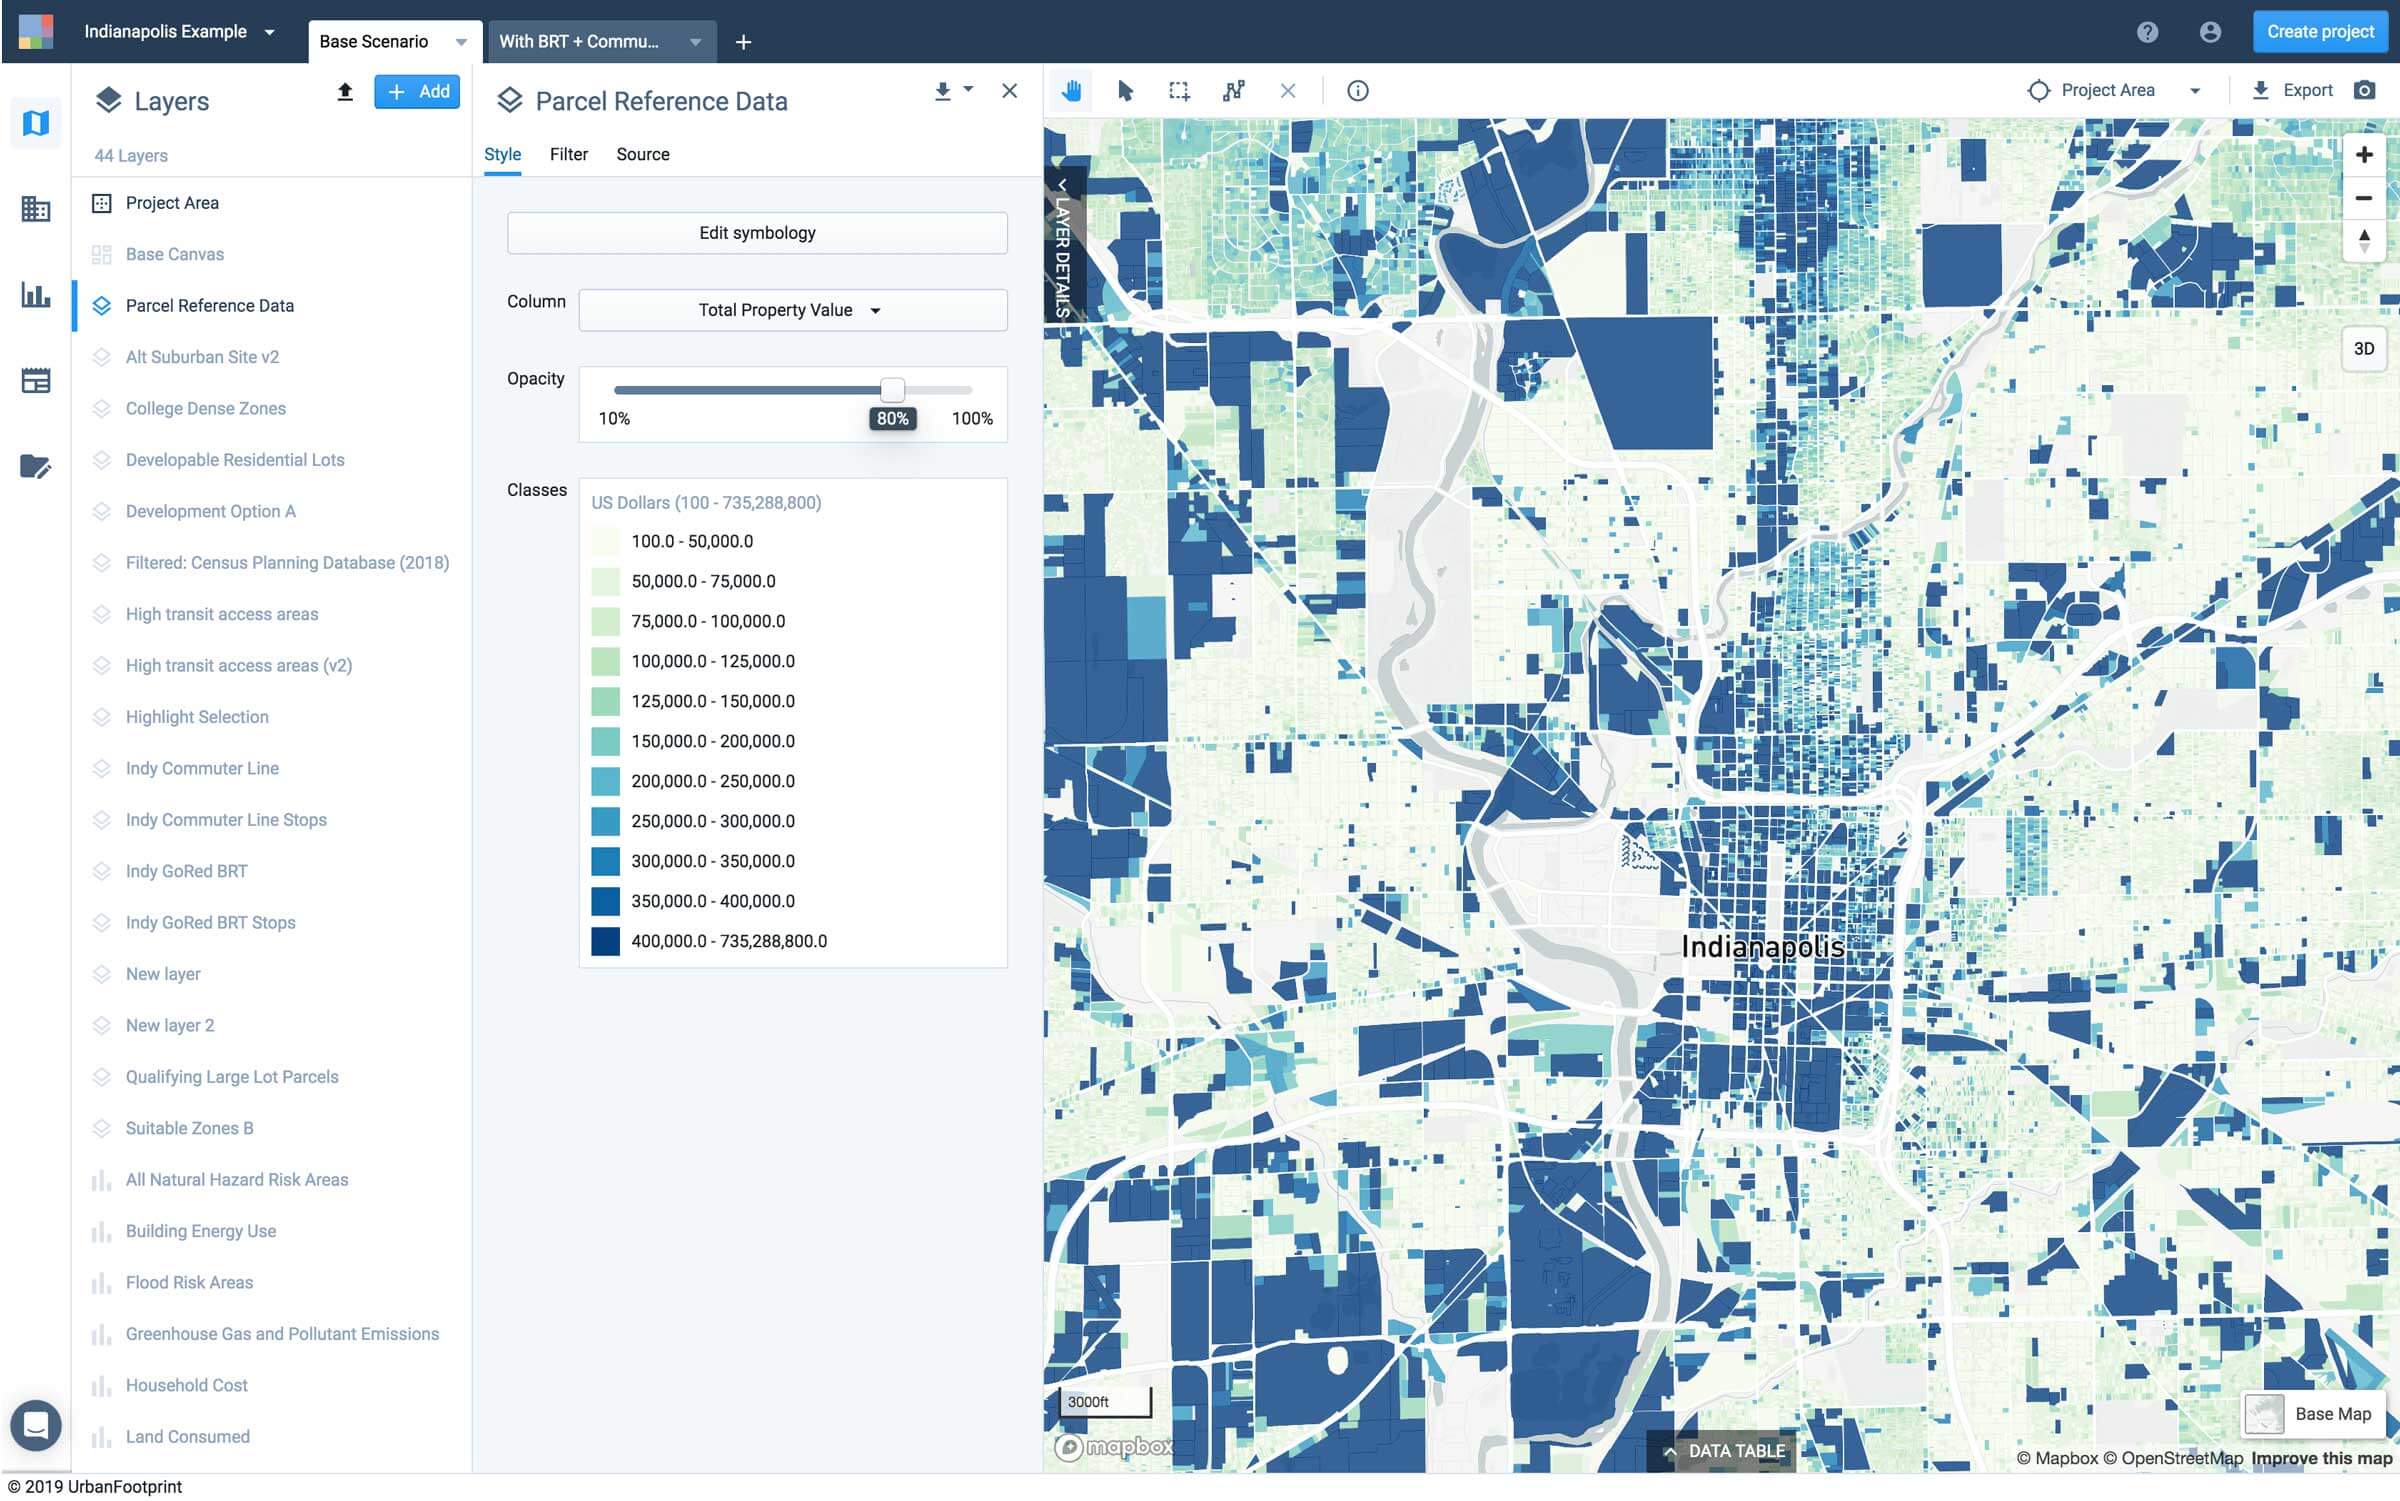
Step 2: Zoning
Next, let’s examine current zoning1 to identify development constraints. Understanding where current zoning regulations allow for commercial office land use and the density of a corporate office is an important step in identifying viable parcels for your new office location. Complying with current zoning can make site selection speedier and more efficient. For large companies looking to expand while under time constraints, this can be particularly valuable.
Step 3: Identify qualifying parcels
Finally, we can leverage UrbanFootprint’s easy-to-use query tools to select large parcels with a low cost per acre market land value and are currently either vacant or large format commercial. For our example analysis in Indianapolis, this returns 108 parcels (out of 204,000 total parcels).
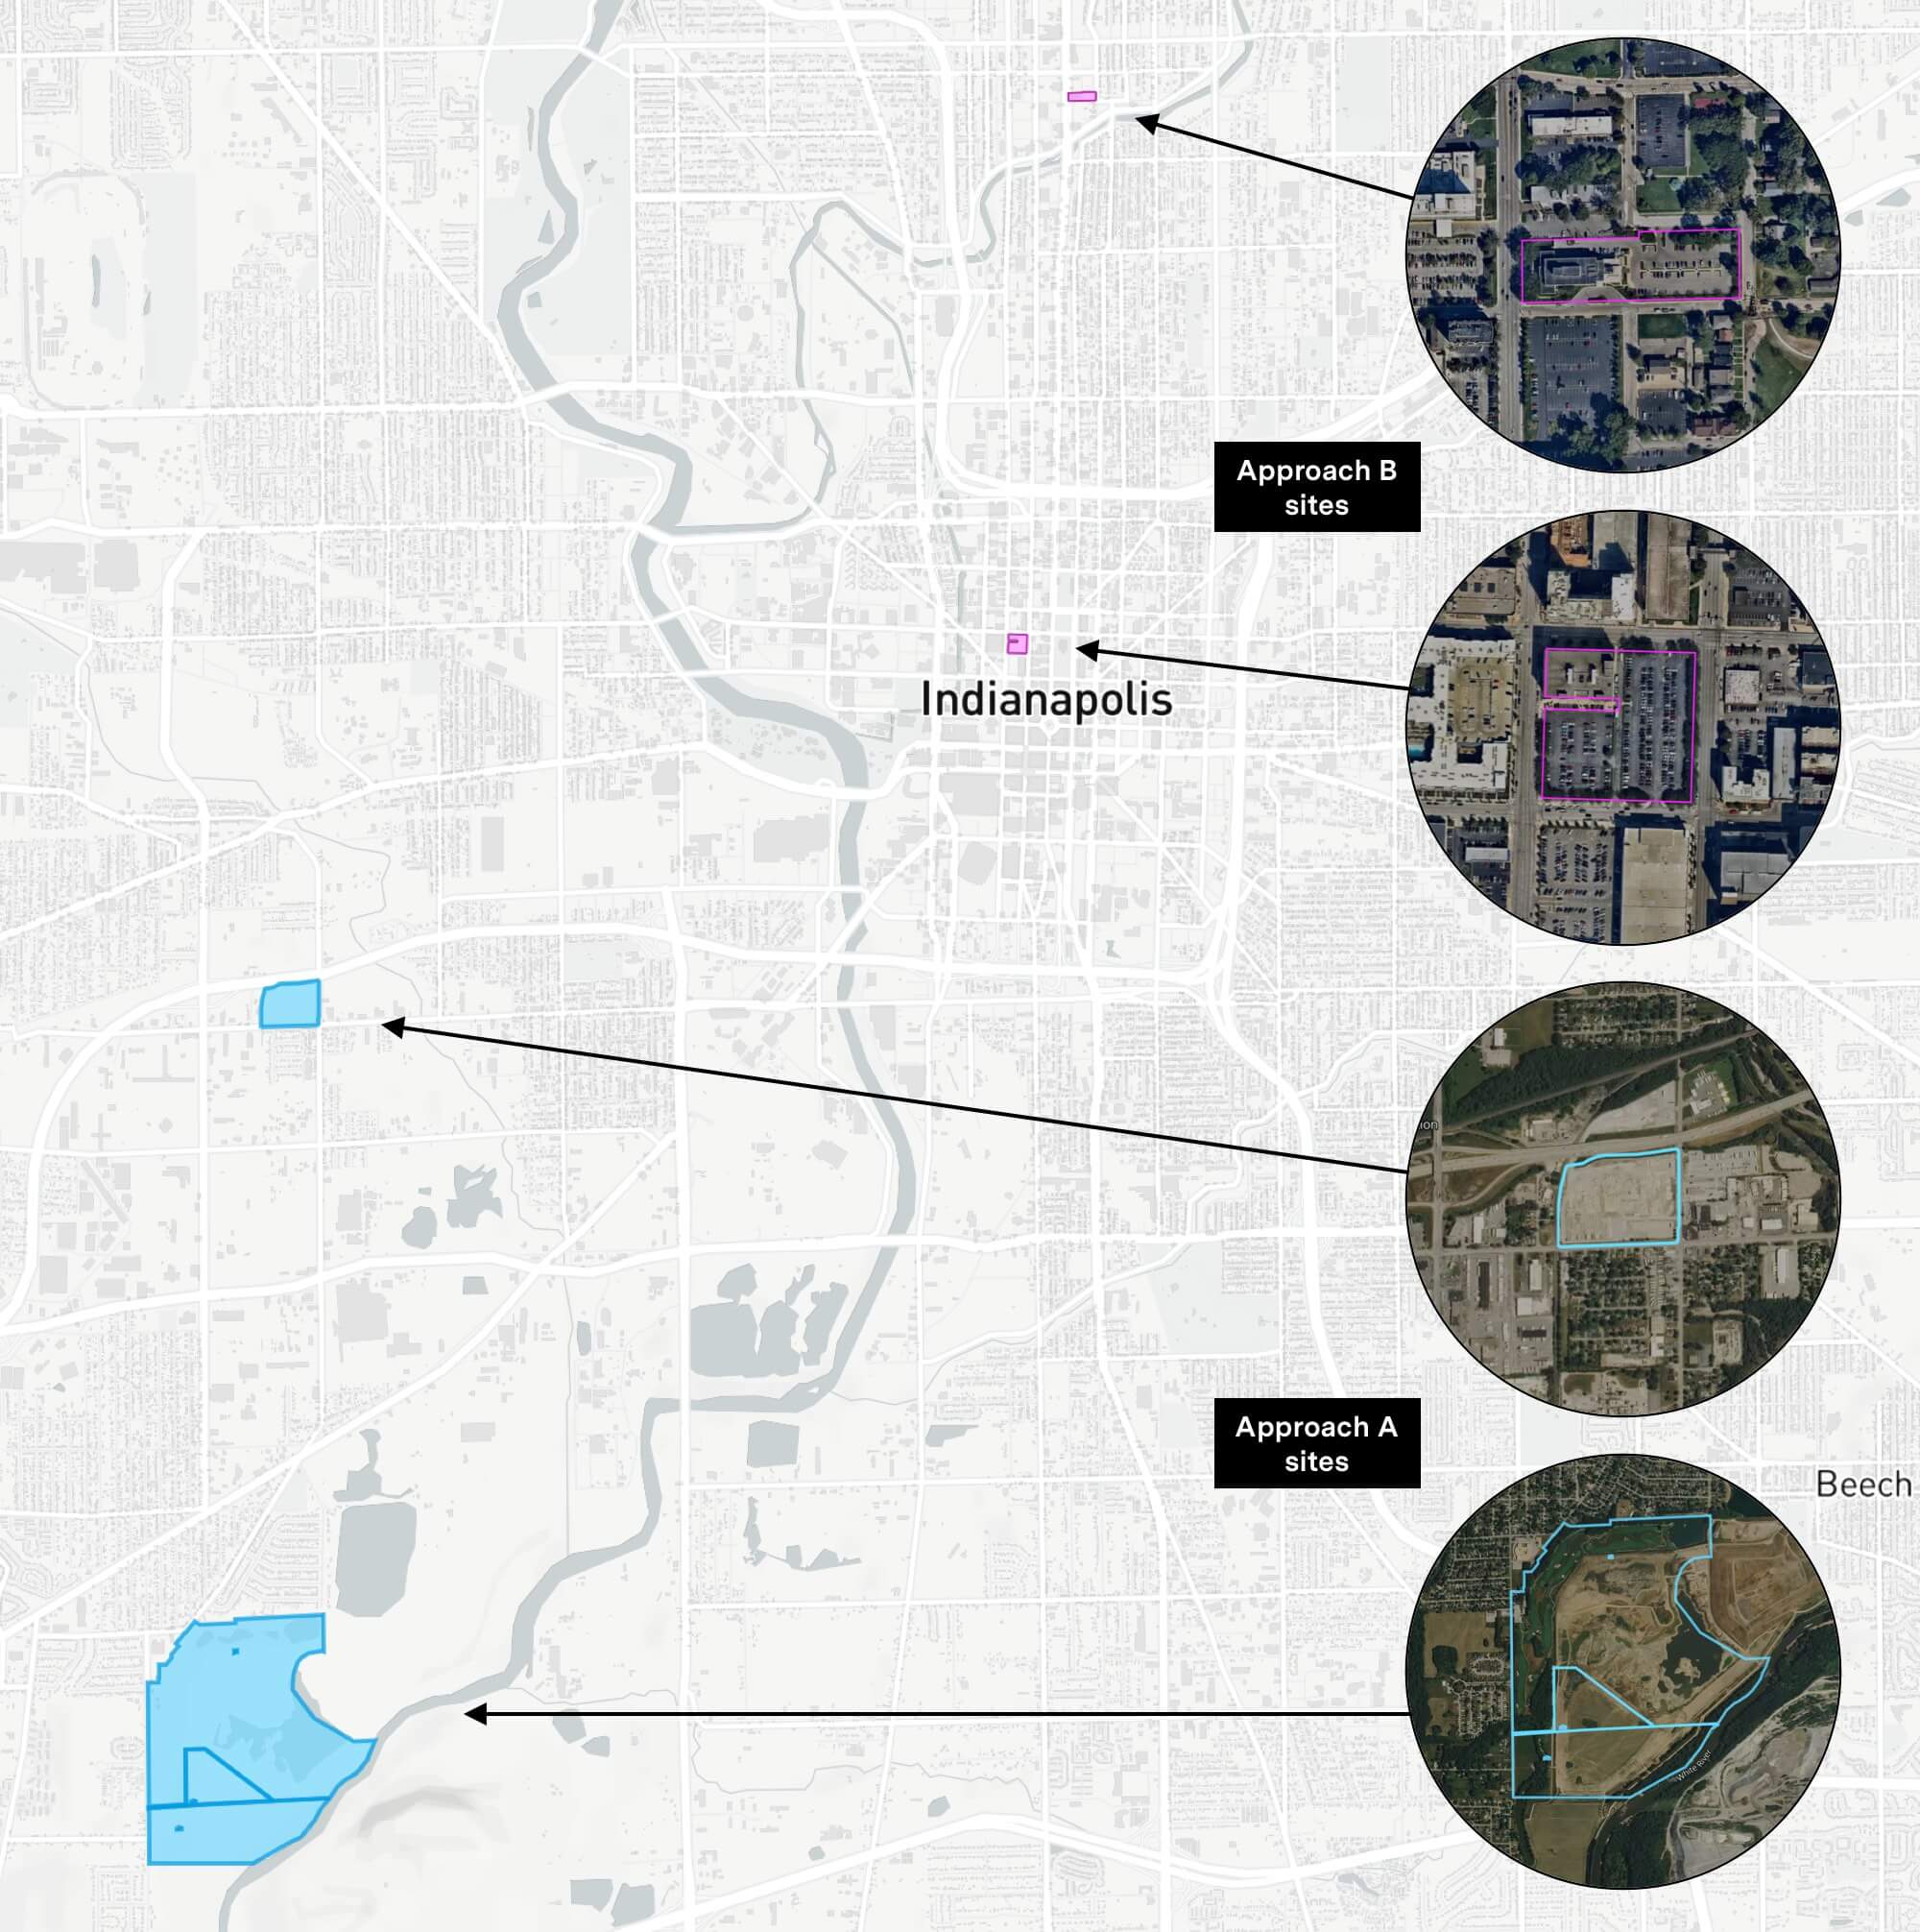
Now we’re able to evaluate the location of selected parcels in the context of current zoning and freeway access. Here we can see one of the selected parcels is undeveloped and adjacent to a freeway, a good candidate according to our cost-effective development criteria. Another site farther south, adjacent to the White River, is also a good candidate. Based on zoning and current land use, we inferred that portions of the site are remediated land from a quarry extraction operation, which is ongoing in the region. Now that we have two likely candidates, we would want to do further research about each parcel’s status and development potential.
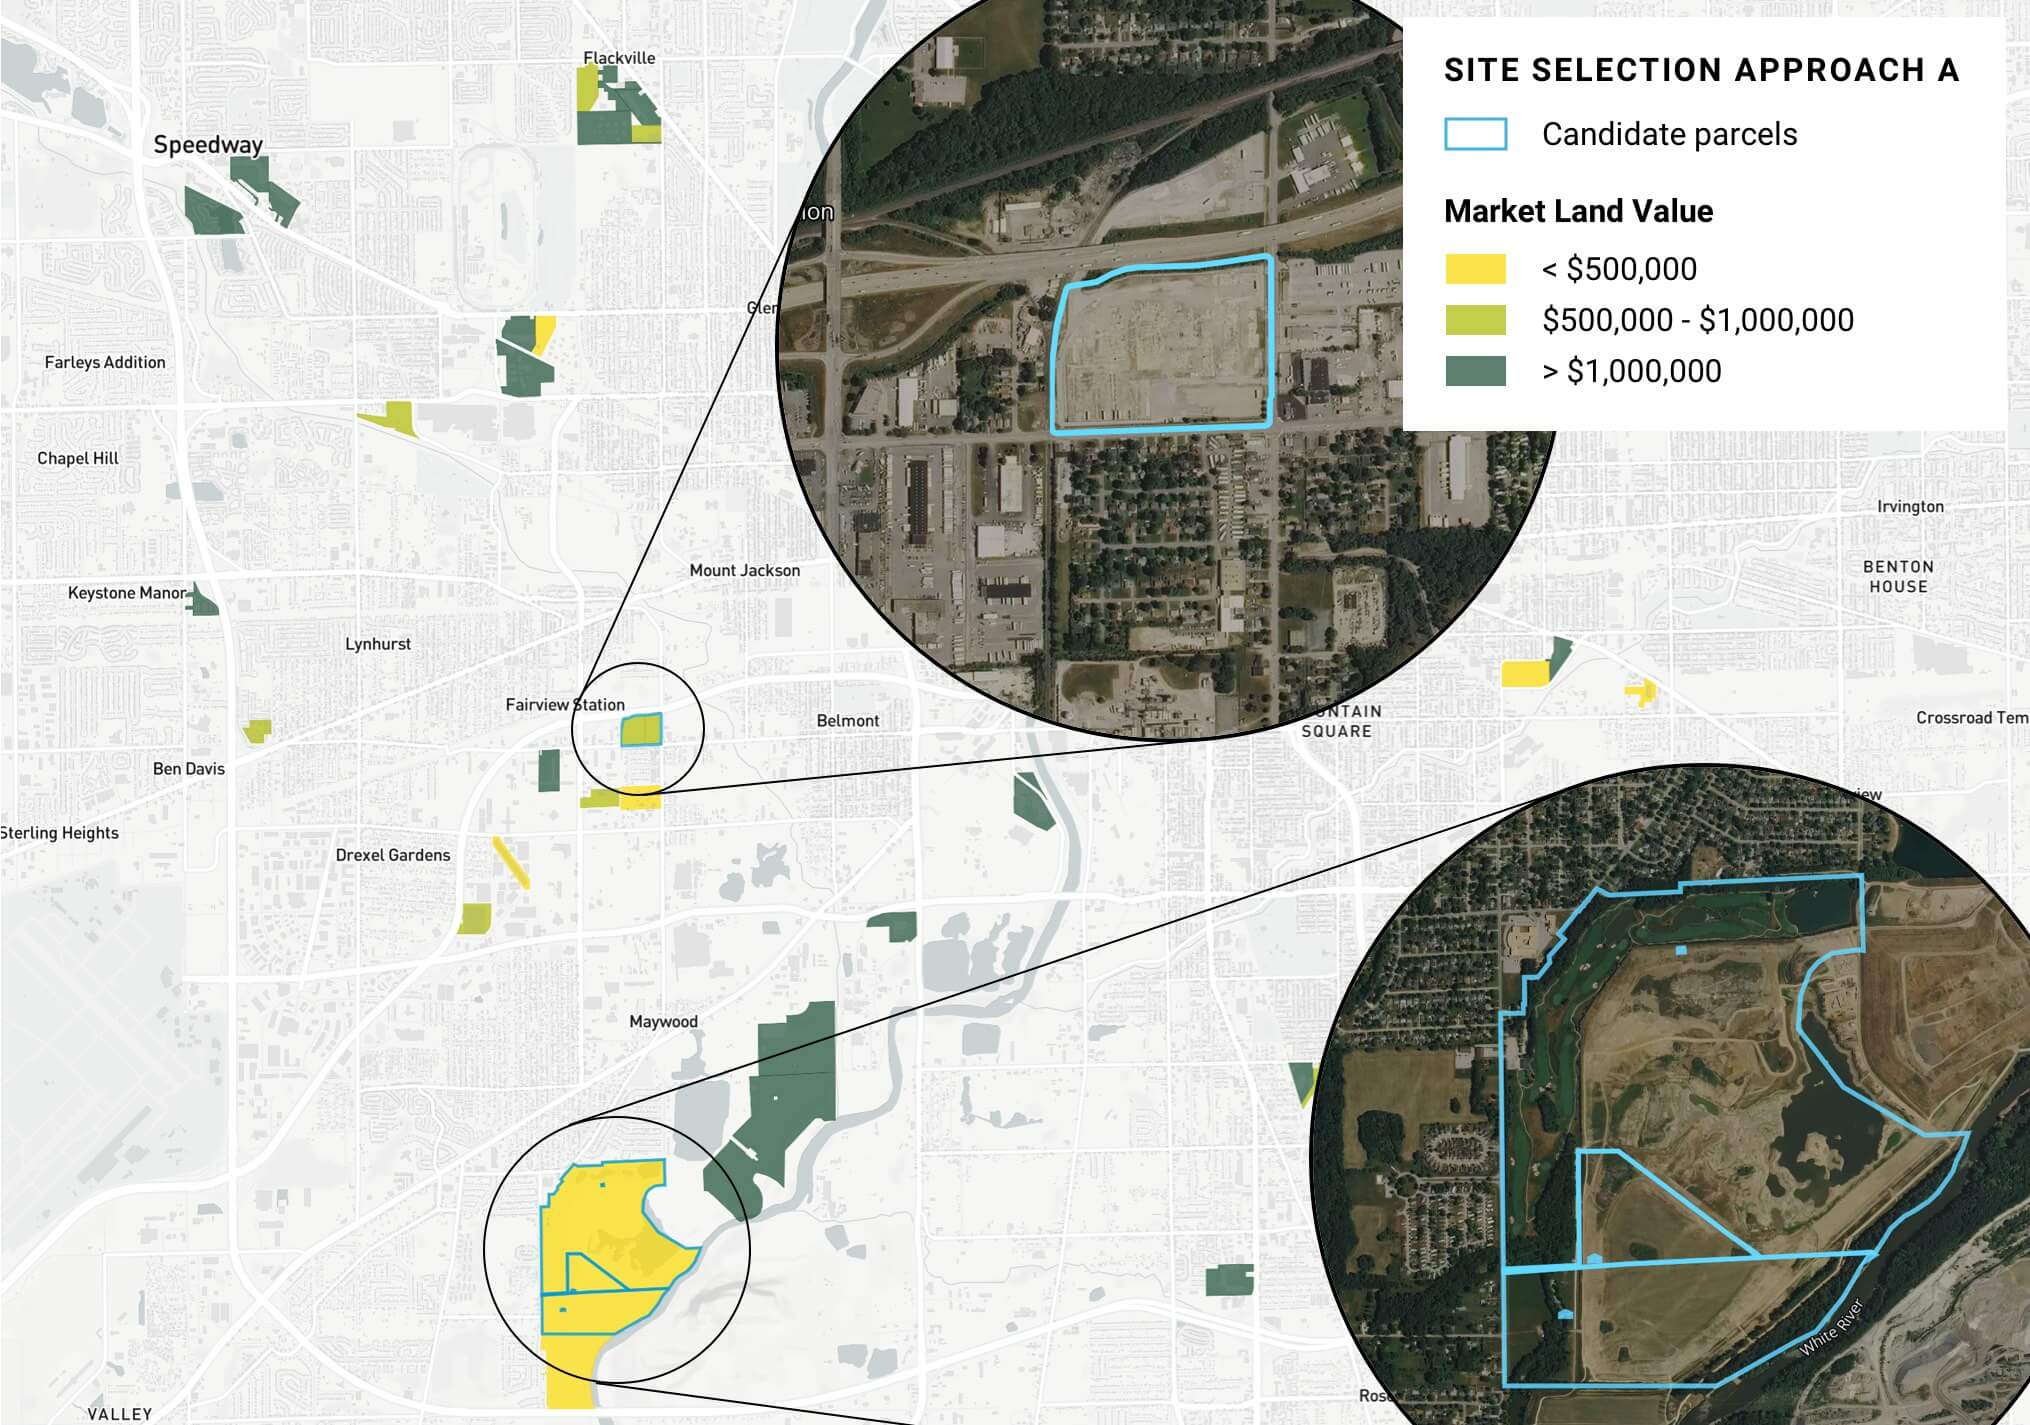
Results for Question 1: Where are cost-effective parcels in Indianapolis?
The identified locations meet all of our site selection criteria, and therefore merit further investigation. Both sites are located in the southwest of the city on undeveloped, commercially zoned parcels. They are also near the airport and in a semi-industrial area with a high concentration of logistics and manufacturing jobs.
Question 2: How accessible are the identified sites for target employees?
Step 1: Generate household and employment densities
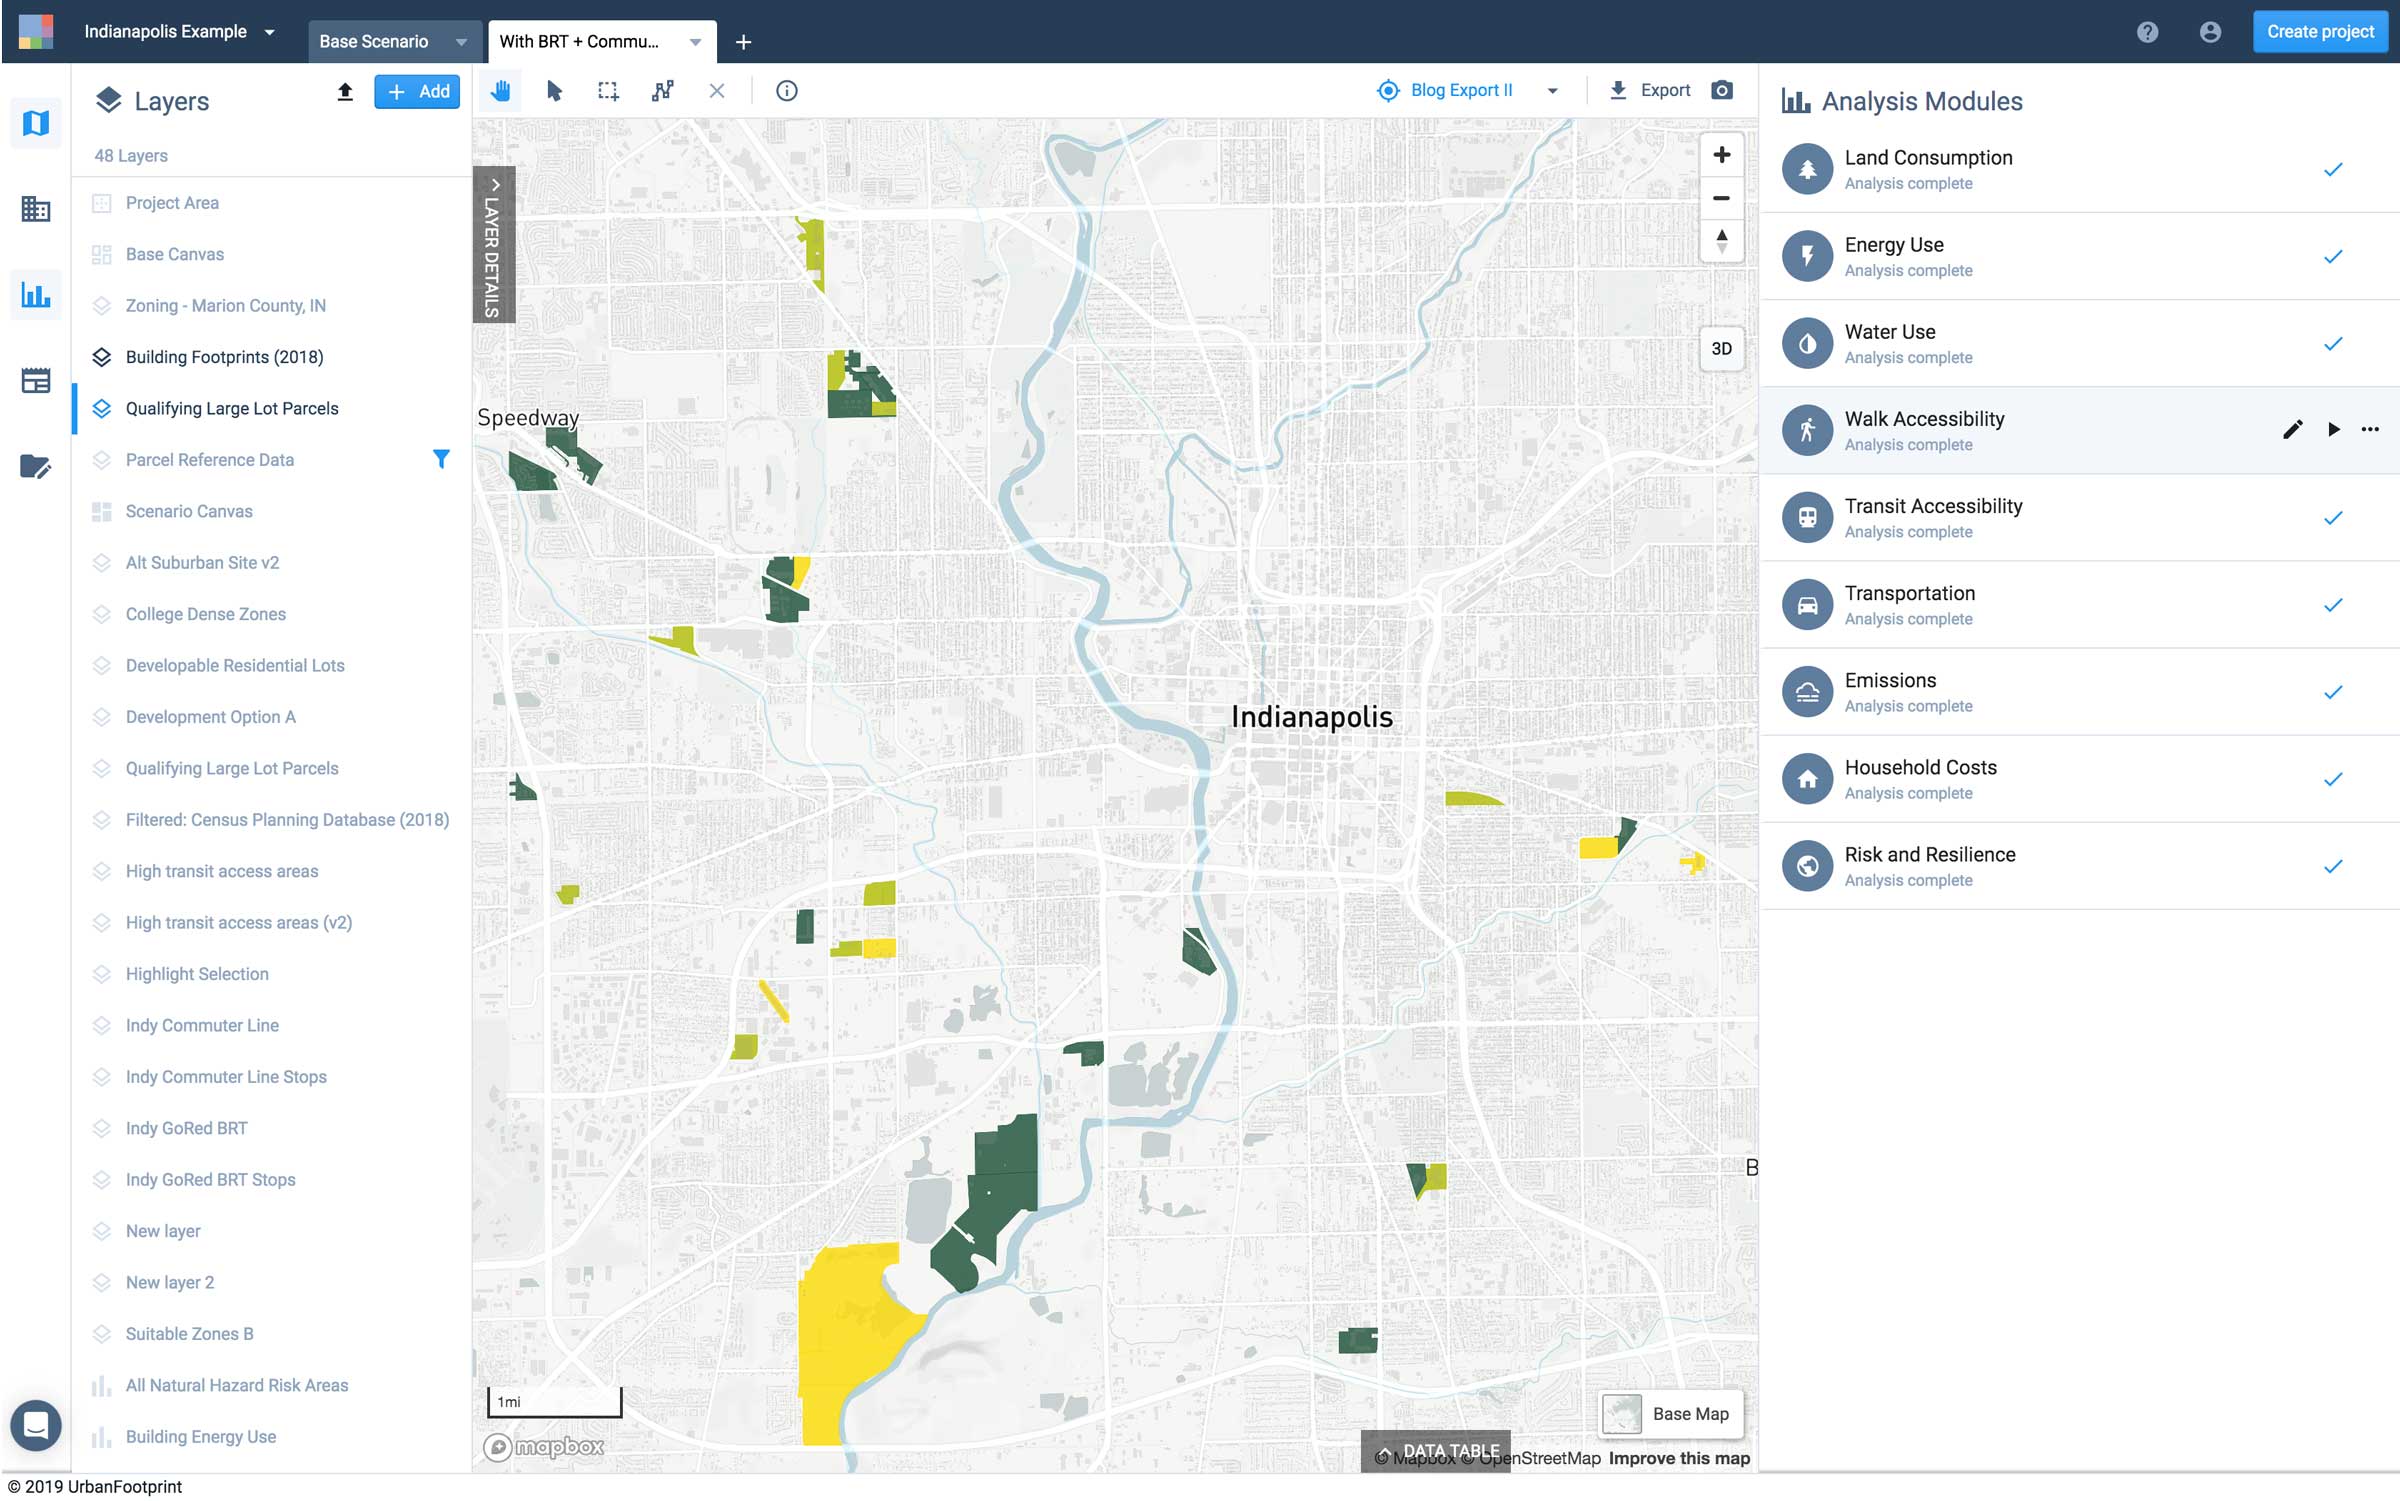
UrbanFootprint makes this complex analysis easy – We can simply run the built-in Walk Accessibility Analysis Module to generate ready-to-go analysis layers and charts. After clicking the play button, you’re able to view walk access to key destinations in minutes.
Step 2: Compare the location of each site to population density
Now we’re ready to compare the location of each site with the walk accessibility heatmap generated by the module. Our analysis reveals that while there are several population-dense clusters in the city, residents in those clusters have poor access to the identified sites.
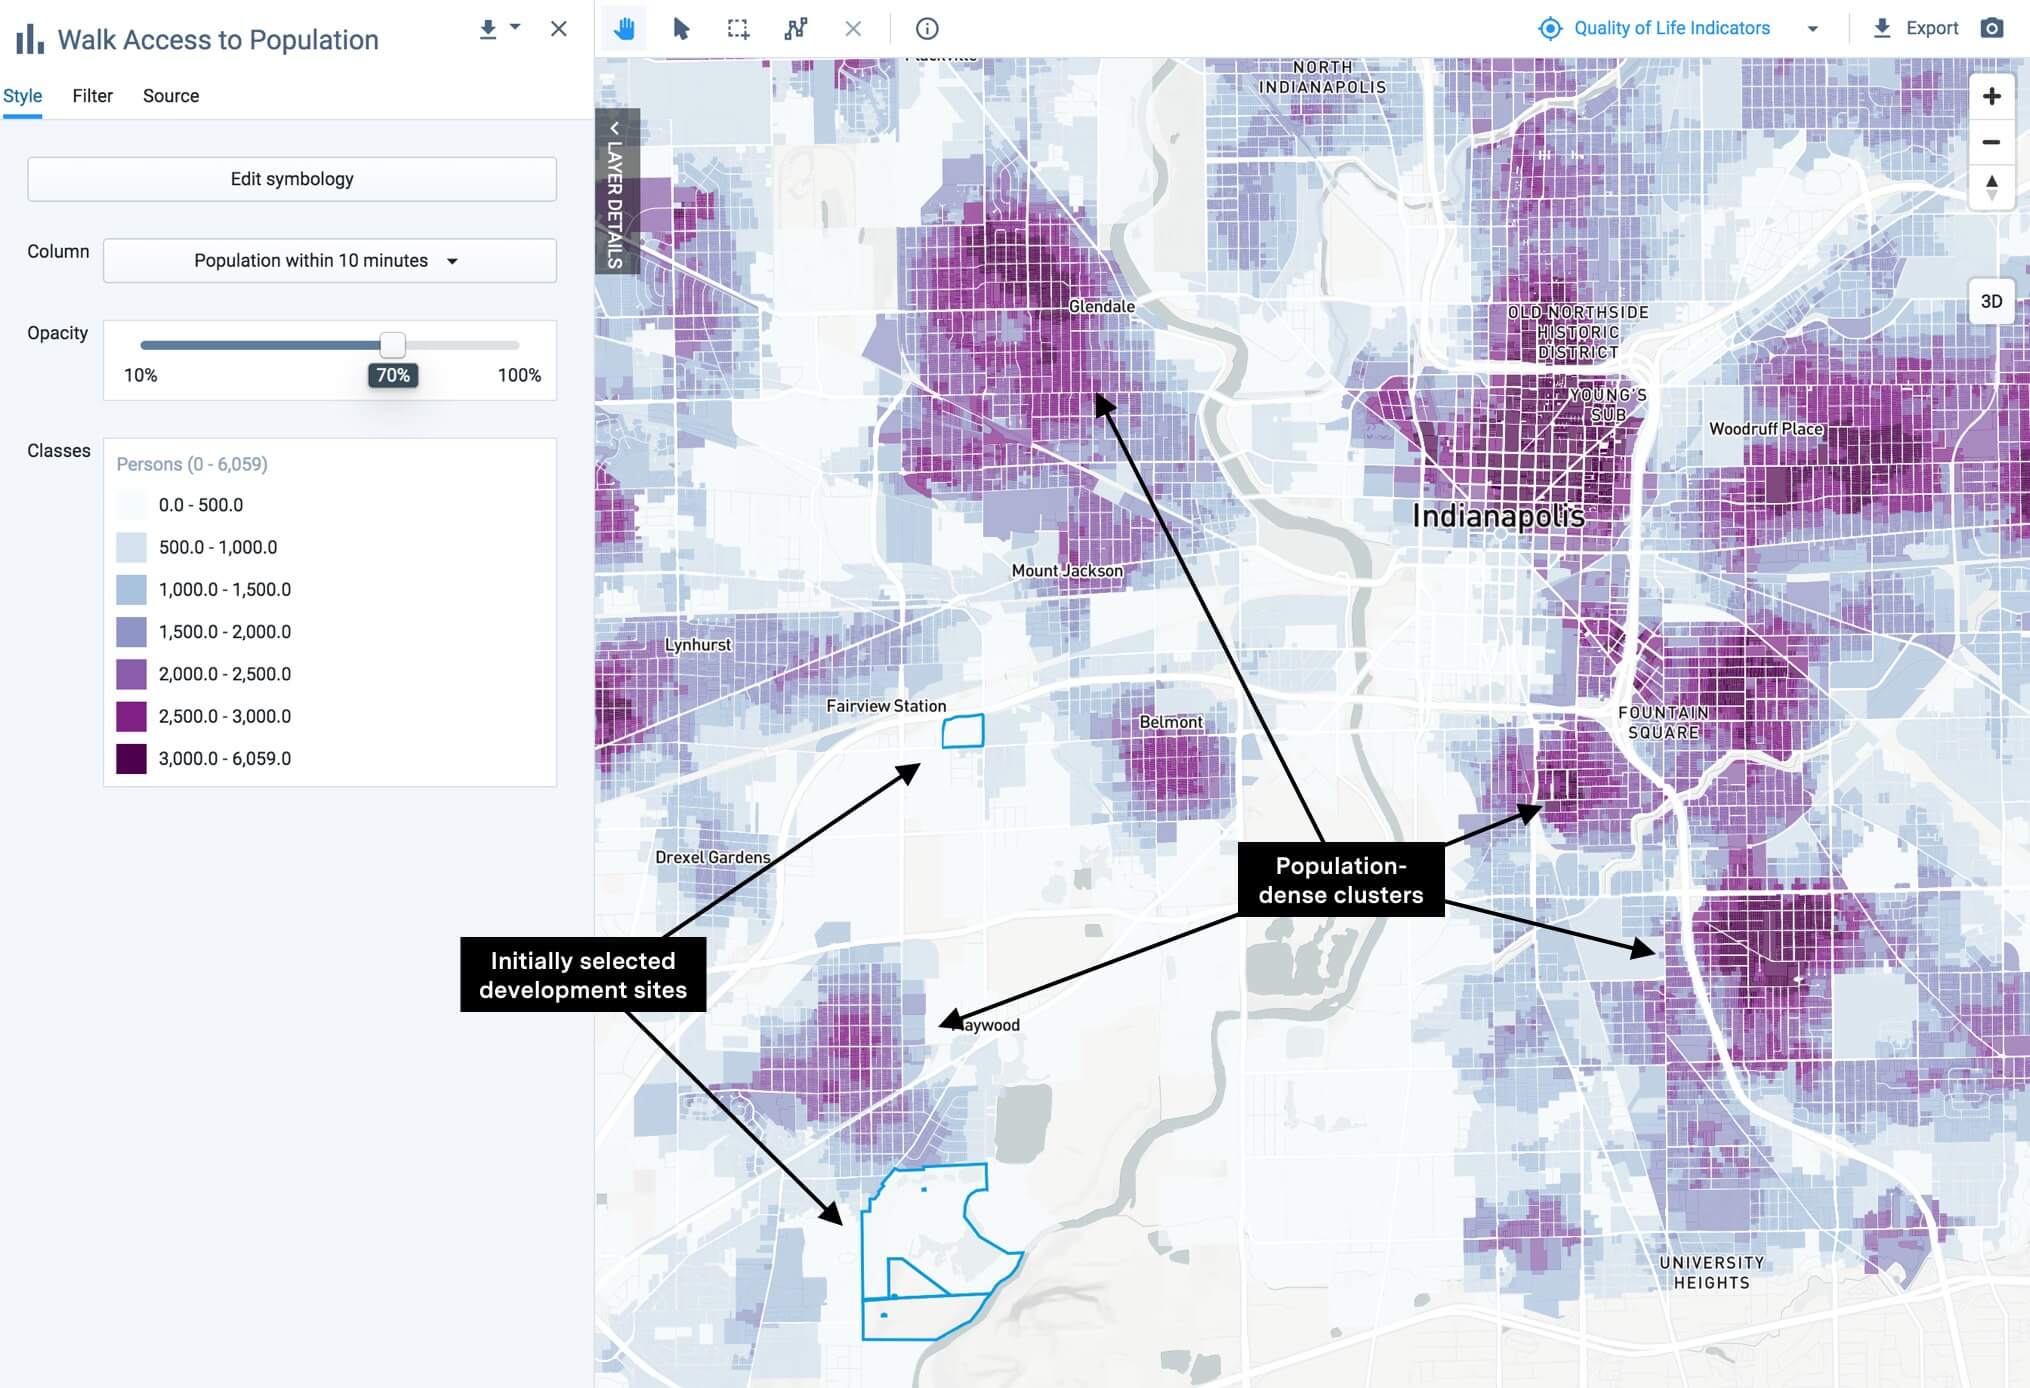
Note that evaluating the simple population density of individual parcels would not be sufficient for understanding each parcel’s location in the broader landscape of the city. The maps generated by UrbanFootprint’s Walk Accessibility module account for the existing road network, and therefore put the location of the identified sites in context. Without this sensitivity, a parcel next to a freeway cutting off easy walk access to downtown might register as being in a high density area when in fact it is disconnected from that area.
Step 3: Compare the location of each site to transit service
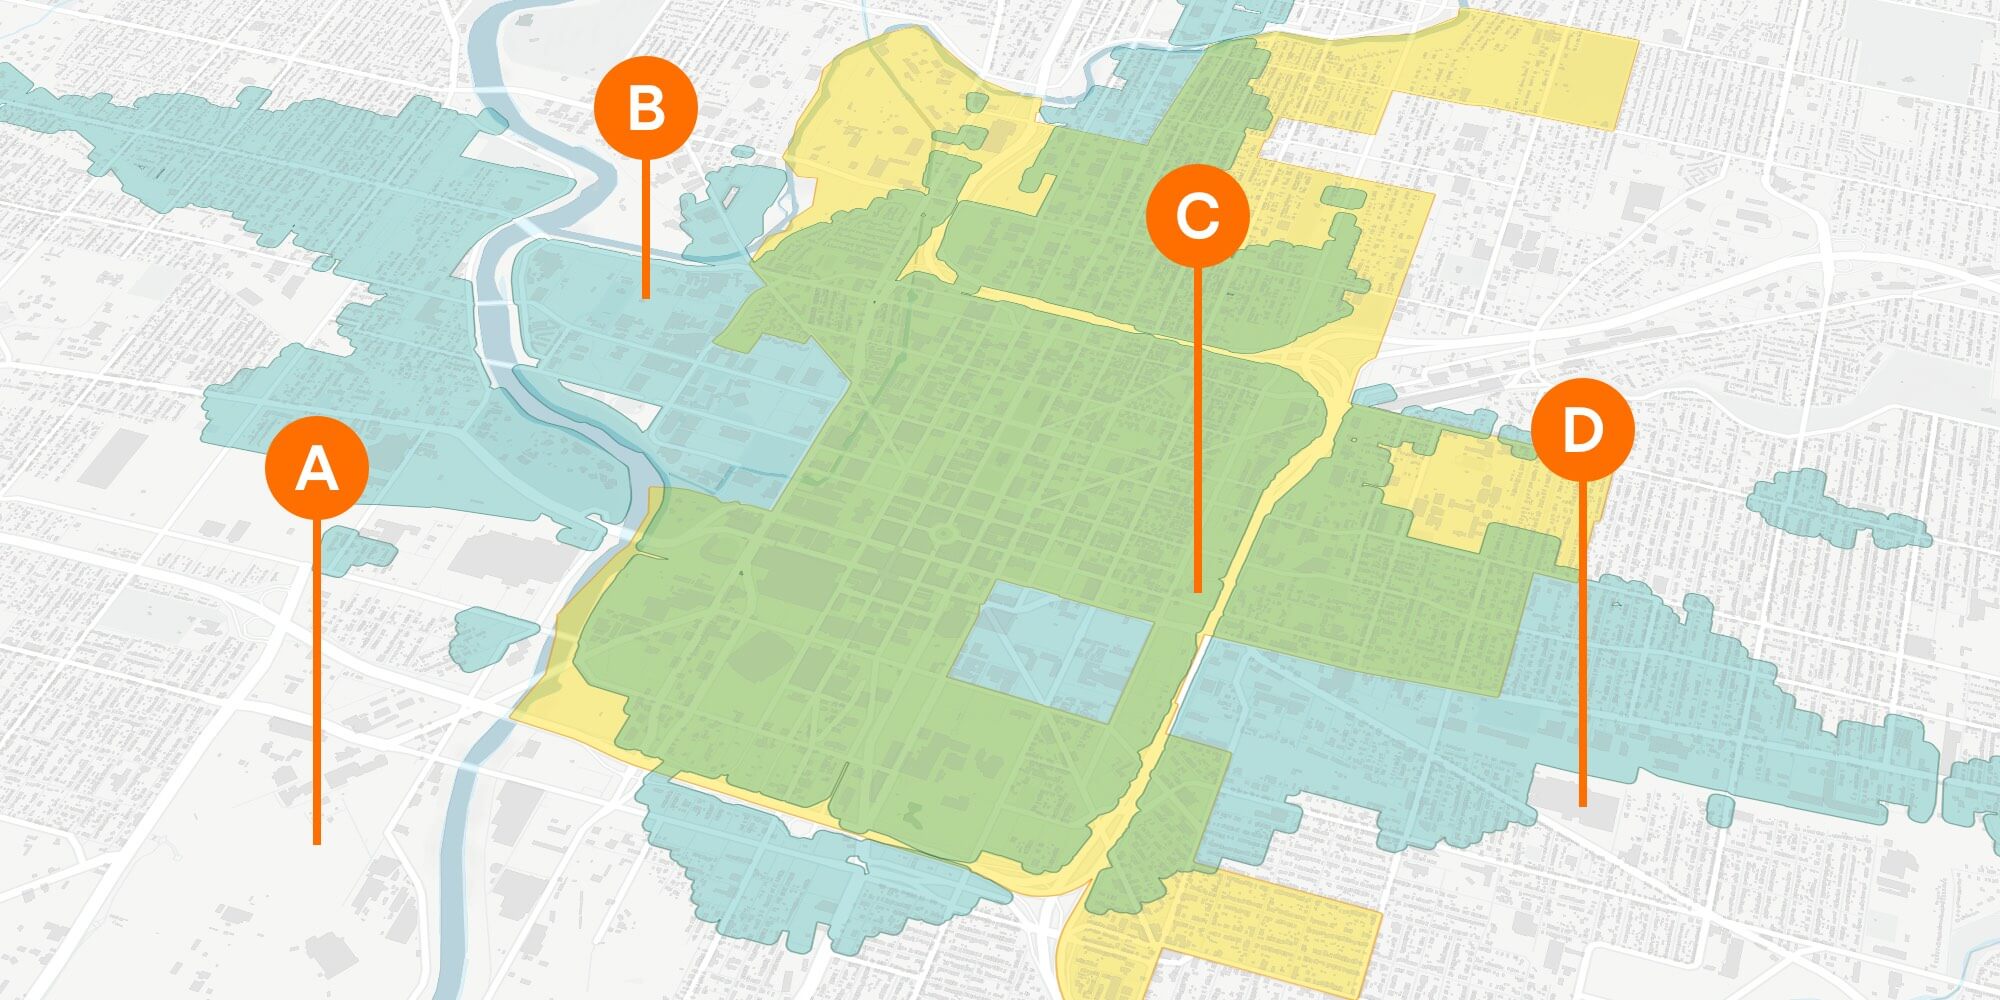
Like walk access, analyzing transit access in UrbanFootprint is easy. We can run the Transit Accessibility Analysis Module to map transit accessibility to employment. In the exhibit below, we also added transit lines and stops layers using UrbanFootprint’s built-in Data Library.
![]()
The map shows that the identified sites have poor connectivity. Both are only served by a single transit line and are isolated from zones where households have high access to employment options via transit.
Results for Question 2: How accessible are the identified sites for target employees?
When analyzing the sites in terms of market value and auto access (question 1), the locations perform well. However, when accounting for their location in context of the existing residential distribution and transit infrastructure of the city, it’s clear that both sites are isolated and not easily accessible for target employees (question 2). Armed with this insight, let’s develop and explore an additional option that prioritizes attracting target employees and better accounts for transportation and accessibility-related costs for prospective employees.
Approach B: Optimize for target employees
What location is both attractive to target employees and accessible from neighborhoods where target employees live?
Question 1: Where do target employees live that are accessible by public transit?
To answer this question, we’ll identify parcels that meet the following criteria:
- Demographics match our target employee profile
- Dense housing options exist (the assumption being that dense, walkable areas attract target employees)
- Near public transit
Step 1: Identify locations with high concentrations of college graduates
Our analysis relied on US Census data, which is readily available in UrbanFootprint. The map below shows where college graduates tend to concentrate in Indianapolis.
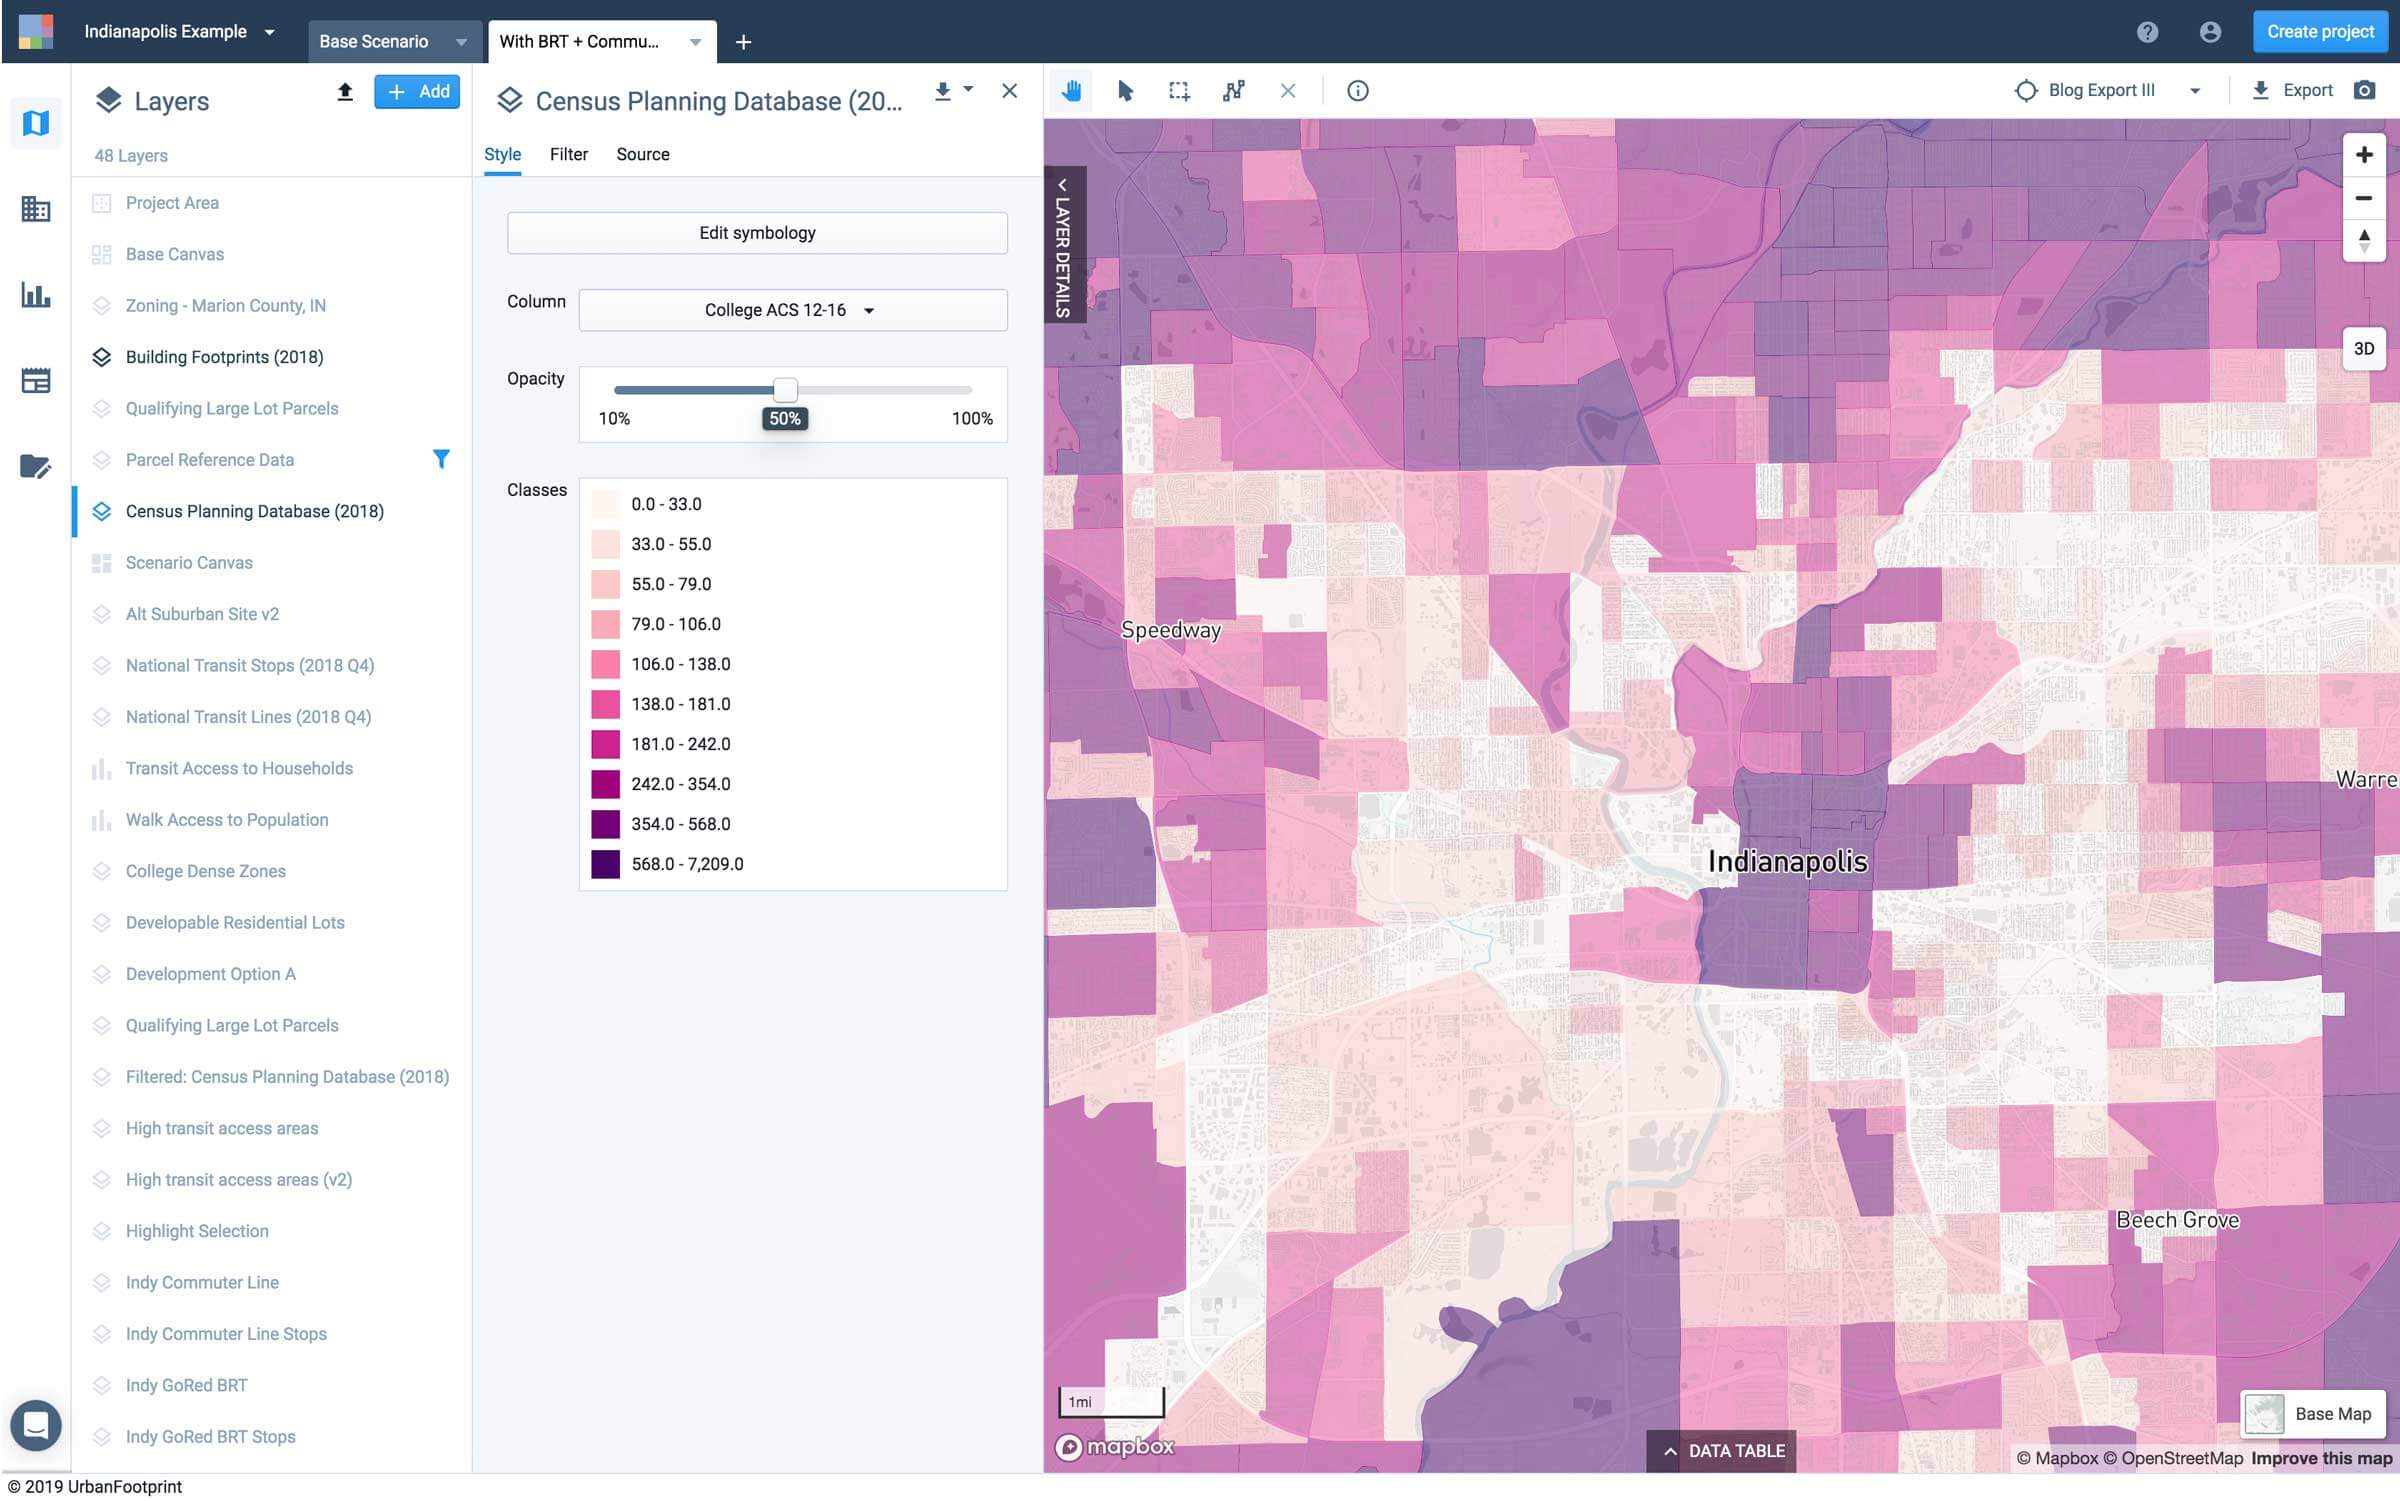
Next, we’ll use these data to identify areas where there are high concentrations of college graduates that are also between the ages of 25 and 44.
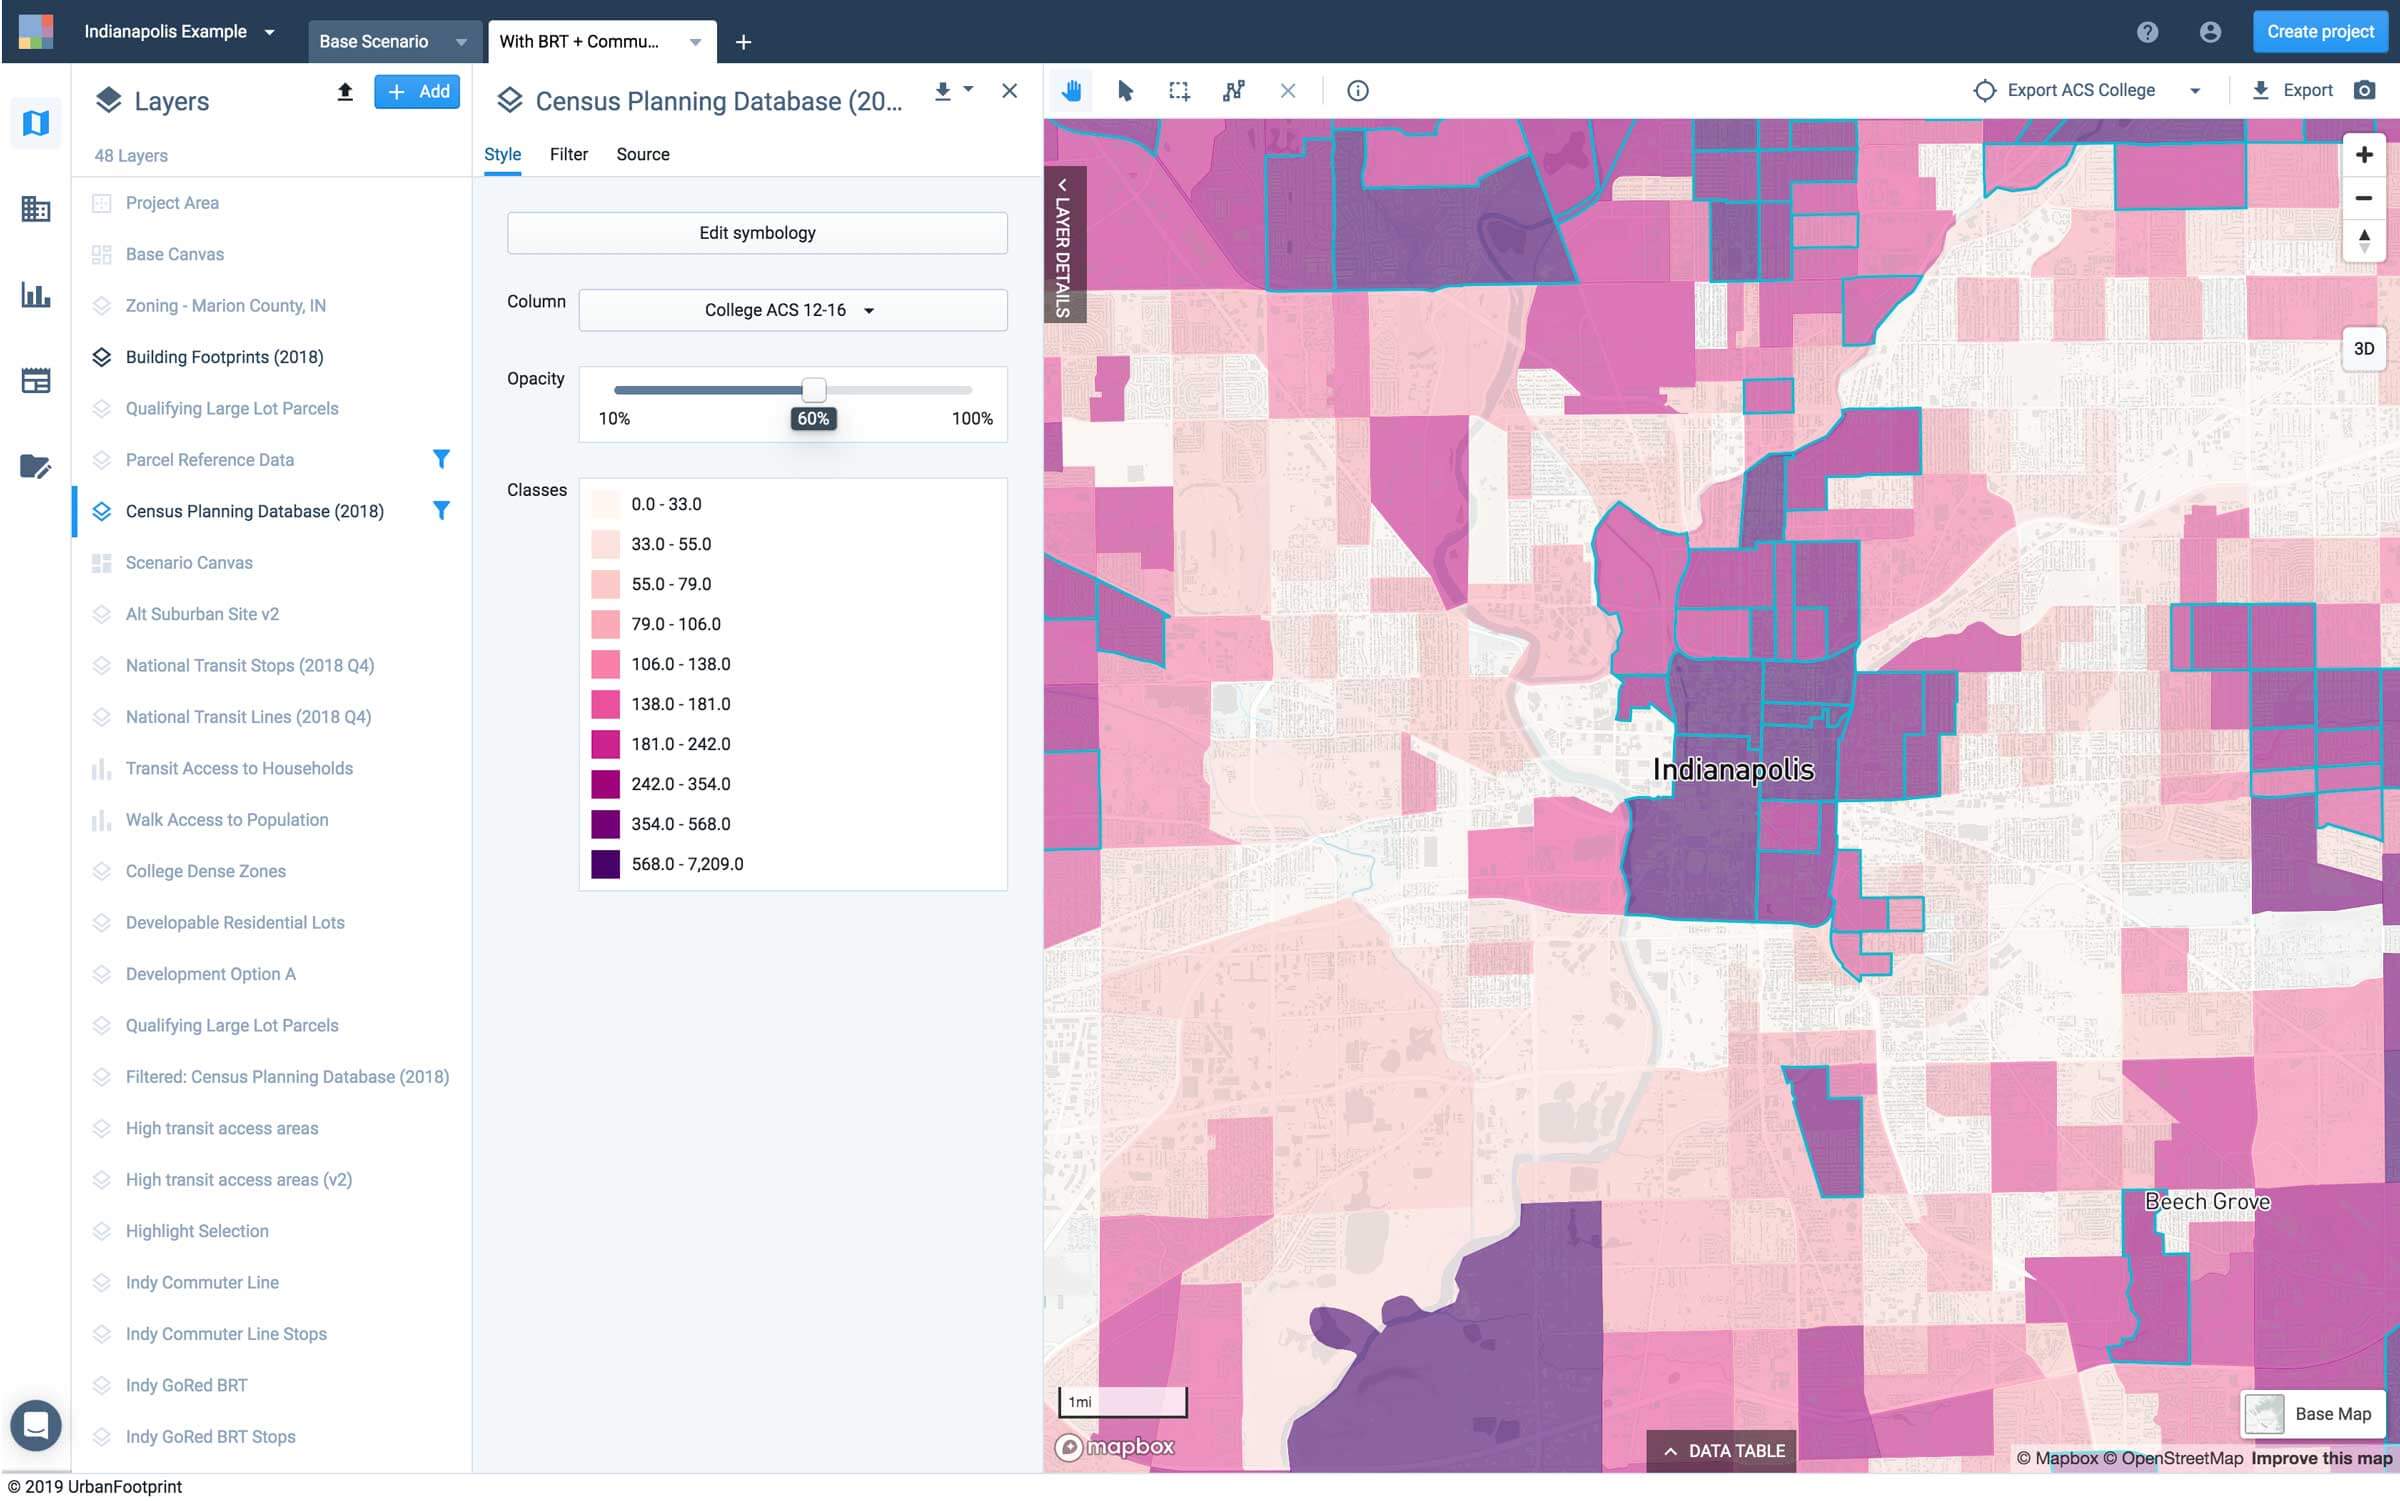
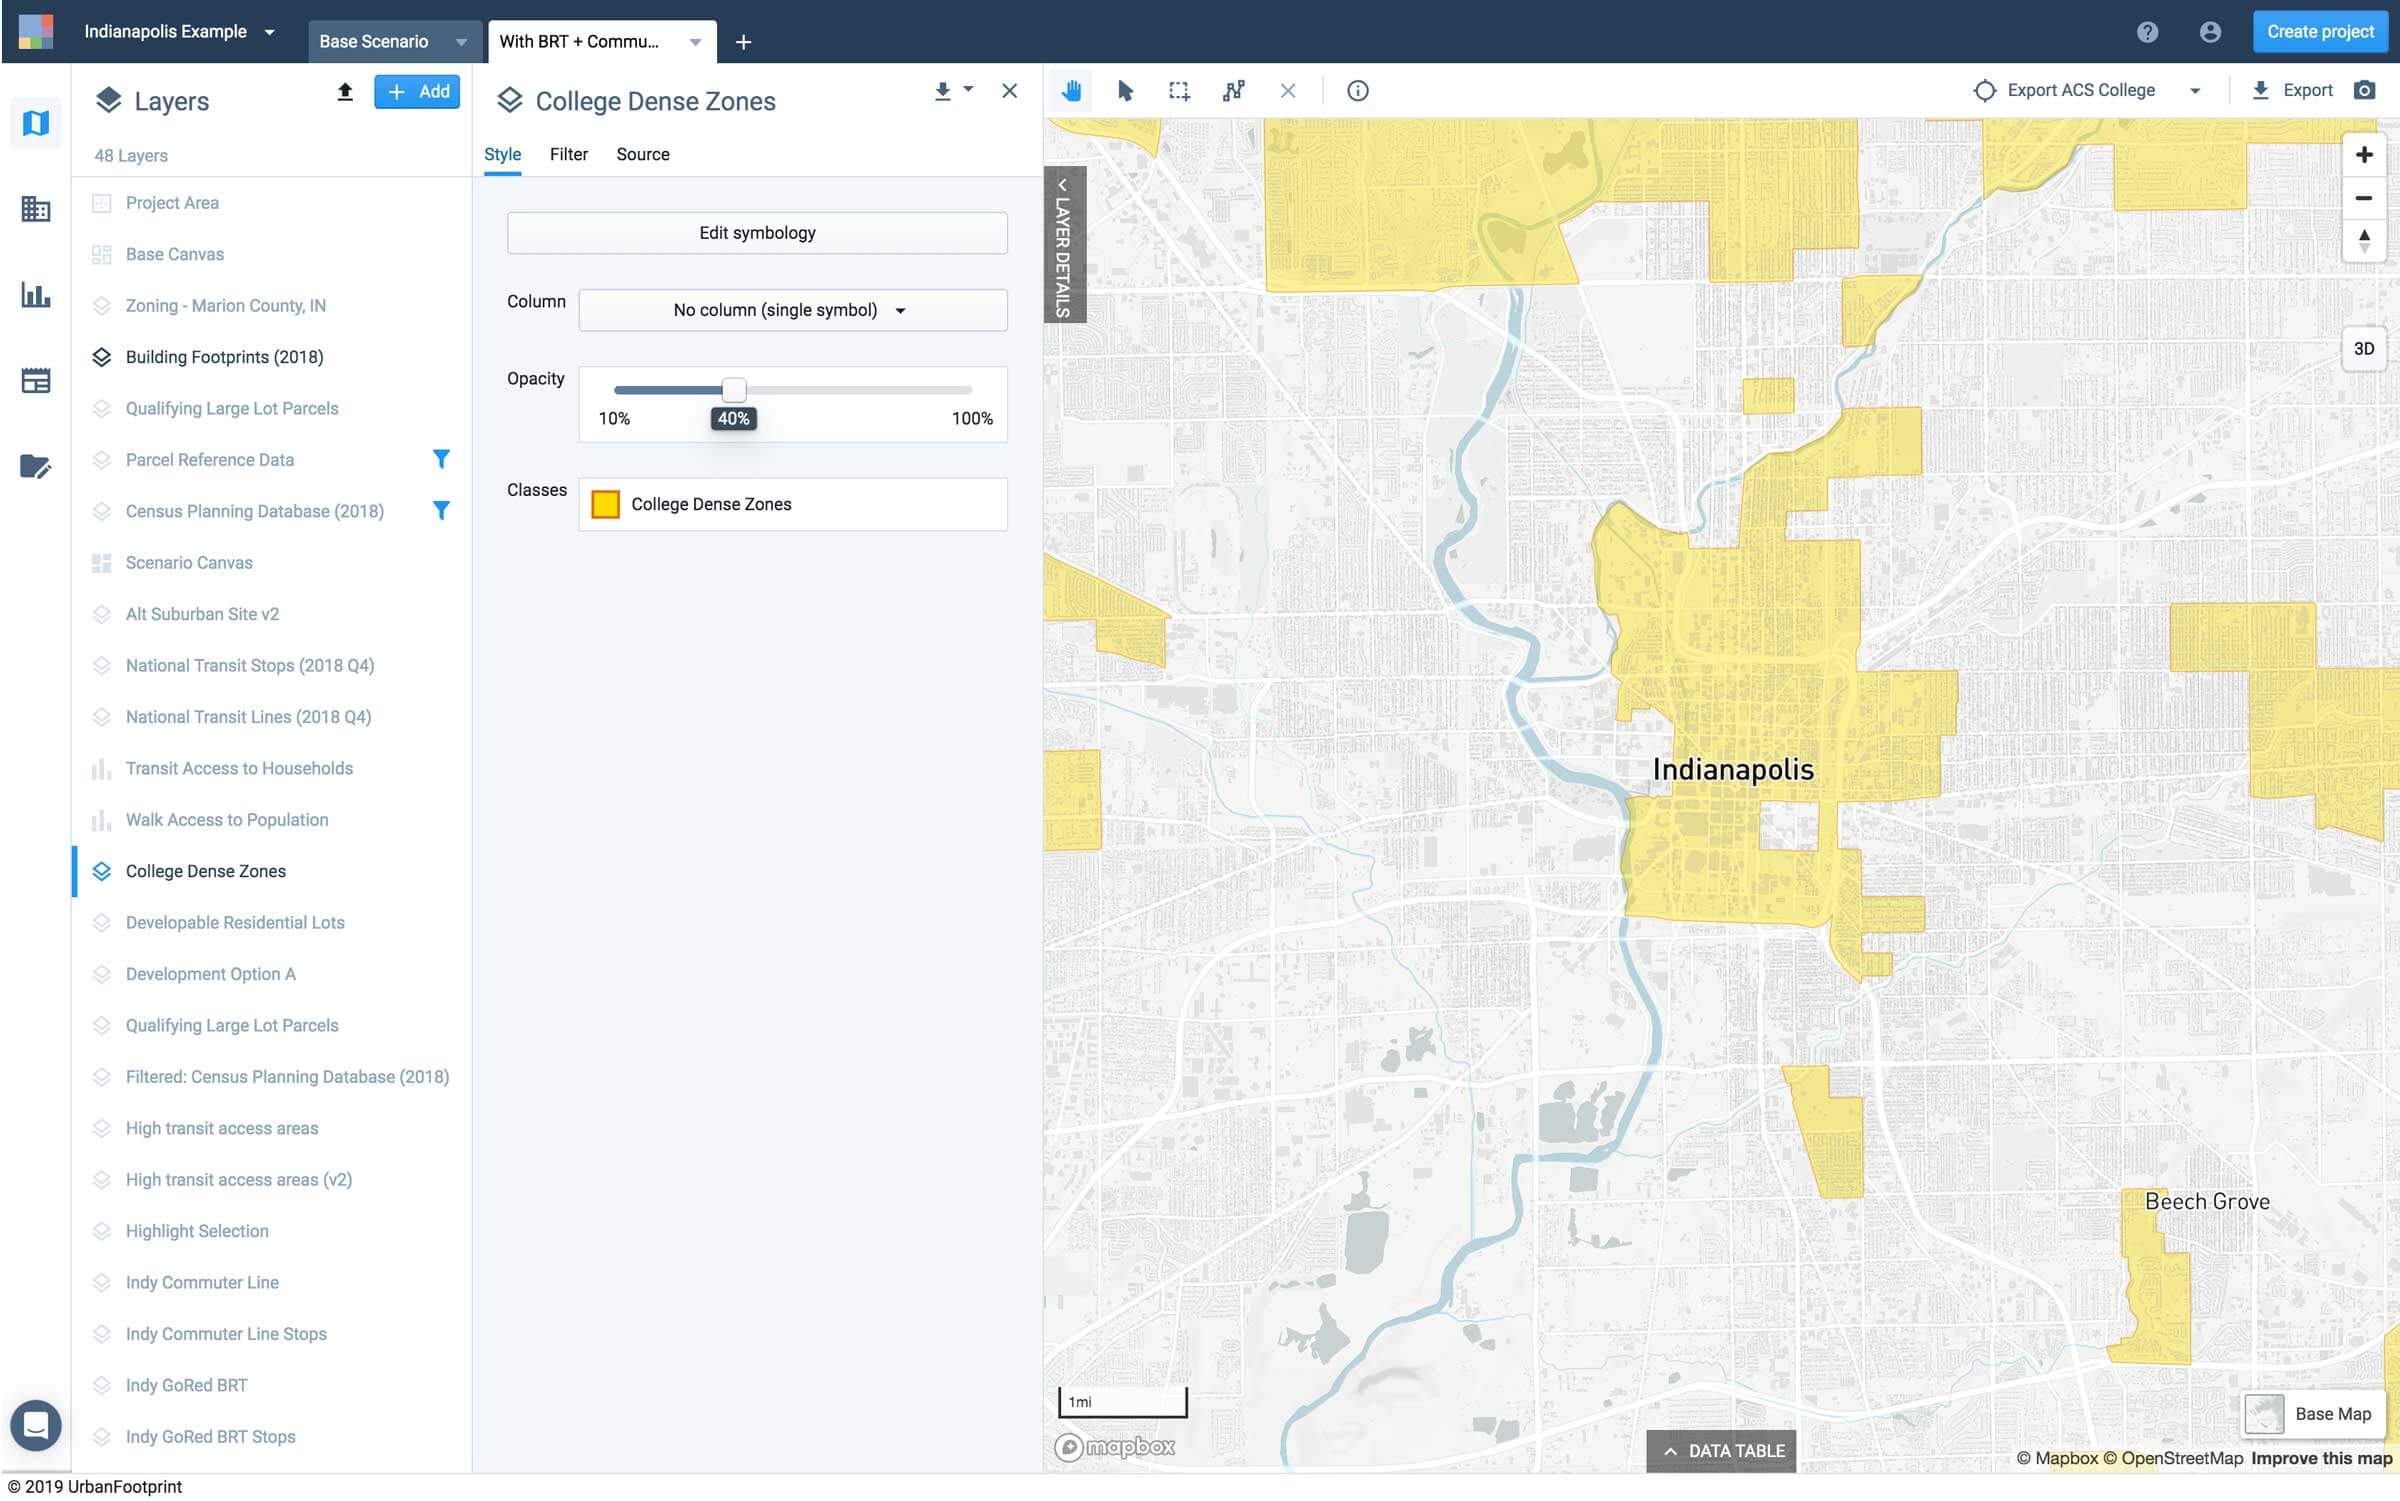
Now we can save this filtered layer as a new layer called “College Dense Zones”, shown below, for further analysis.
Step 2: Identify areas accessible to talented candidates
The pool of talented people is often larger in areas with strong employment nodes. A location for a new corporate office will be most competitive if it’s accessible to the most talented candidates. Therefore, in the next phase of this analysis, we’ll assess transit access to employment (within 30 minutes) and compare it to areas with high concentrations of college graduates.
![]()
In the map above, areas with access to more jobs via transit within 30 minutes are highlighted in shades of blue with our newly created “College Dense Zones” layer displayed in yellow.
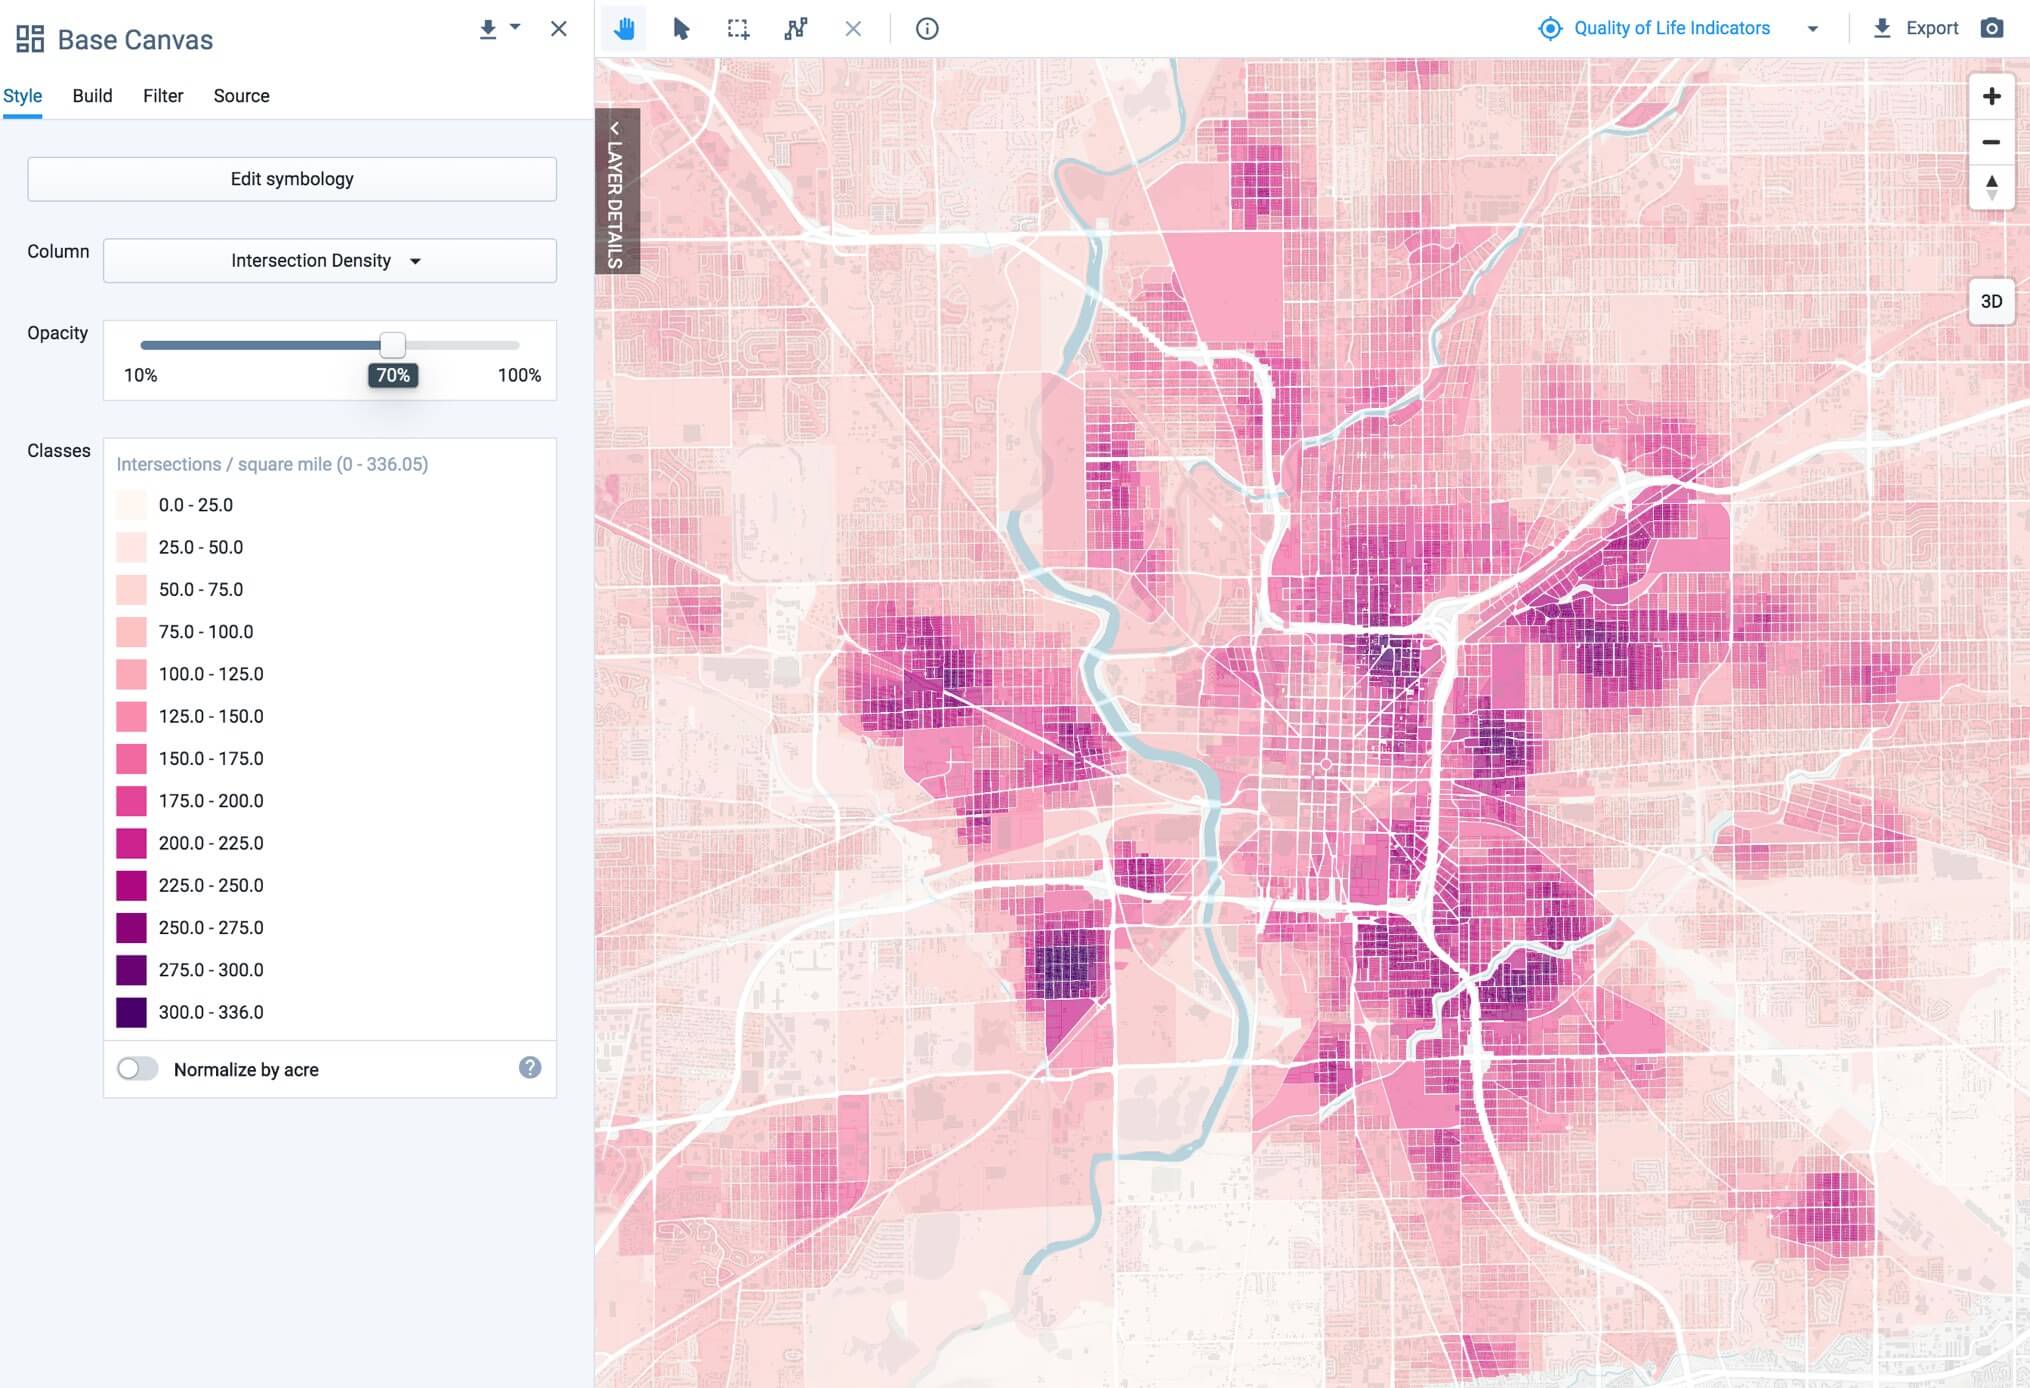
Step 3: Assess additional quality of life indicators important for attracting prospective employees
UrbanFootprint has a number of other ready-to-map datasets that can help provide insights for selecting the best site for your new office, including several measures that are common indicators of quality of life.
For example, intersection density per square mile is a common indicator of walkability.
Walk access to parks will make a development location more desirable.
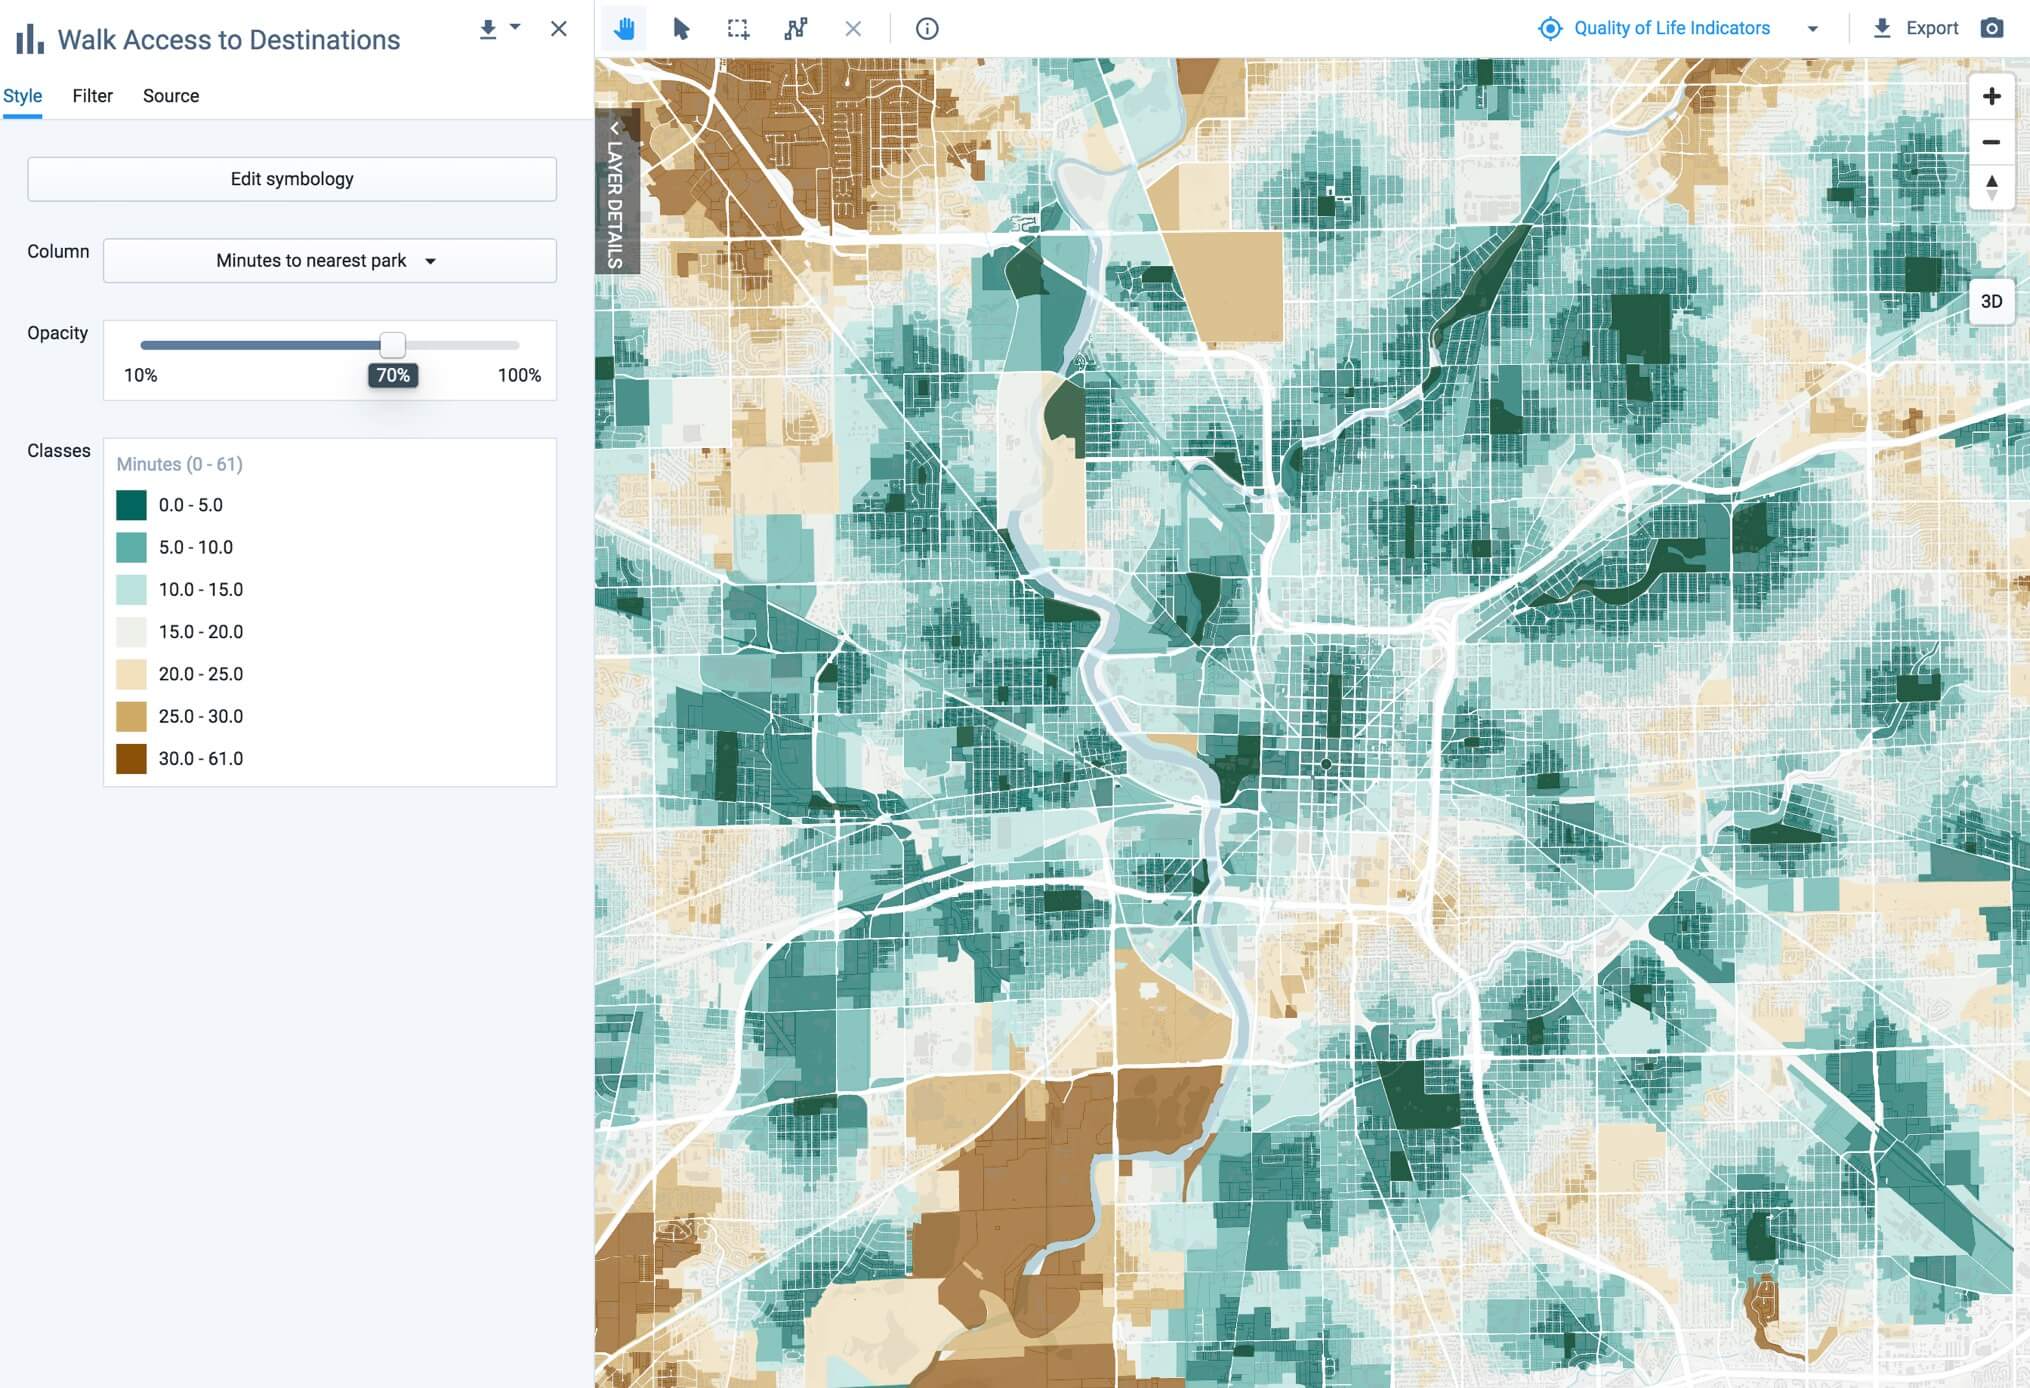
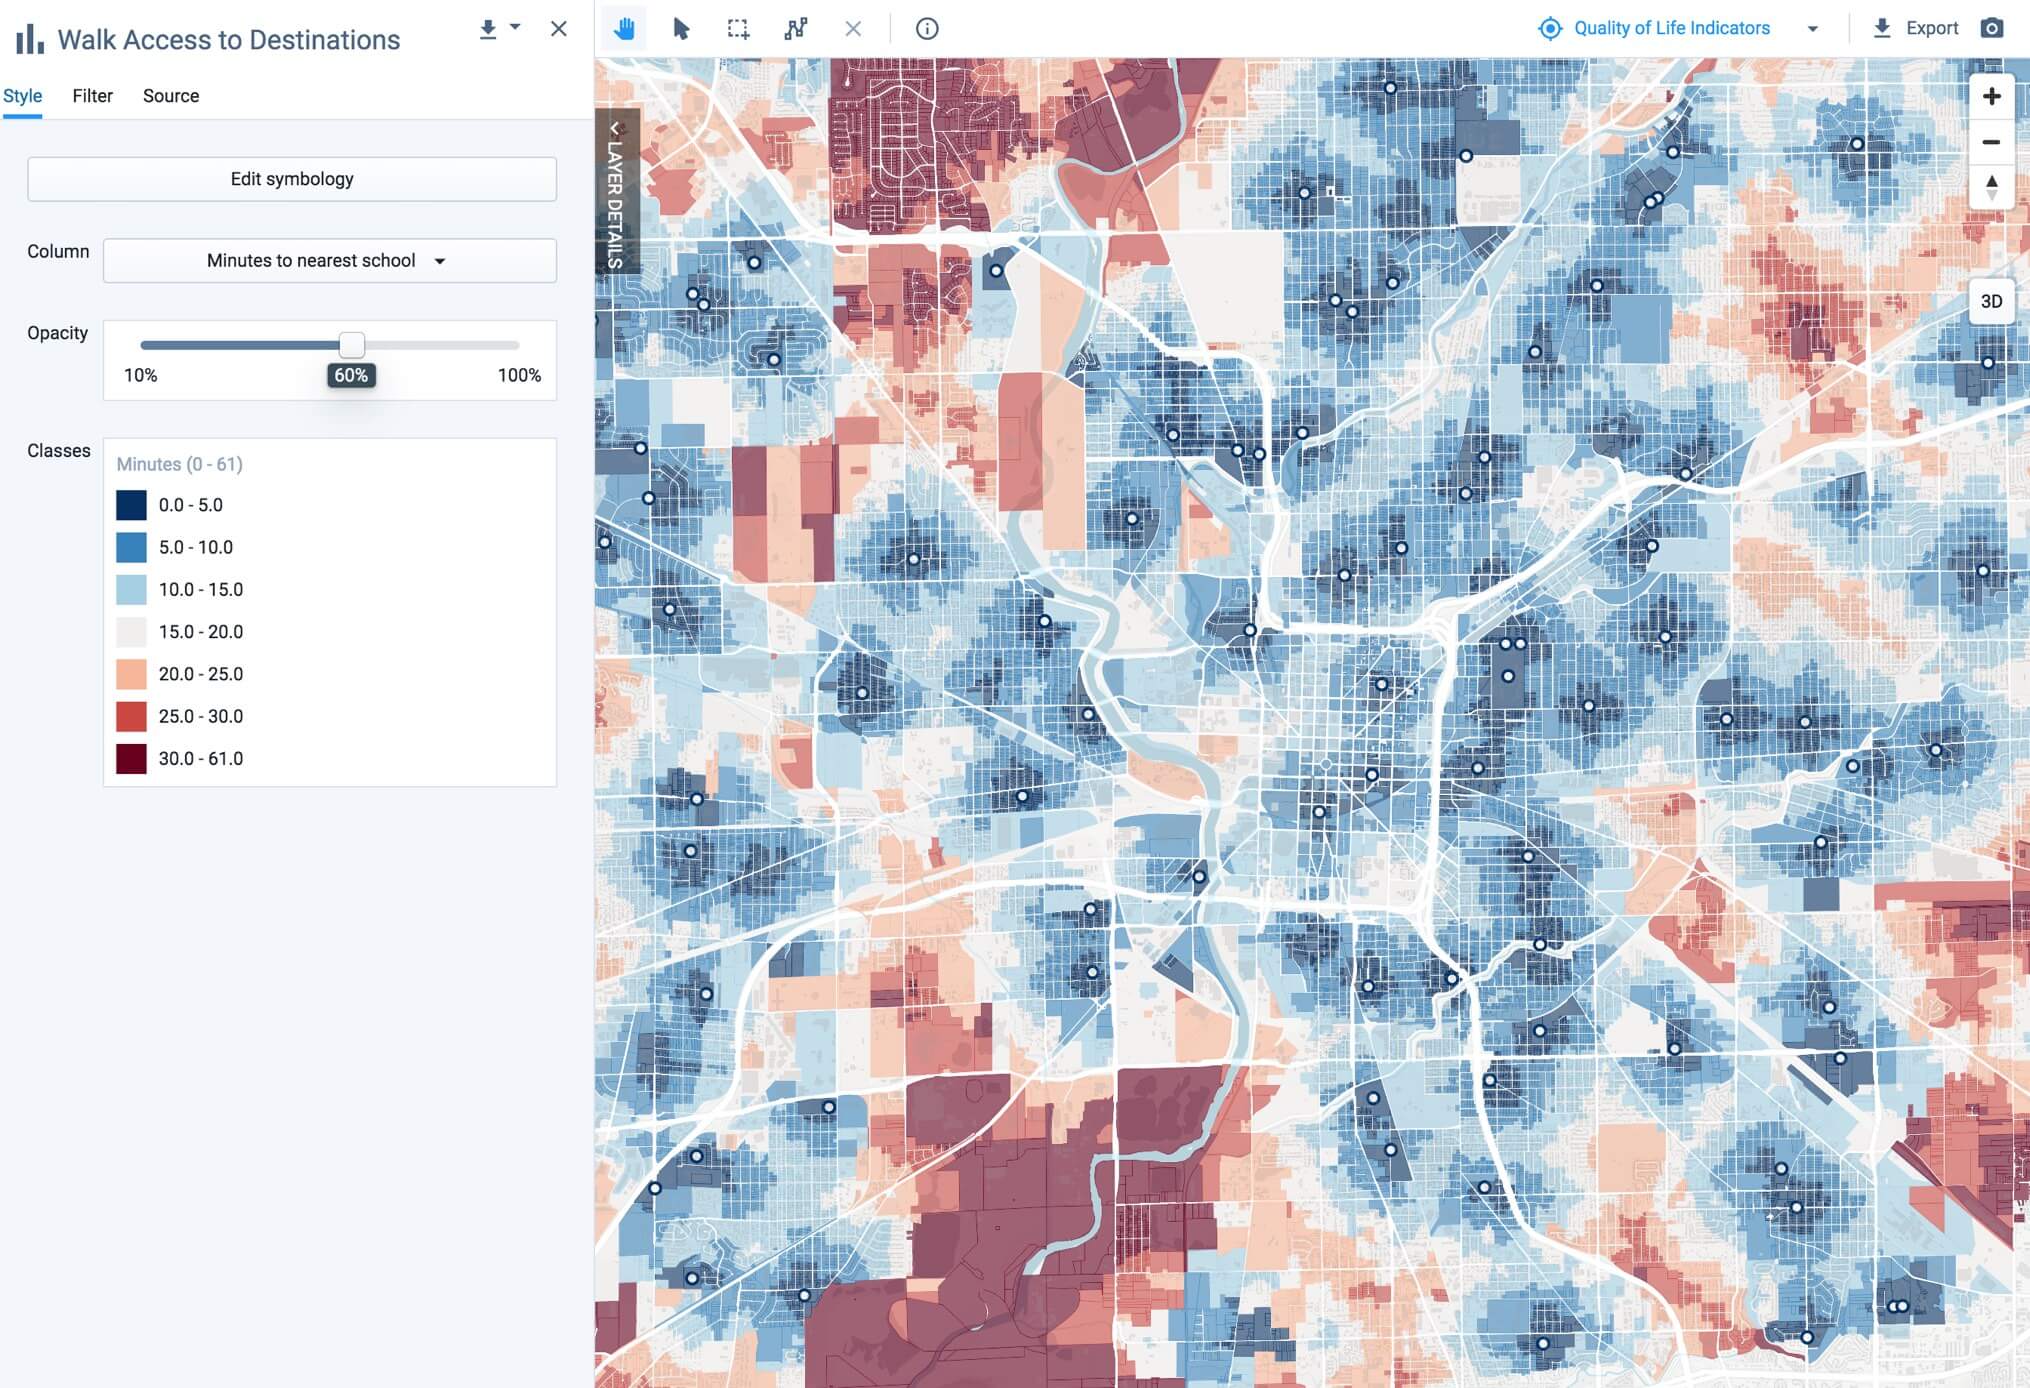
Employees with children will want easy access to schools.
Results for Question 1: Where do target employees live that are accessible by public transit?
The northern corridor of Indianapolis and downtown have a high density of college-educated residents between the ages of 25 and 44, which were identified as your company’s target employees. Running UrbanFootprint’s Transit Accessibility Analysis Module revealed a strong connection between the downtown core and the northern section of the city.
Visualizing employment access via transit within 30 minutes was particularly useful in a mid-sized American city. In this example use case, we used this as a heuristic measure of economic freedom – households here have greater potential flexibility than households at a greater distance from transit and connections have been developed between these employment clusters to better serve these populations. Such measures, when combined with other constraints, can help identify a workforce source that is situated in an area with strong economic and talent momentum.
Question 2: Is there a site suitable for corporate development near the identified zones?
Next, we’ll use the layers we created in question one above (areas with high concentrations of college graduates, areas where jobs cluster, and general indicators of quality life) to identify target employee zones. We can also leverage parcel-level land use data to select parcels that are underdeveloped or low-density commercial within a half-mile of the target employee zones. By combining this with criteria for size (acres) and number of existing employees, our analysis yields 20-odd parcels.
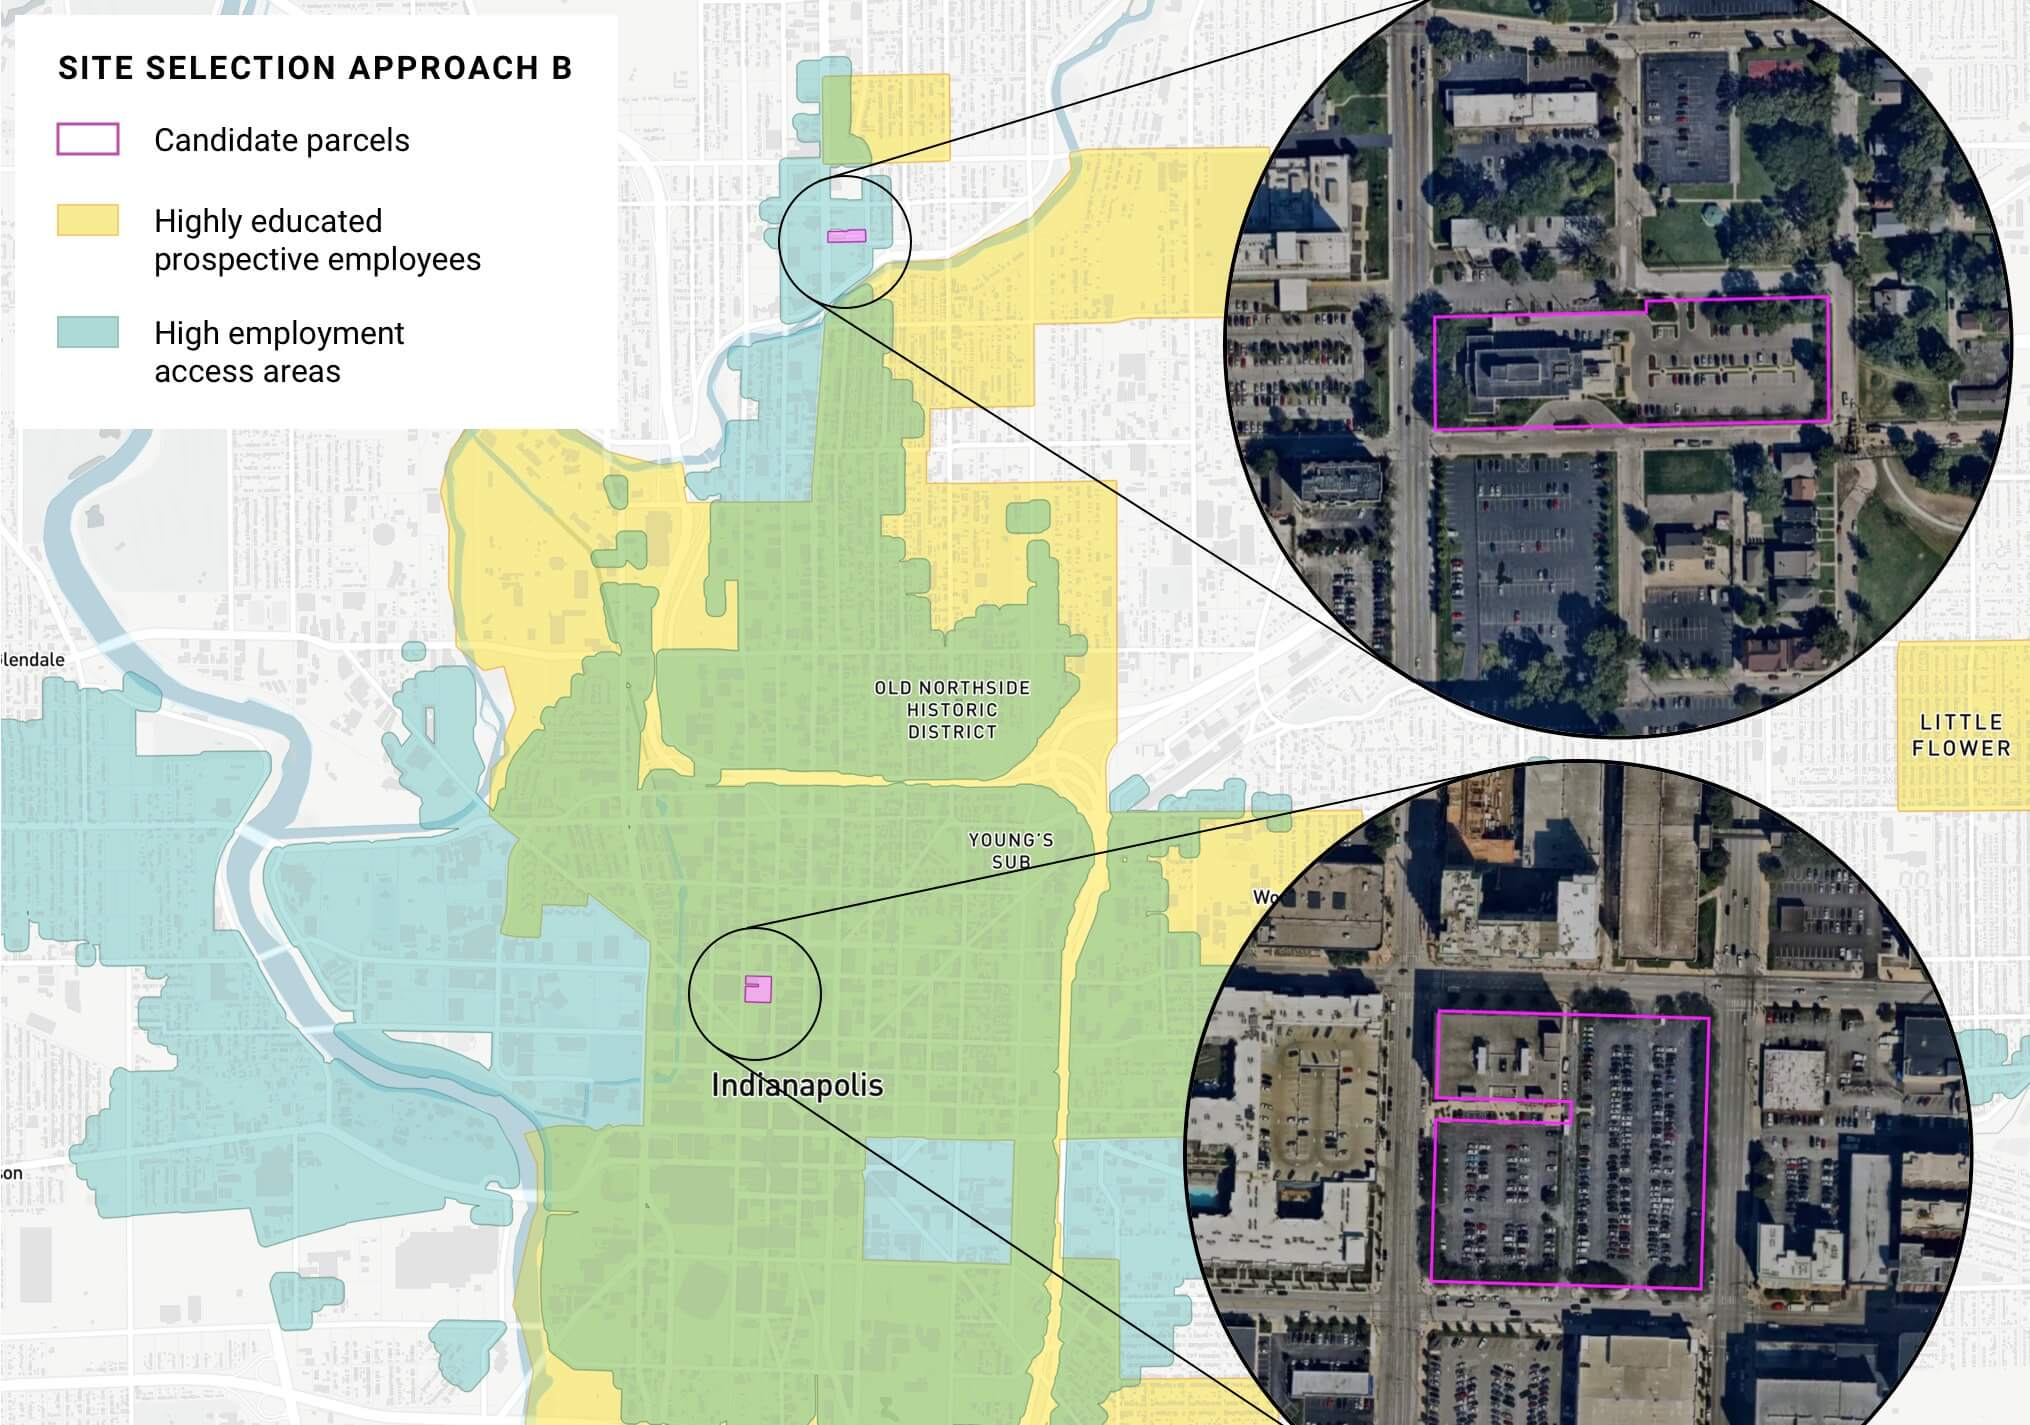
Results: What location is both attractive to target employees and accessible from where target employees live?
The analysis in questions one and two initially resulted in 20-odd possible parcels. We then further refined our selection criteria to include key quality of life indicators, which we mapped in question one. This yielded two promising parcels within a 5-minute walk of retail and to a park, as well as within a 15-minute walk to a school. Both sites are low-density office parks with few current employees. One is 2.57 acres while the other is 3.89 acres.
In summary, our site selection analysis identified a few options for further investigation
Check out a summary of the results for each option below.
| Approach A: Optimizing for development cost | Approach B: Optimizing for target employees |
| Based on cost constraints, our analysis identified two suburban sites in southwestern Indianapolis near the airport that have the potential for direct freeway access. Although the sites meet cost constraints, neither are within commuting distance (via a mix of non-vehicle transit modes) to their target employee profile of college-educated, 25-44 year olds | Based on both demographic and transit accessibility, our analysis identified two likely sites near downtown and near existing clusters of target employees. Additionally, both sites are within close commuting distance via a mix of non-vehicle transit modes to their target employee profile of college-educated, 25-44 year olds. While the identified sites are significantly smaller than the sites in Approach A, the costs incurred to build a more urban office would likely be offset by their competitive advantages for attracting talent and minimizing commute-related costs. |
And there you have it! With thousands of ready-to-map datasets at your fingertips, you can use UrbanFootprint to analyze suitable locations for your next office. Real estate analysts, planners, and expansion team members can approach site selection from multiple viewpoints, and rapidly hone in on individual parcels without having to find, clean and load data, develop manual analyses, or have specialized GIS training.
Ready to build your own site selection analysis?
Book a custom demo with our team to get started. We’ll spend some time learning more about your site selection challenges and walk you through how to set up your own corporate site selection analysis with UrbanFootprint.
