


The nation and the world are grappling with an unprecedented challenge in staving off COVID-19 and “flattening the curve” of this global pandemic. With school closures, mandated social distancing and entire industries shutting down, life isn’t what it once was just a few short weeks ago. As we work to adjust our lives to this “new normal” and a time of uncertainty, it’s clear that many populations within our communities are most vulnerable to the effects of the virus. With limited information available, however, it’s difficult for public agencies, researchers, and NGOs to know how and where to deploy resources where it will matter most and save lives.
To help, our team of data scientists, software engineers, and urban planners is ramping up urgently to support state and local agencies, researchers, and our user base of urban planning practitioners, public agencies, enterprises, NGOs, and academic institutions to access and map critical data to aid in emergency response, tracking, and planning efforts. Even as we “shelter in place” here at home in the San Francisco Bay Area, we can provide actionable data and real-time insights about how COVID-19 is impacting cities, vulnerable populations, and the daily dynamics of urban areas across the country to aid in emergency response and mitigation efforts.
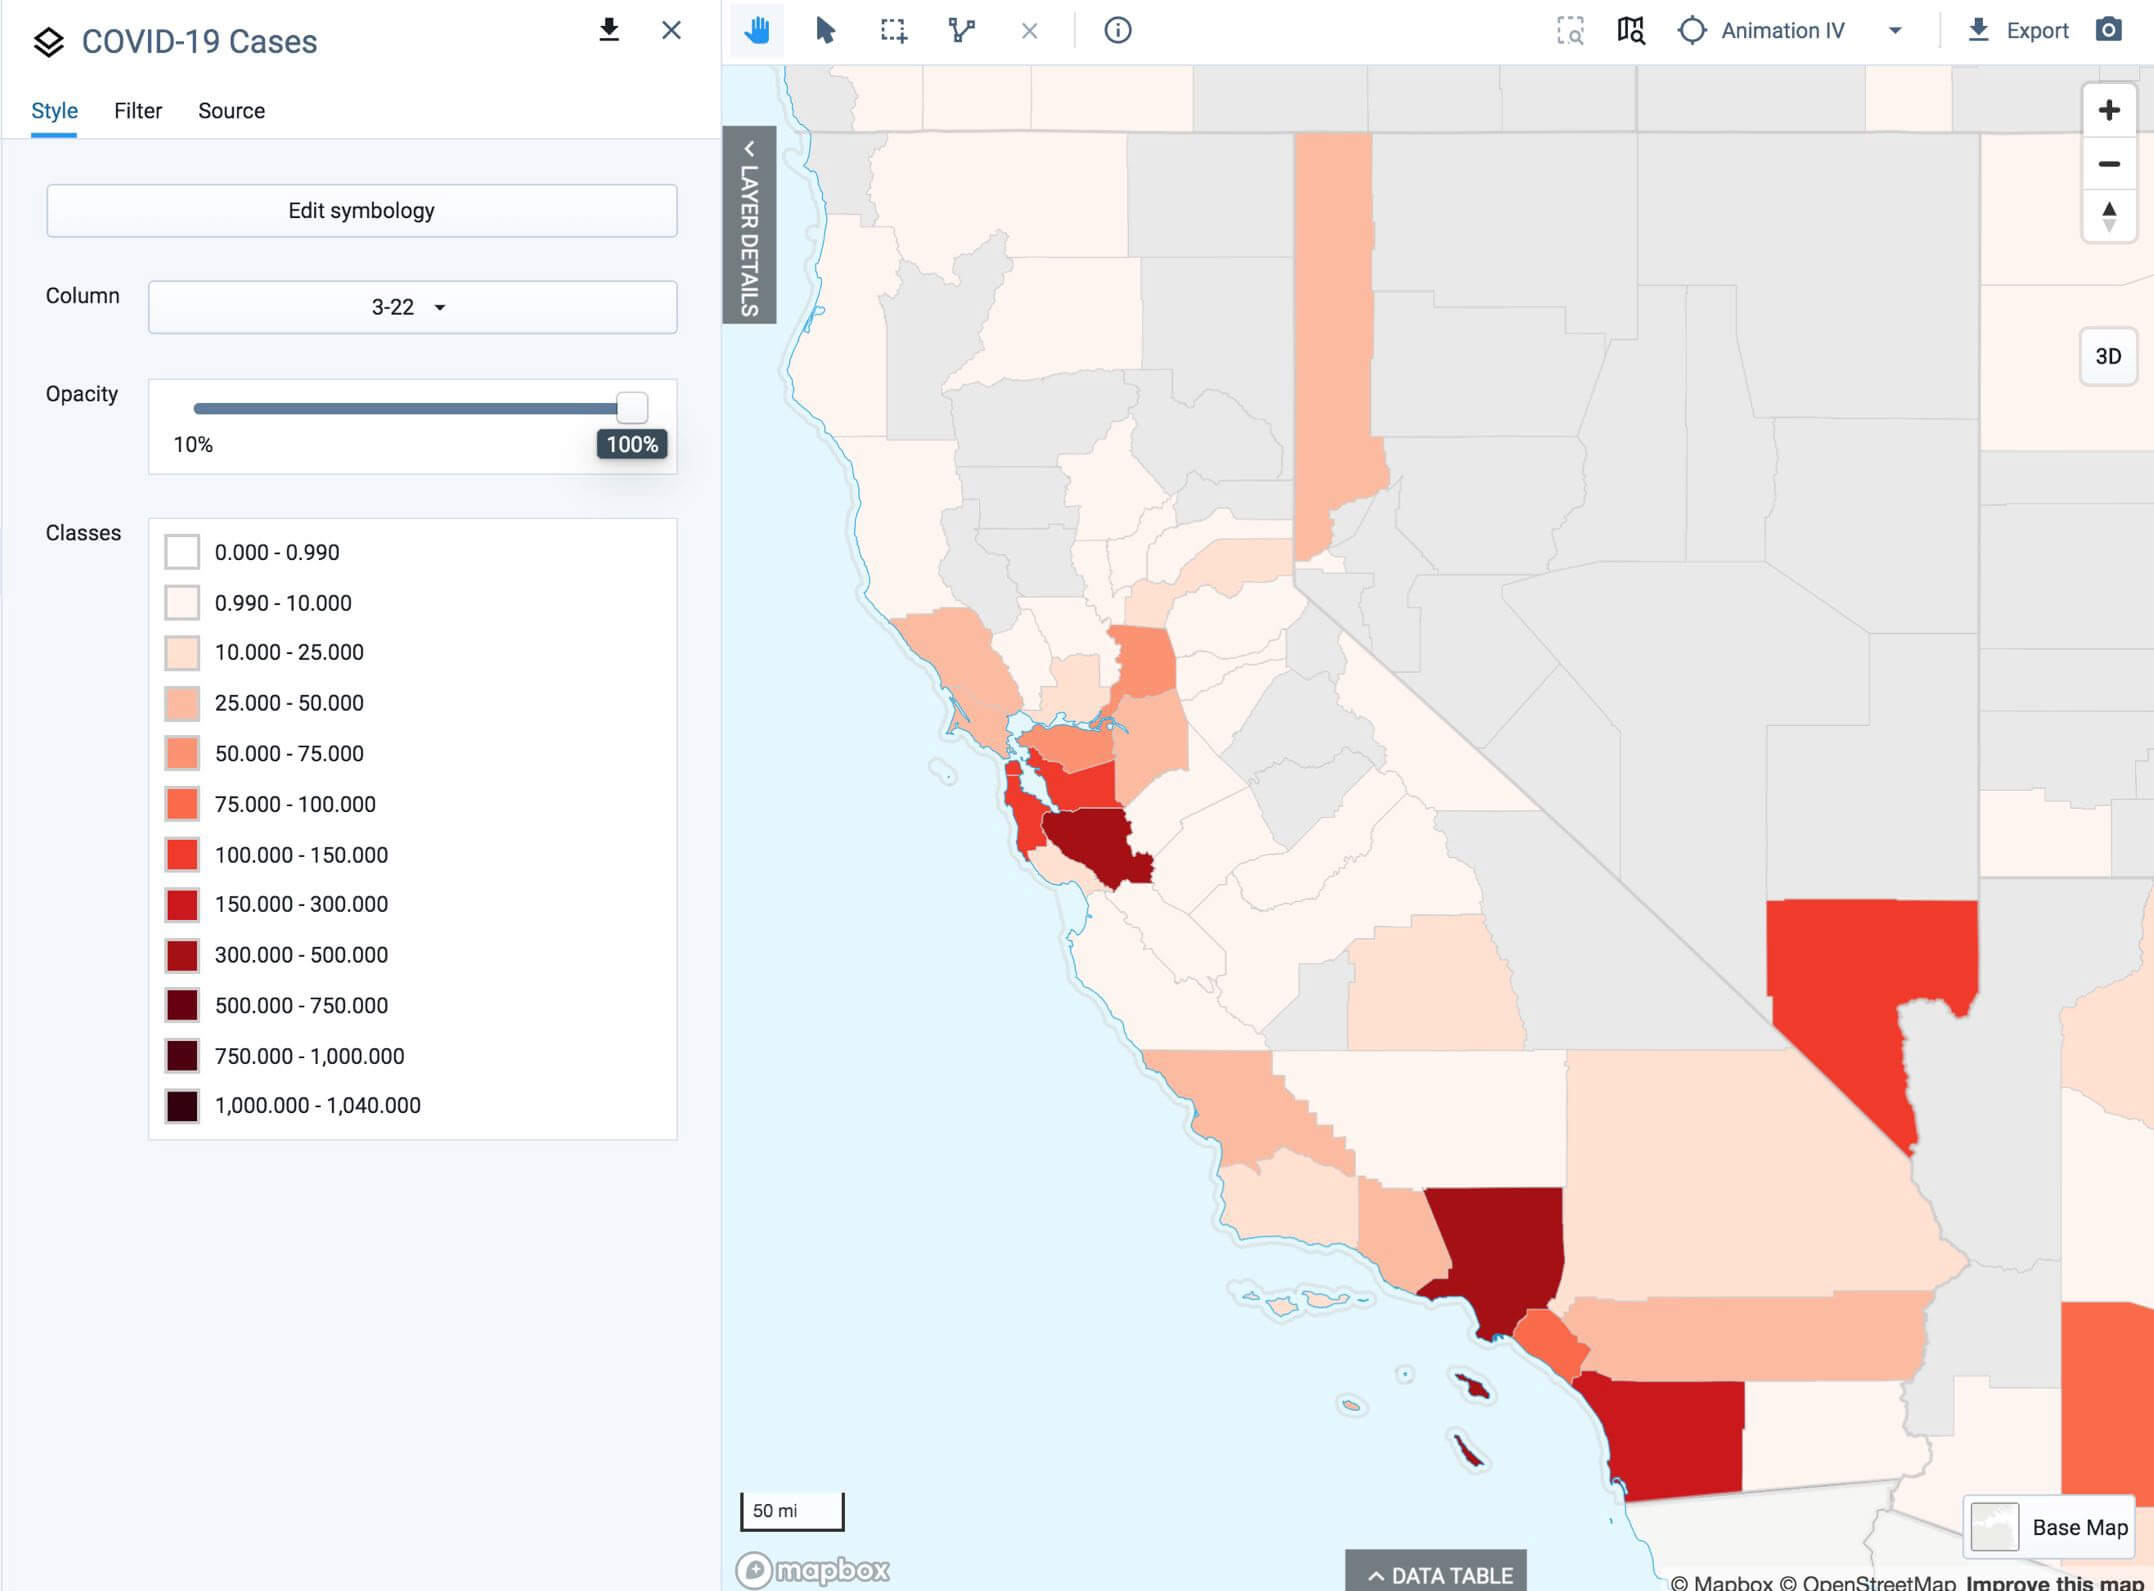
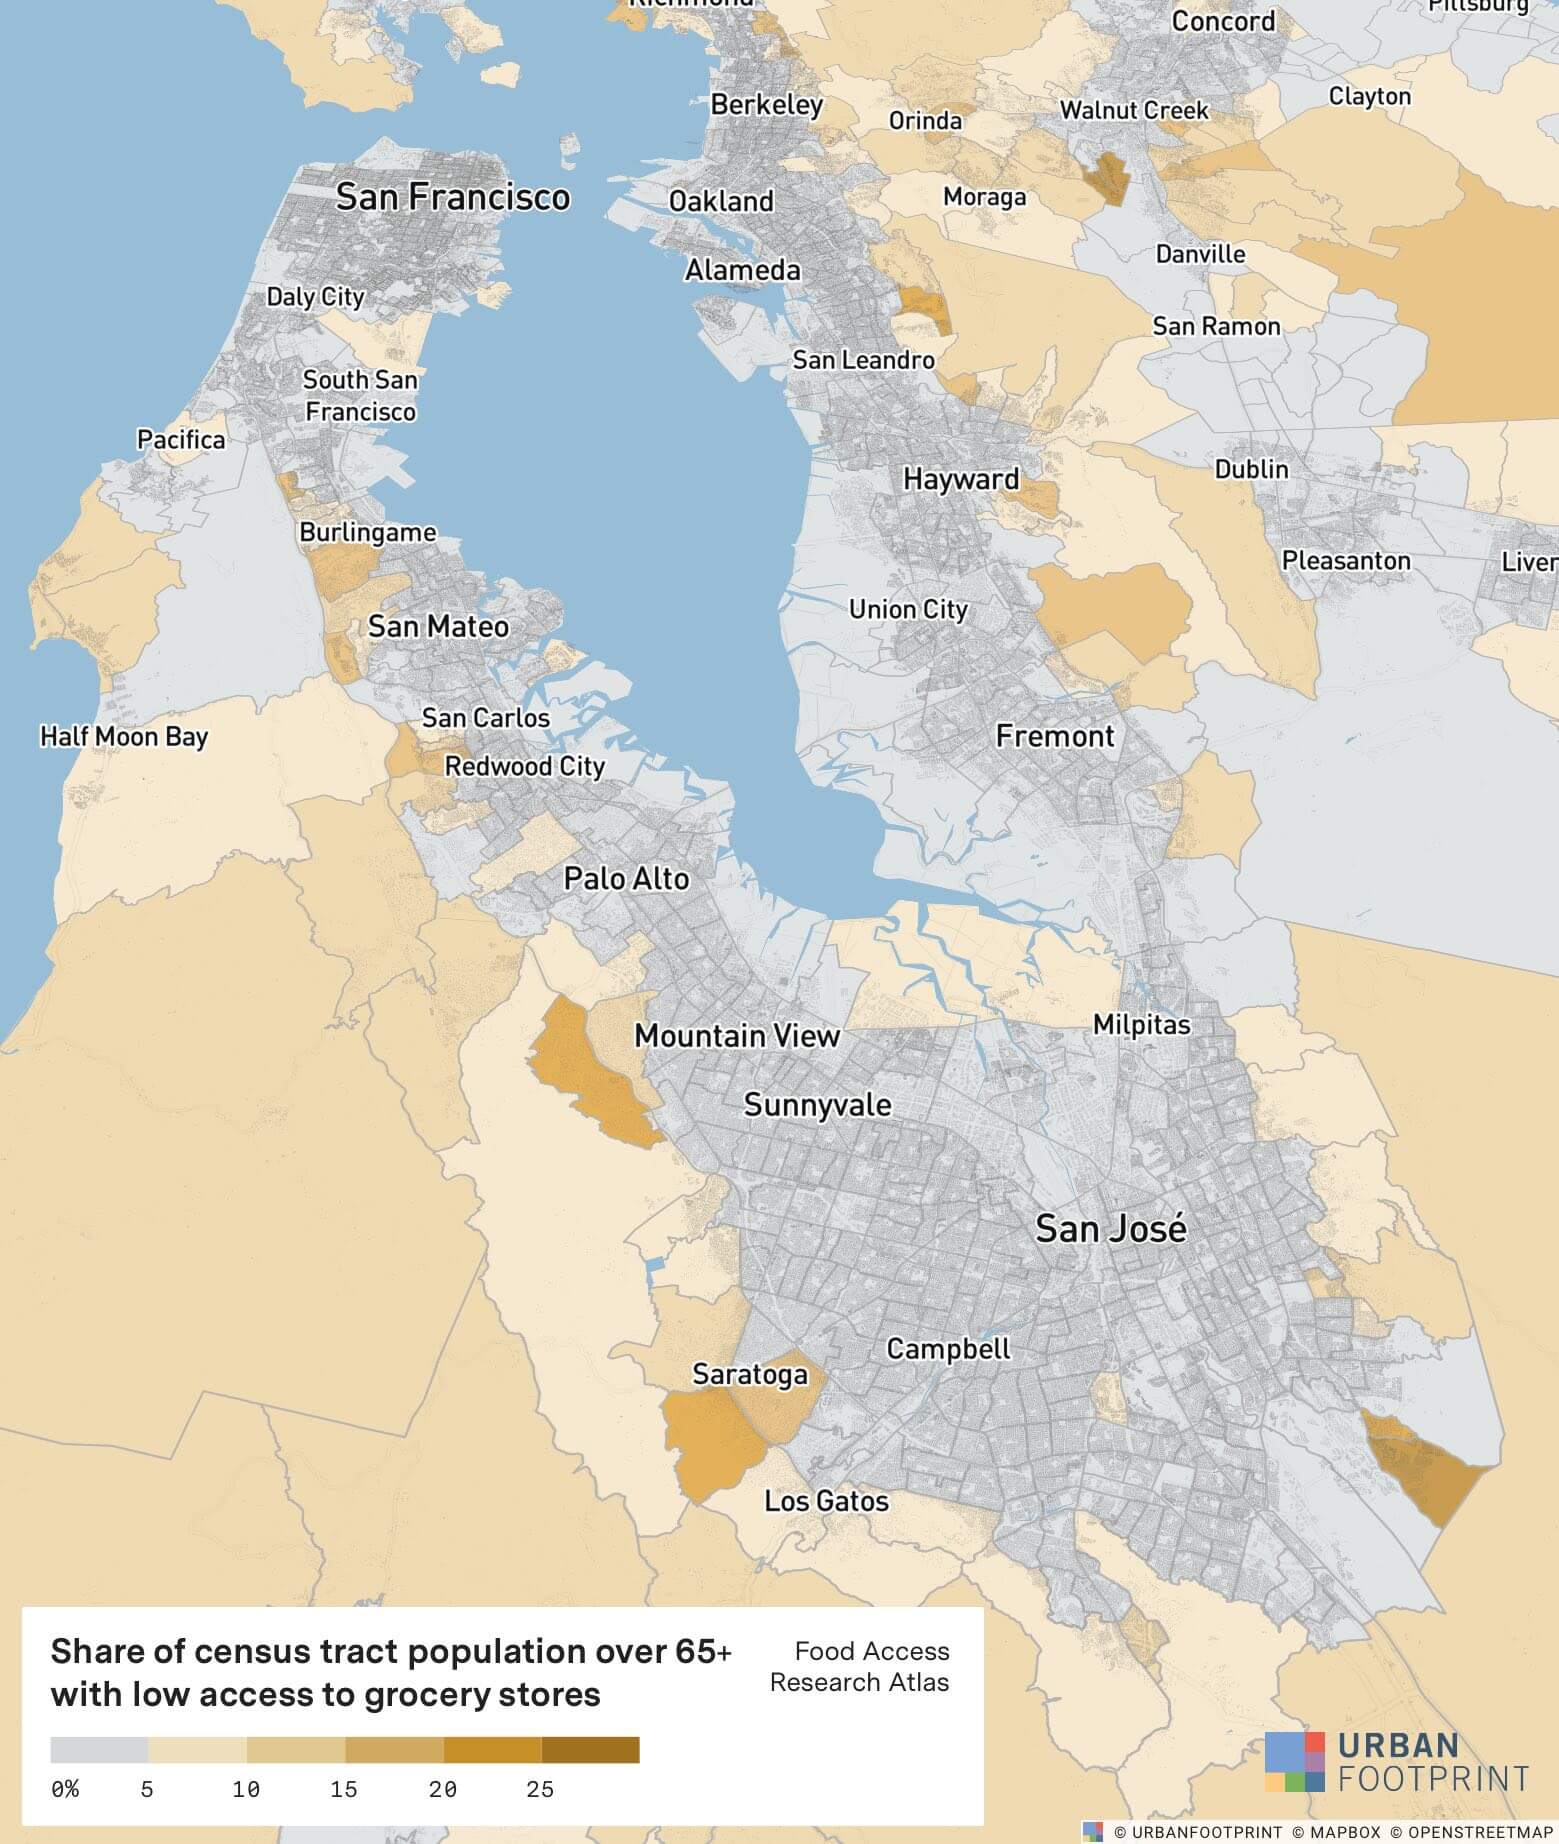
Combining the latest data about COVID-19 incidence and spread with UrbanFootprint’s built-in data and analytics, we can map and measure potential impact on specific areas and populations within cities. This becomes particularly important as more communities are required to “shelter in place” and travel is limited to trips for food, medicine, and other essential services. Where are older at-risk populations concentrated? Where are areas with poor access to food outlets and grocery stores? And where are there high concentrations of households without access to cars? These questions are critical as we think about how to ensure access to food and services and how to limit disease exposure to those most at risk.
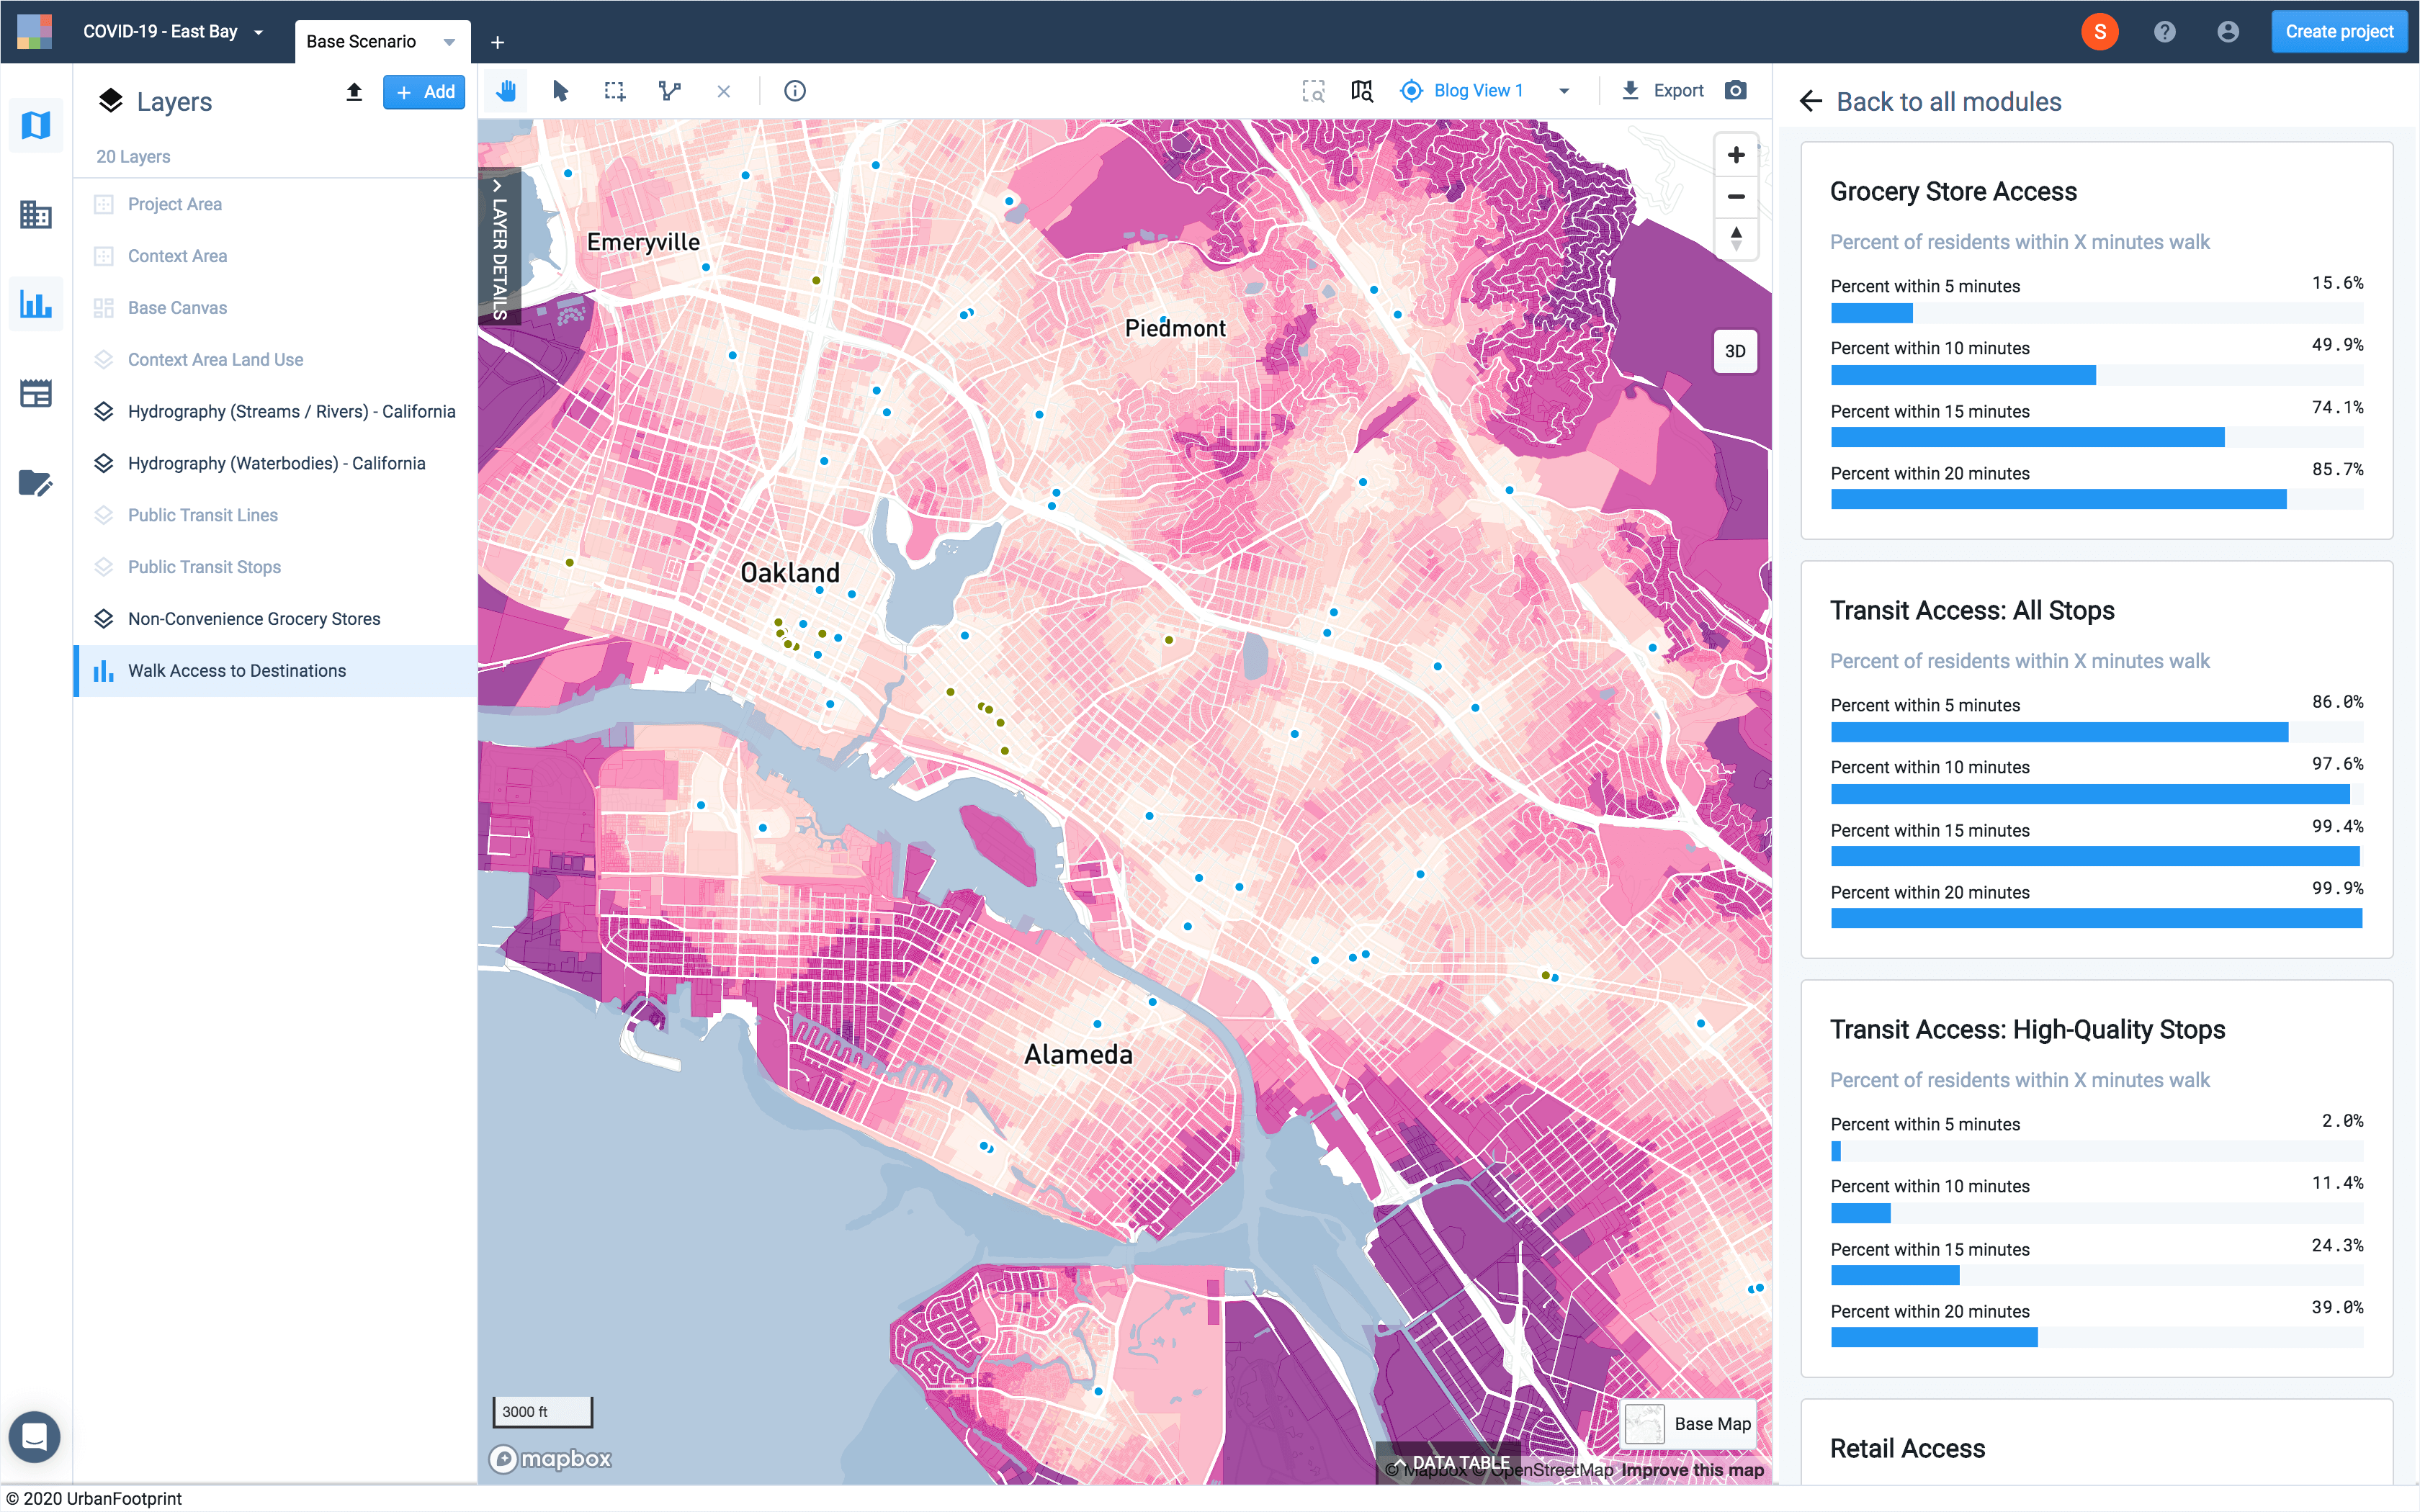
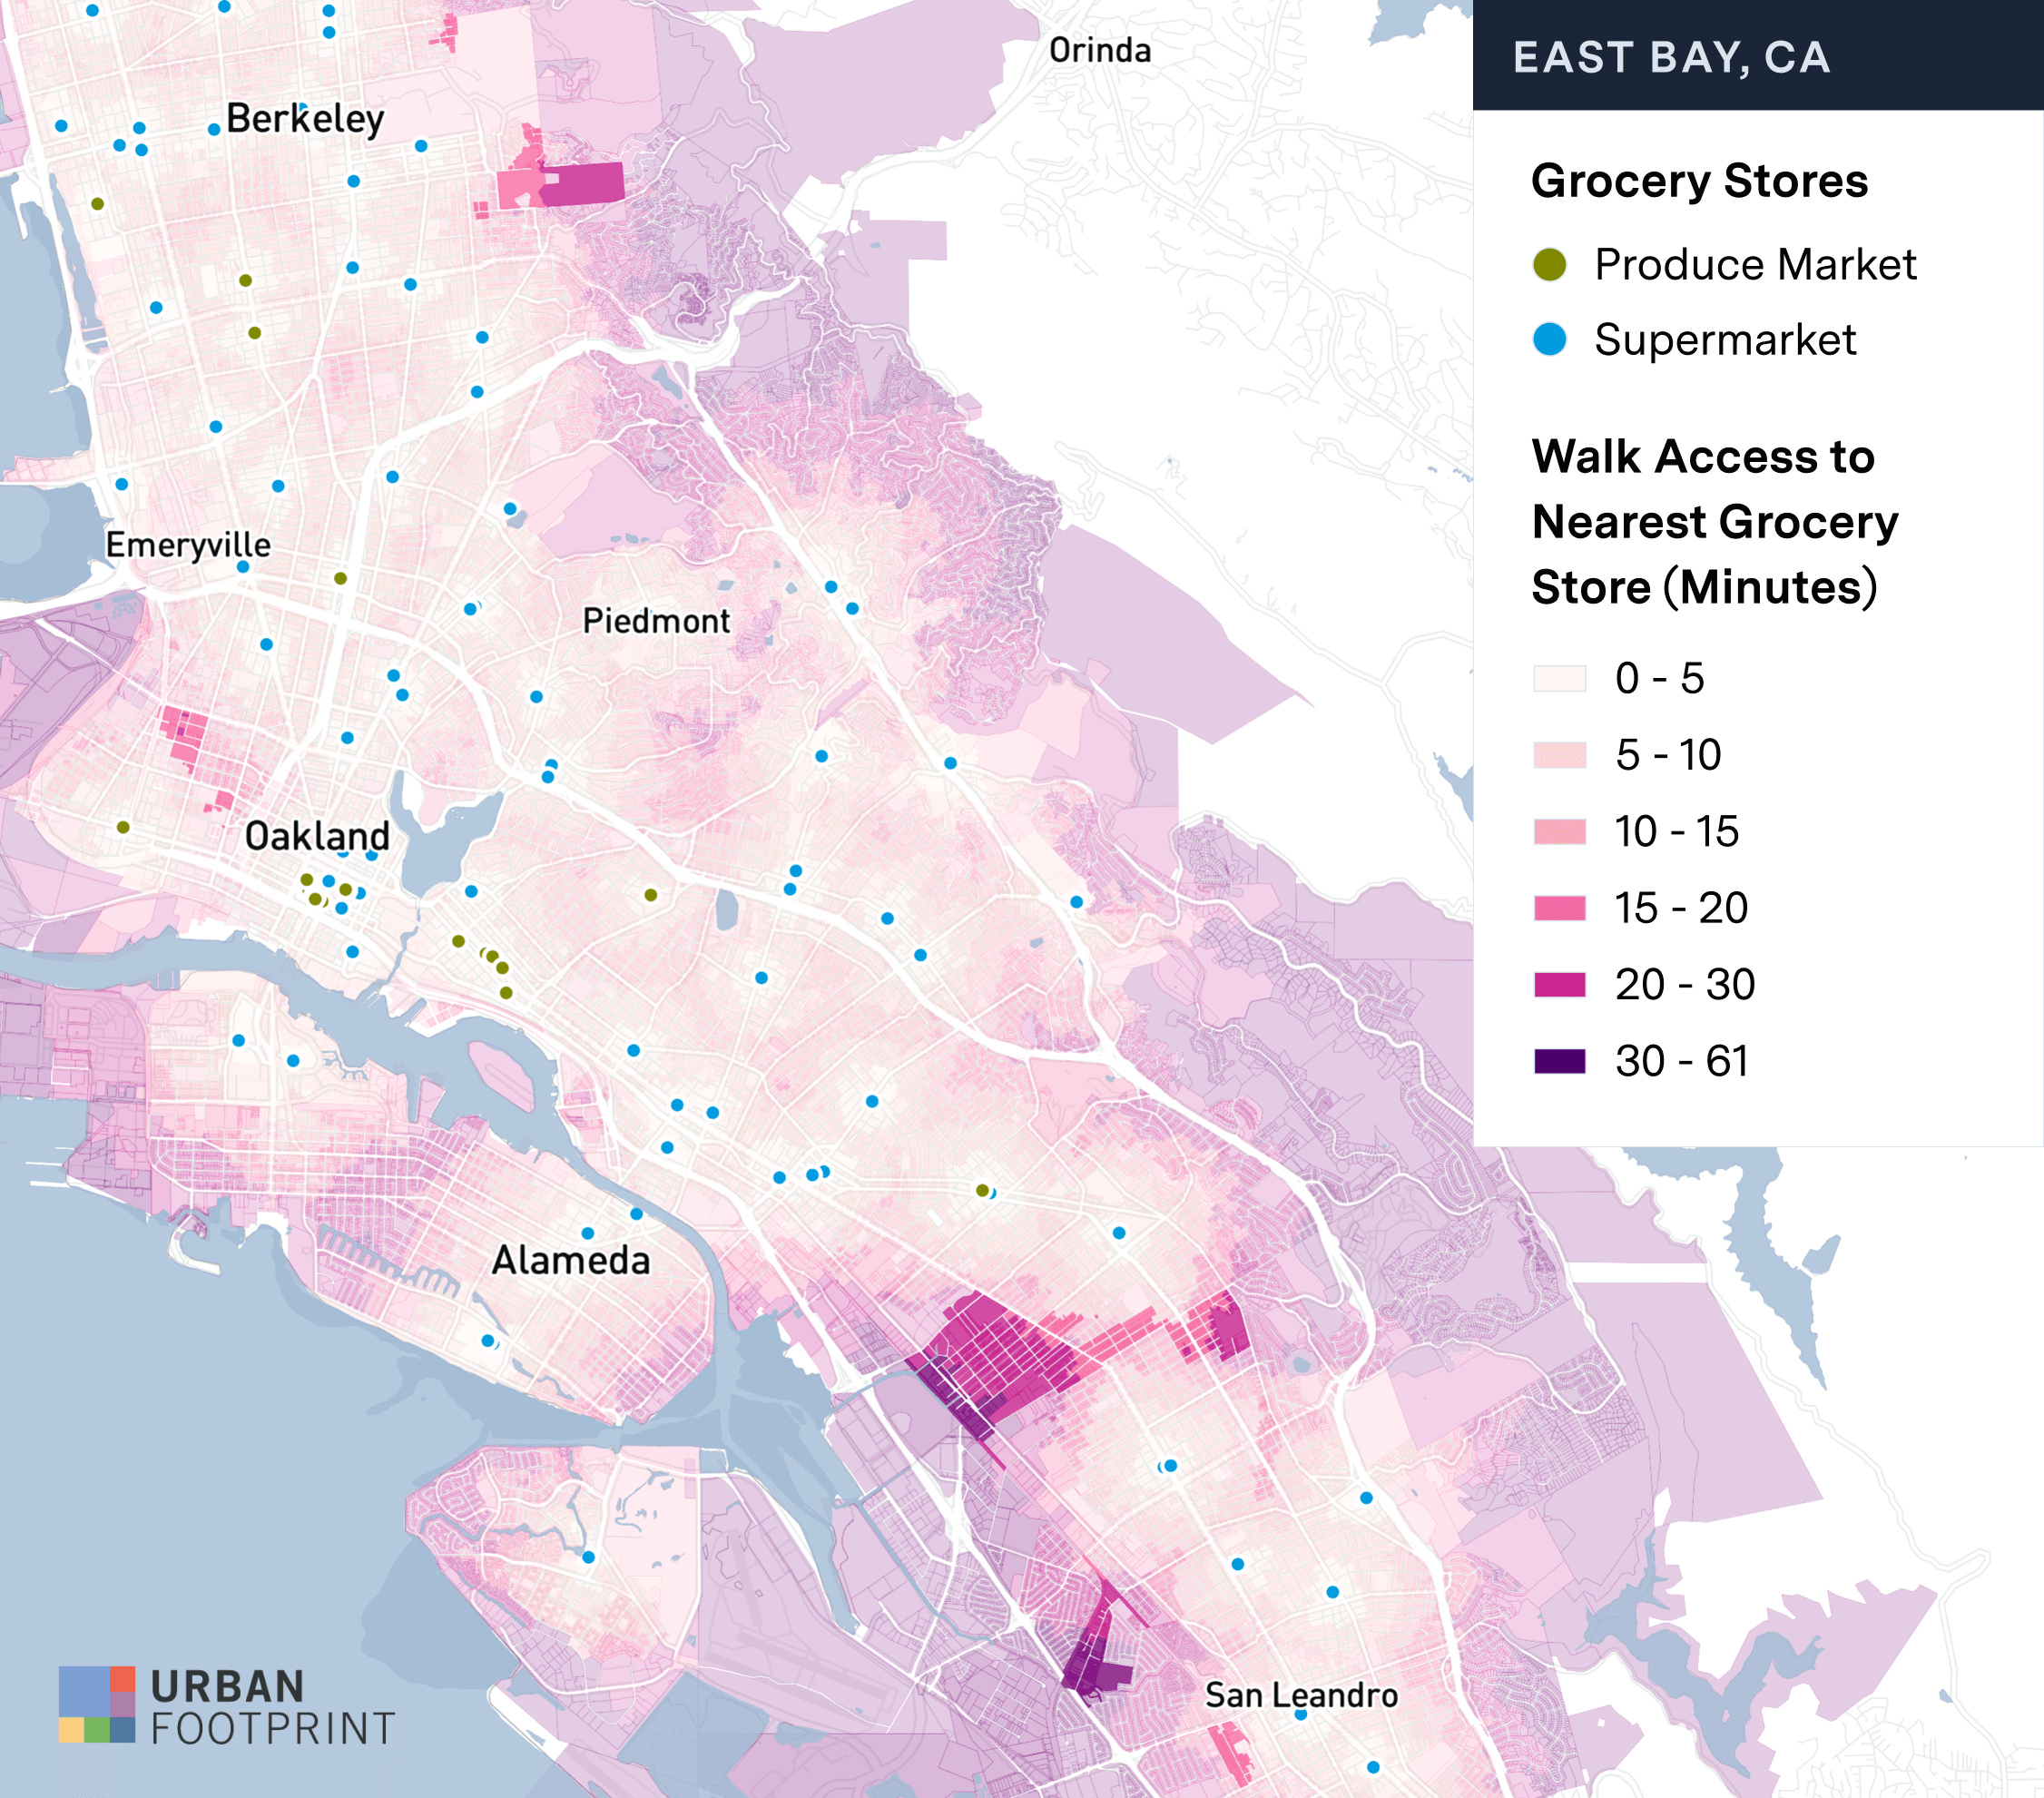
In California, where all residents are being asked to stay home except to make essential trips, access to critical services like food and medical facilities is uneven. We can use UrbanFootprint to map and analyze walk and transit access to key locations, and then further analyze the vulnerability of populations in poor access areas. To start, the map above is a network analysis of walk access to grocery stores in the East Bay of the San Francisco Bay Area. While 75% of residents in this area are within a 15 minute walk of a grocery store, there are some significant areas with much poorer access, highlighted by the darker areas in this map.
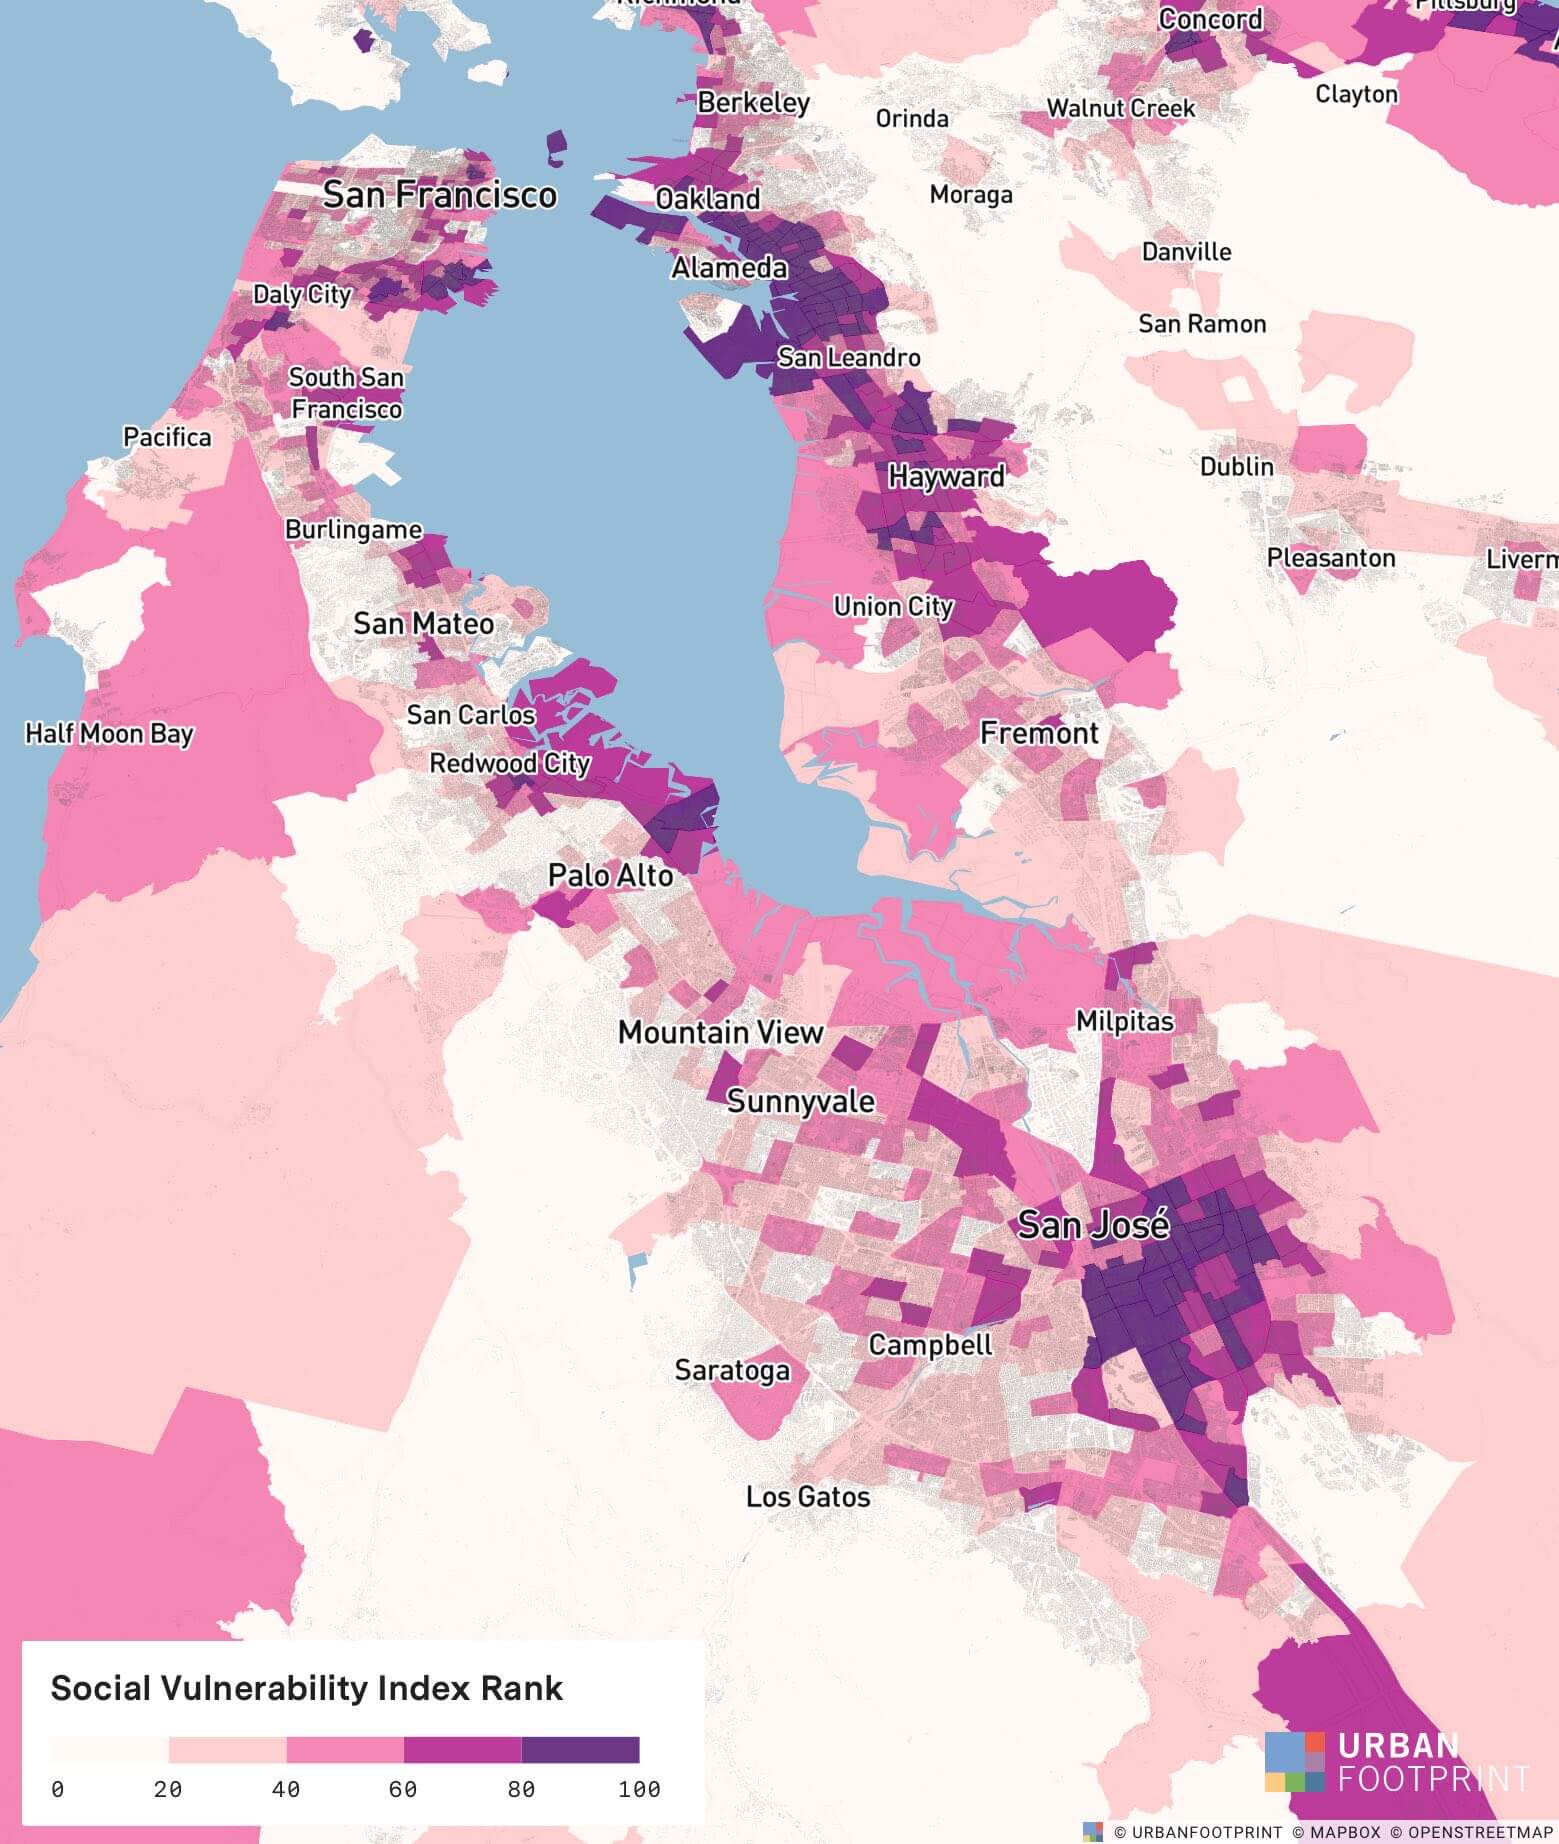
We can then hone in where people are most vulnerable, in this case looking for low income communities and areas where many people do not have access to an automobile. Using built-in socio demographic data we can identify lower income areas that also have poor access to grocery stores.
And then we can further identify areas that also have very low levels of access to automobiles.
Here we see specifically where this area has residents that live in areas with low access to grocery stores, high levels of poverty, and low rates of auto ownership. UrbanFootprint tells us there are approximately 2,800 parcels housing more than 13,000 residents in areas with this combination of risk factors.
This type of analysis can quickly enable an agency or stakeholder to hone in on those areas needing specific assistance during this crisis.
UrbanFootprint’s data and analytics tool set can be used to answer these and other critical questions quickly, thereby supporting critical emergency response efforts in real time. Network analysis tools can be used to map walk and transit accessibility to essential services such as food outlets and grocery stores, thereby identifying where we need to deploy resources and close access gaps.
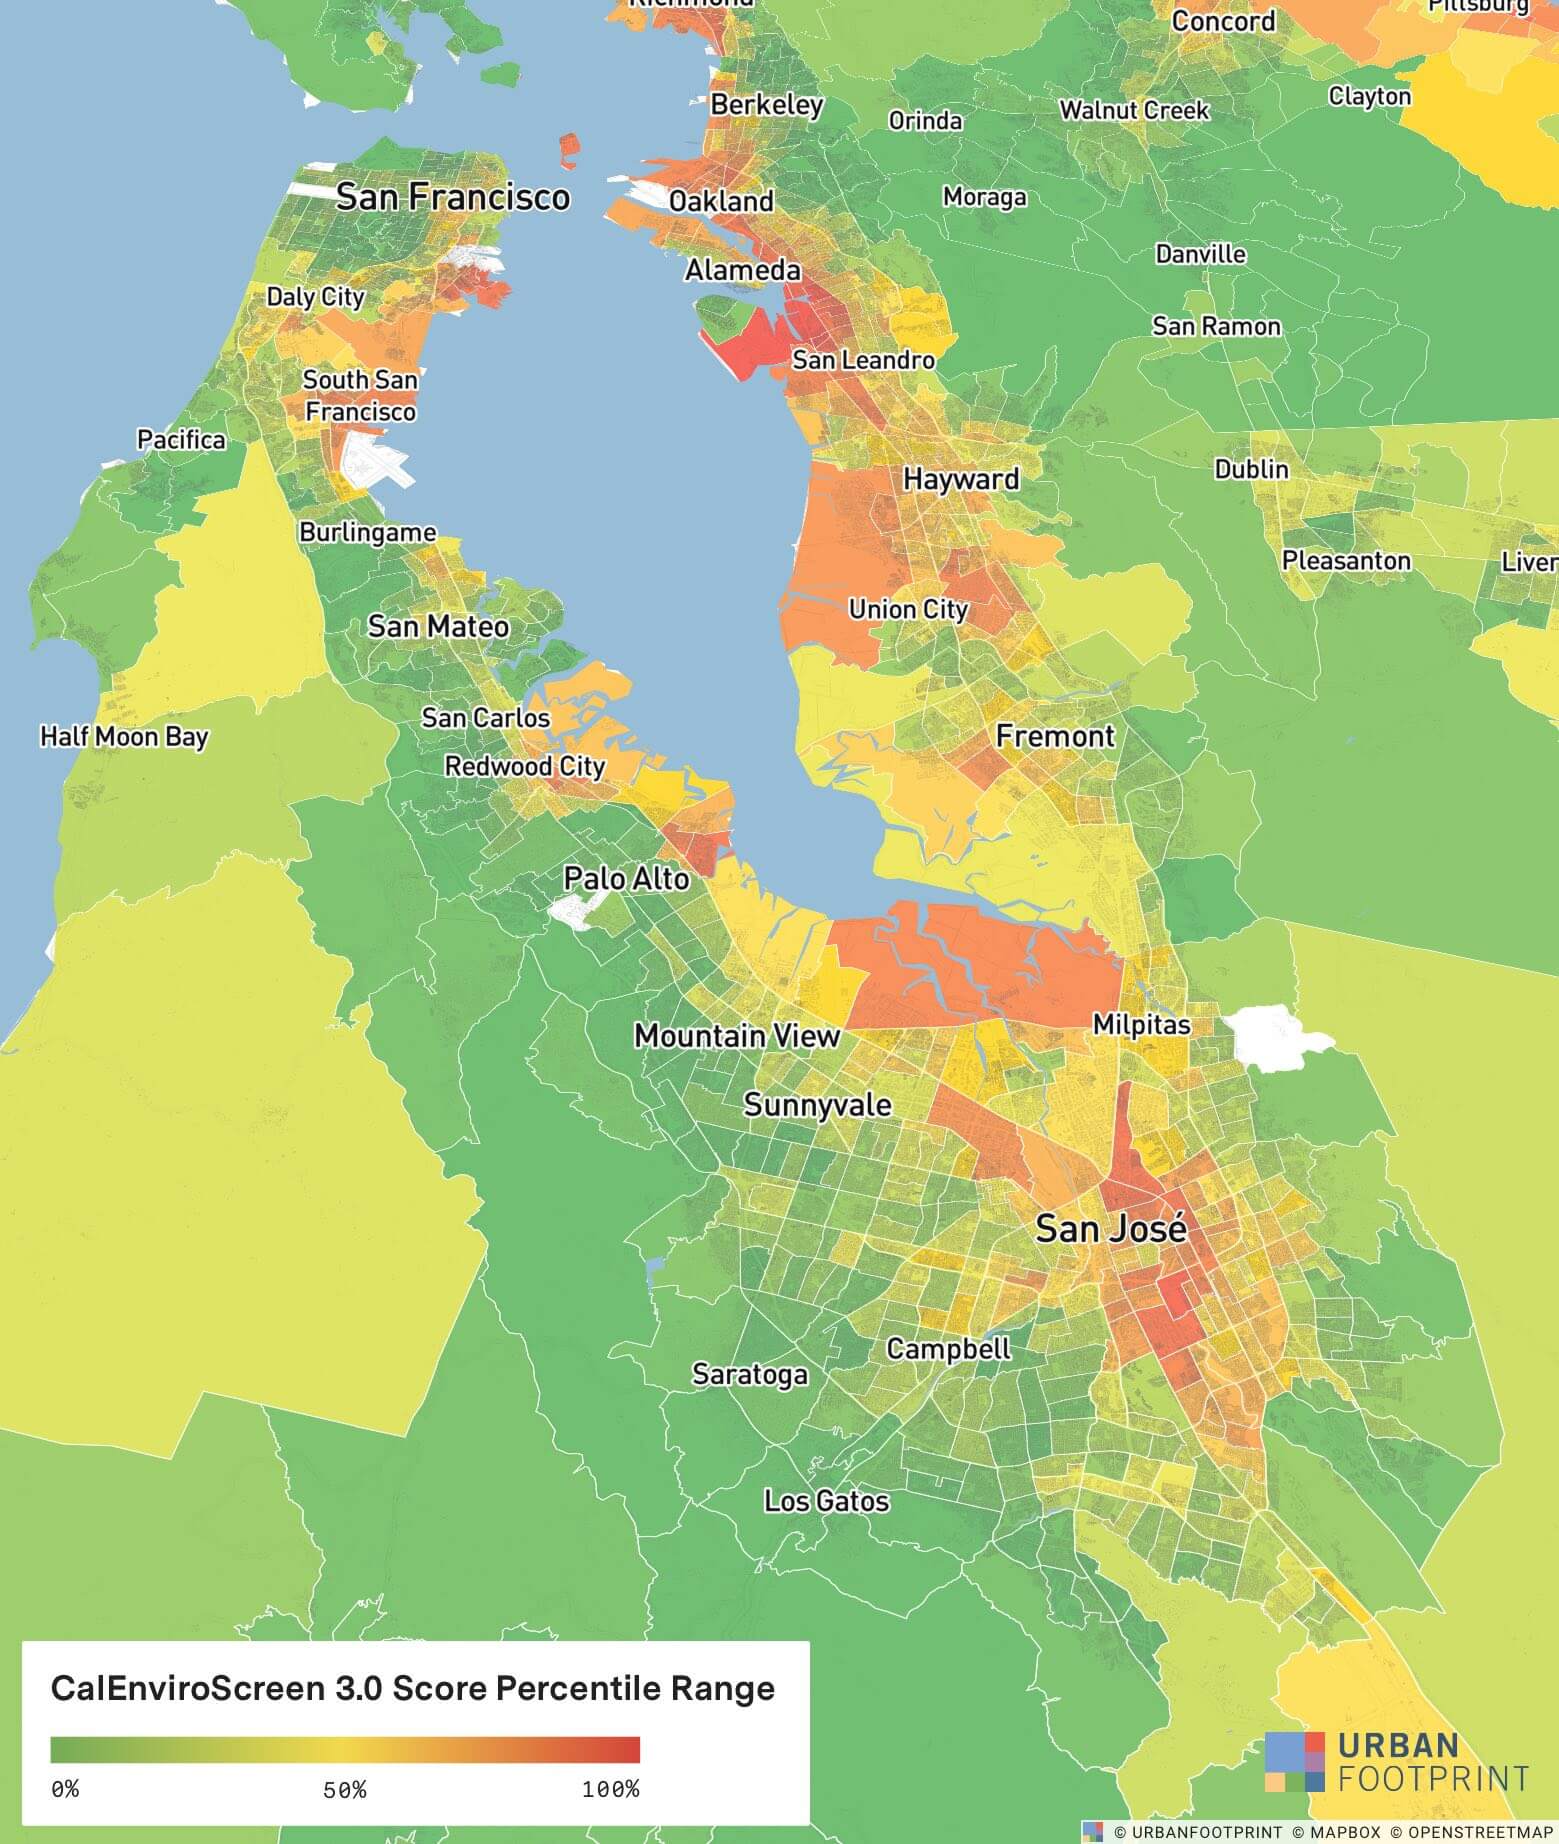
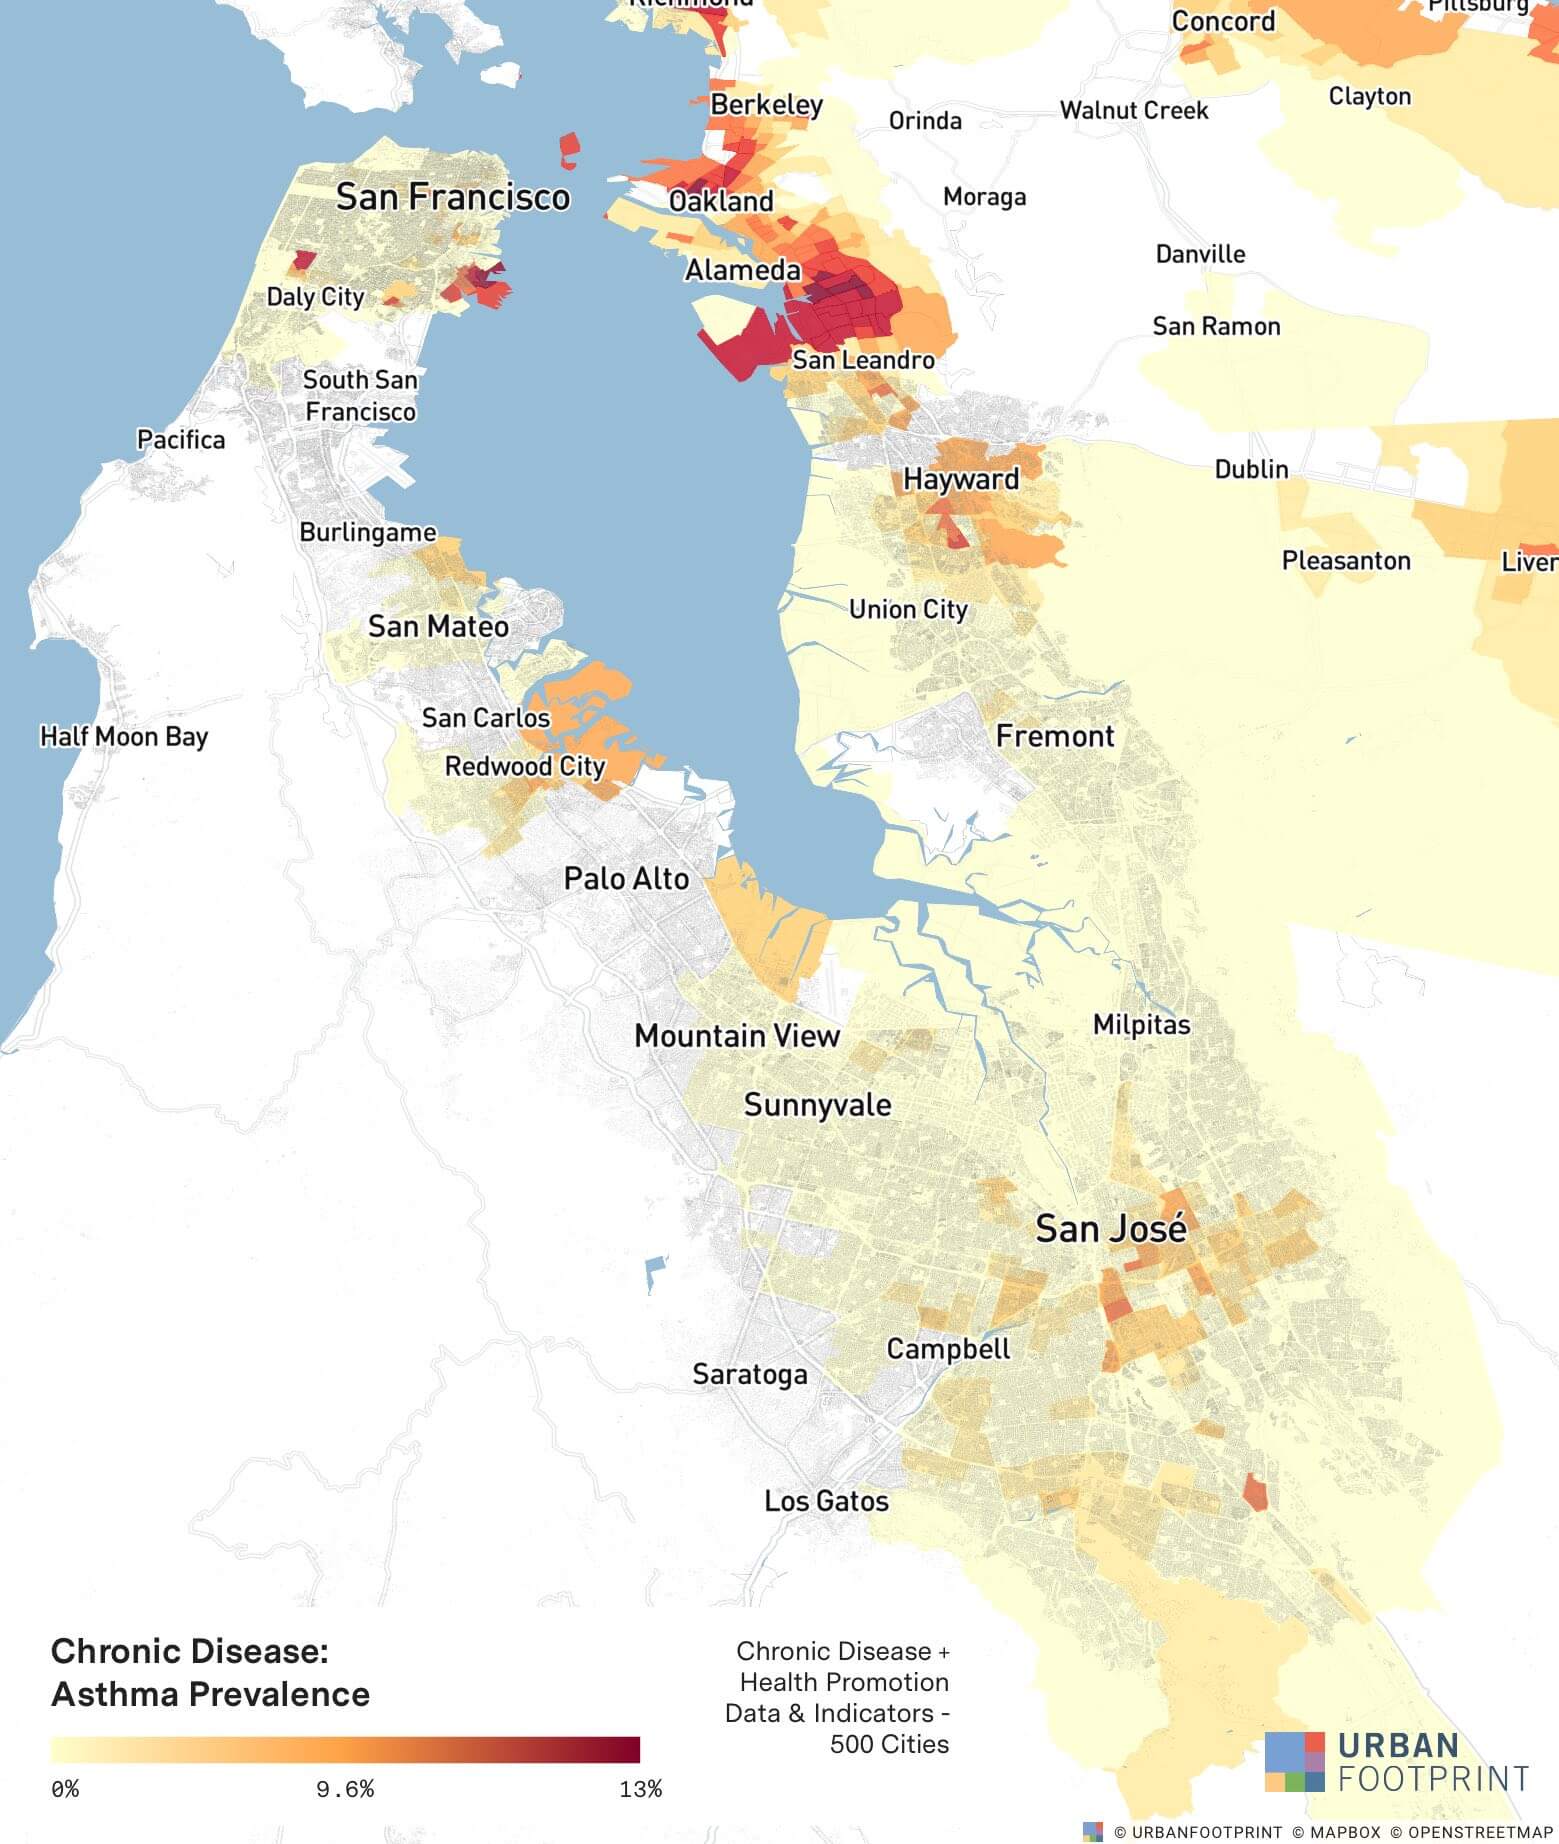
We can overlay this analysis with socio-demographic data to identify vulnerable populations and further prioritize the deployment of resources. In this case, we can use built-in census data, federal health data, and California-specific datasets such as CalEnviroScreen to identify vulnerable residential populations. We can utilize this same workflow and methods to evaluate non-auto access to hospitals and emergency centers, walk-up testing centers (as such data becomes available), and more critical service points. This will help to quickly assess ‘hot and cold spots’ in the network of support services across cities, populations, and areas of high potential disease spread.
CDC Social Vulnerability Index
Food Access Research Atlas
CalEnviroScreen 3.0 Score Percentile Range
Chronic Disease + Health Promotion Data & Indicators – 500 Cities
Some of the other relevant datasets available in UrbanFootprint include:
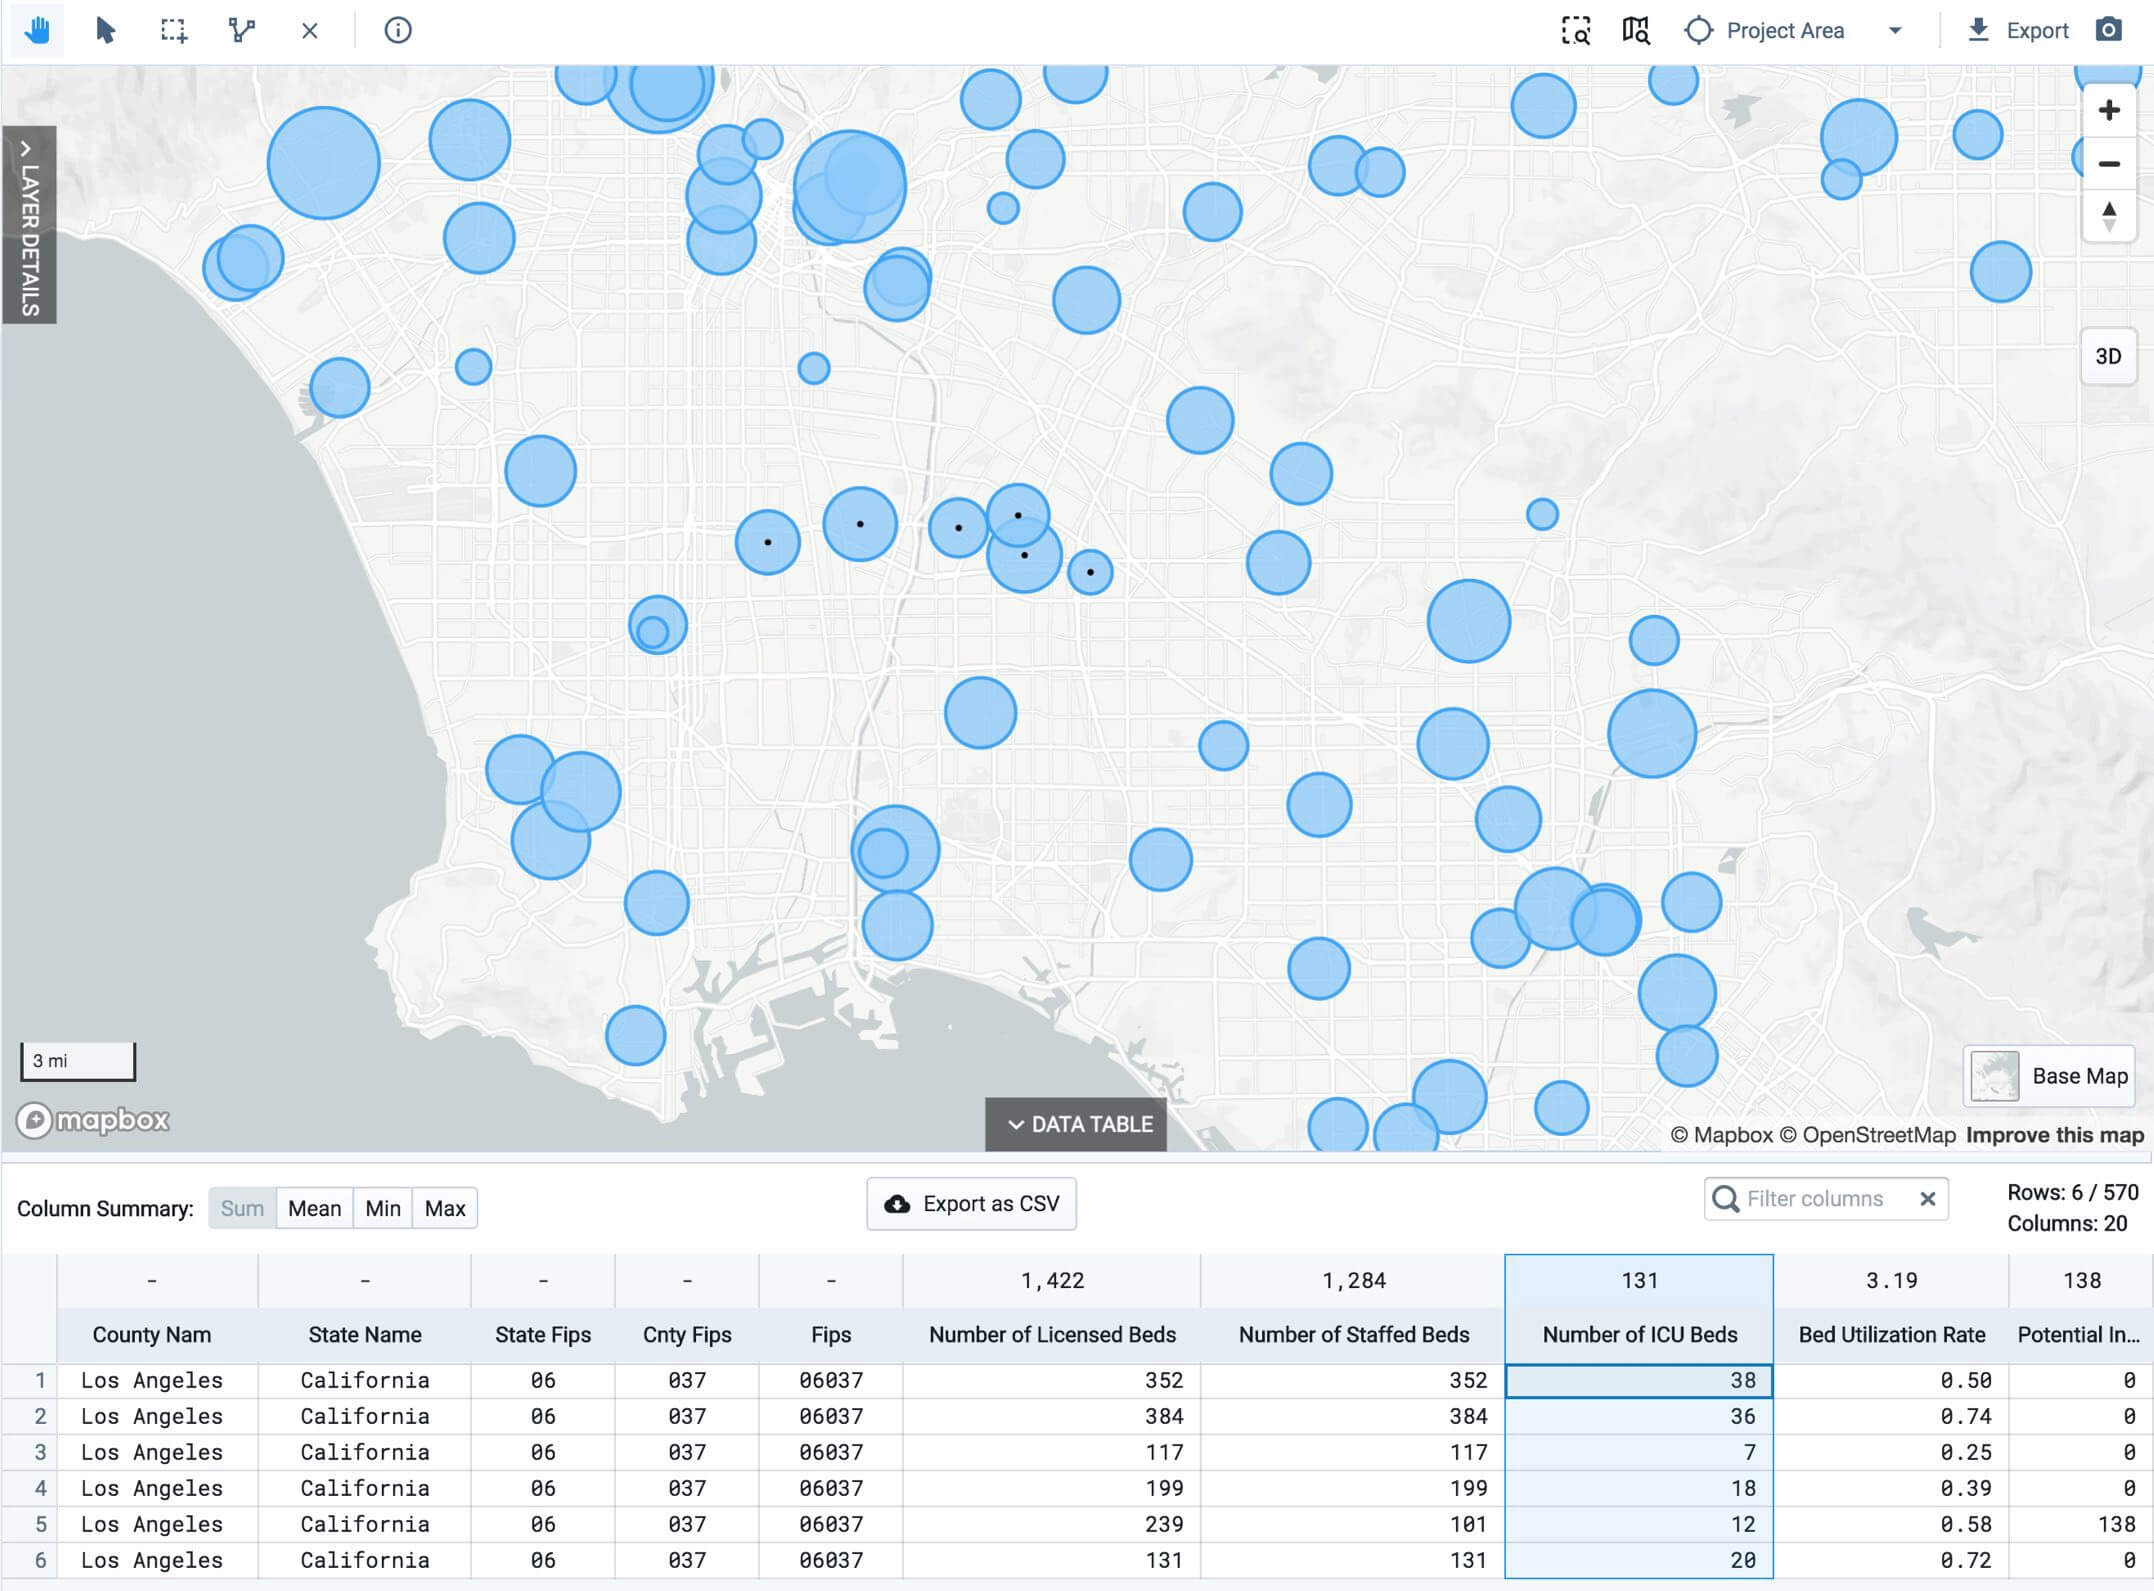
- US Hospital locations and beds
- Socio-demographic data from the US Census
- Poverty and vulnerability data from federal and state agencies
- Chronic disease and health promotion data & indicators
- Life expectancy estimates
- Food access data
- Schools, parks, transit, and other essential services point-of-interest data
UrbanFootprint will be tracking and updating data related to COVID-19 as the situation on the ground evolves across the U.S. We will continue to publish analysis and insights on COVID-19 impacts and will be here to support our users and the community in deploying effective response and recovery efforts for the people – our family, friends, and neighbors – who need it most.
Talk with our team to learn more. Schedule a call with us and we’ll walk you through how to run this analysis for your community or project.
