


Data has been updated to reflect jobless claims and COVID cases as of April 11, 2020.
While cities and states across the nation wage a feverish battle to ‘flatten the curve’ of COVID-19 cases, another frightening curve is rising at an unprecedented clip. The COVID-19 pandemic has triggered the largest unemployment spike in U.S. history. For the last four weeks, as shelter-in-place directives have extended from coast to coast – more than 316 million Americans are now home from school, work, and limited to essential trips.
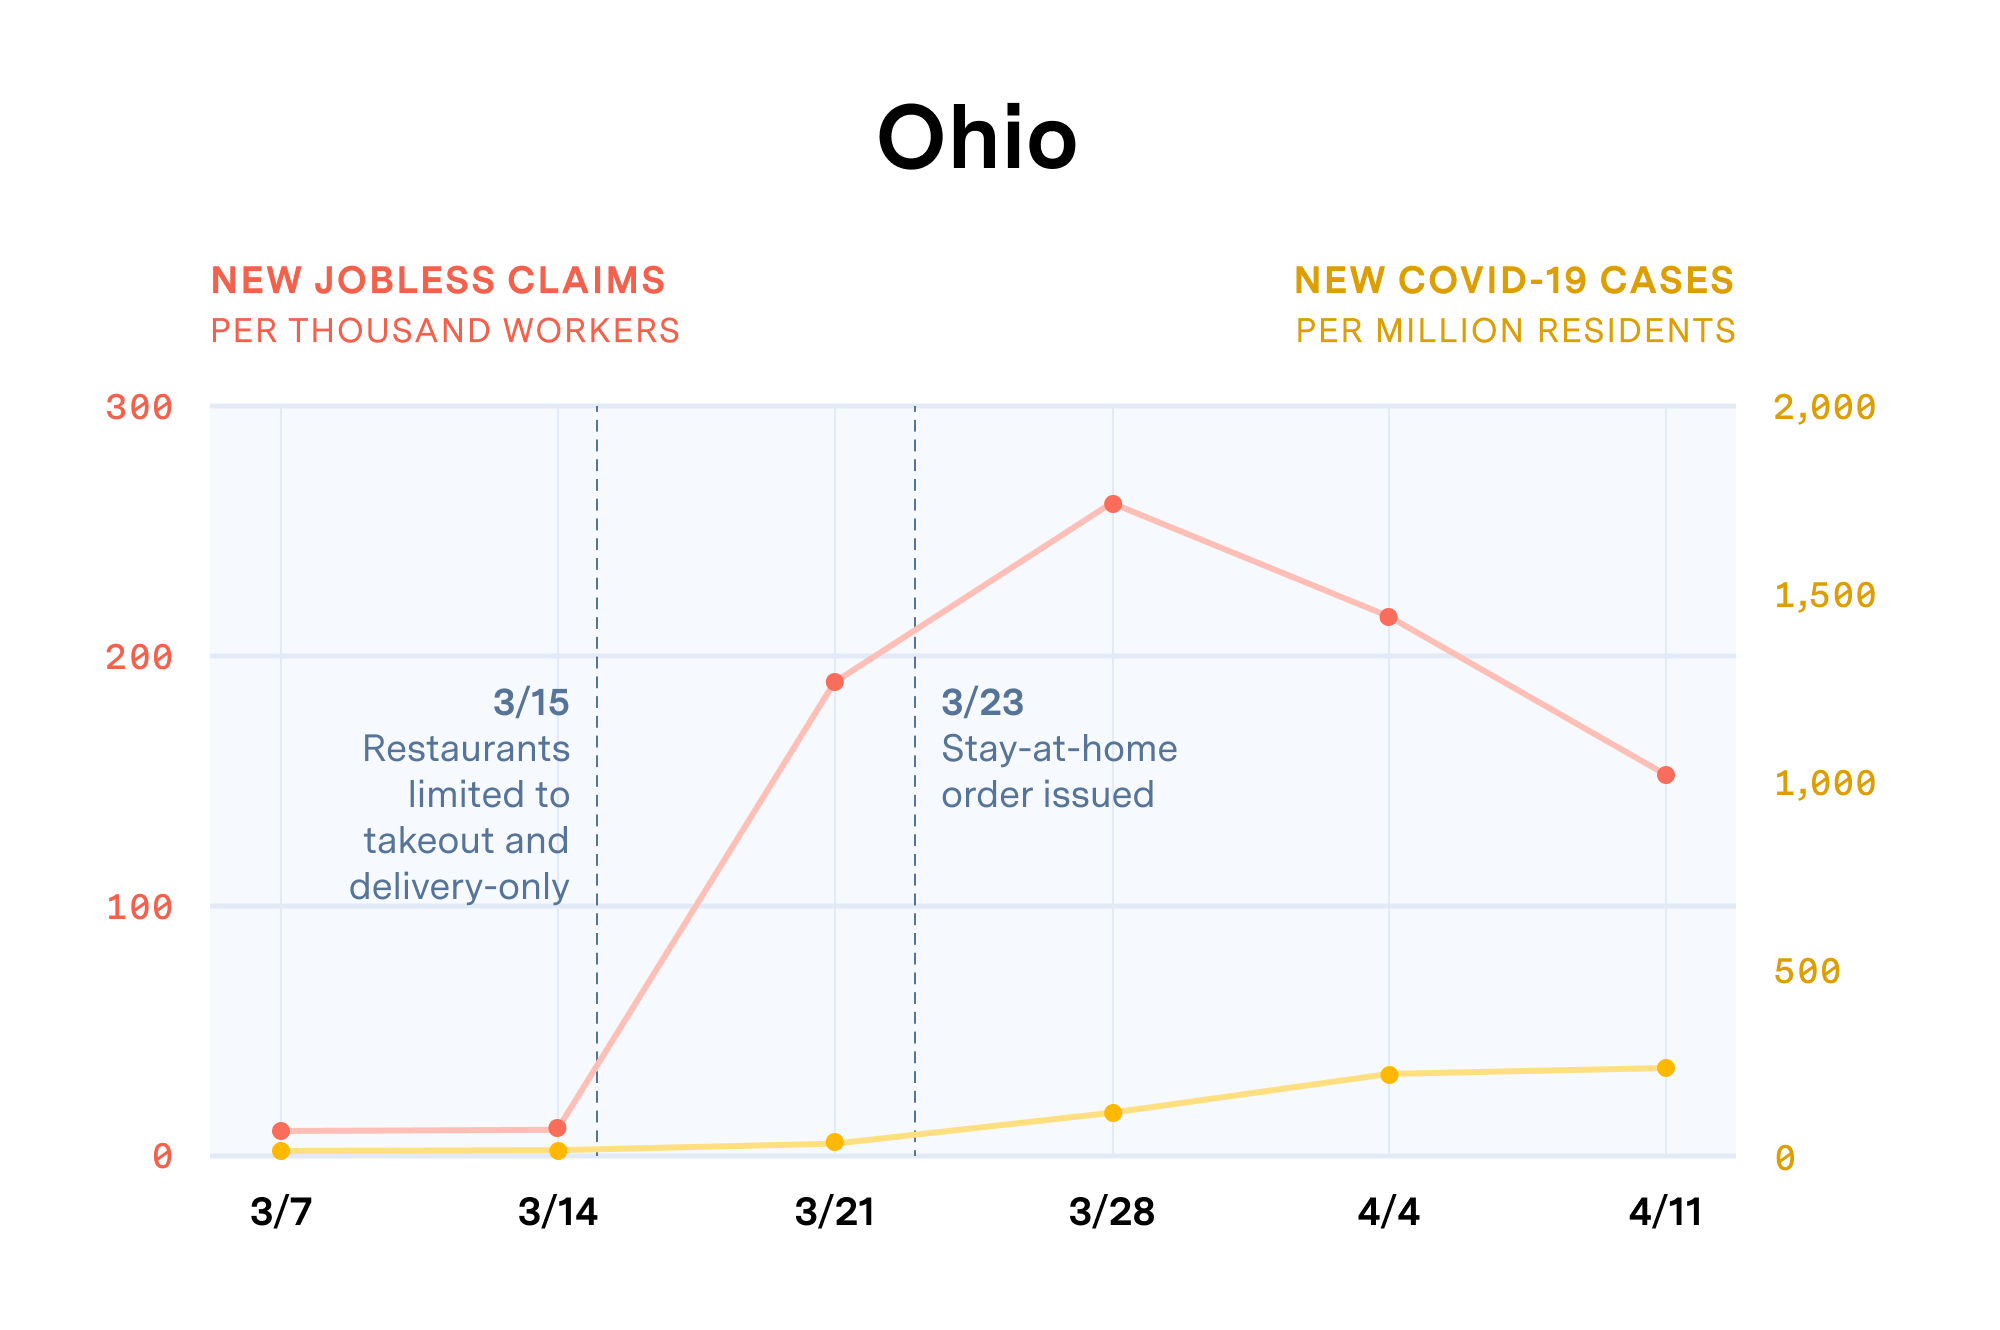
With retail stores shuttered, restaurants closing, and business trips and vacations canceled, the U.S. Labor Department reported the loss of a staggering 22 million jobs from March 21st to April 11th, pushing the estimated unemployment rate above 17%, higher than at any point since the Great Depression. As one sector winds down, it ripples into others as newly unemployed Americans look to cut their expenses, thus impacting the next sector down the chain of consumer and business spending. And so the curve of economic and social distress rises.
As public agencies work with front-line health organizations to deliver emergency medical response to COVID-19, we must act with equal urgency to direct social and economic resources to those most in need, and to communities where impact will be most concentrated. Federal relief and stimulus efforts may help ease the pain, but with an extended and steep rise in unemployment likely to continue, it will be critical to expedite support to people and communities most at risk of losing the foundations of their livelihood.
Where do agencies need to deliver relief now and in the coming weeks and months?
To understand where agencies need to deploy critical social and economic resources, it’s important to focus on the job sectors most deeply impacted, as well as where workers in these sectors are concentrated – where they live, how they travel to jobs and services, and their underlying vulnerability to income disruption.
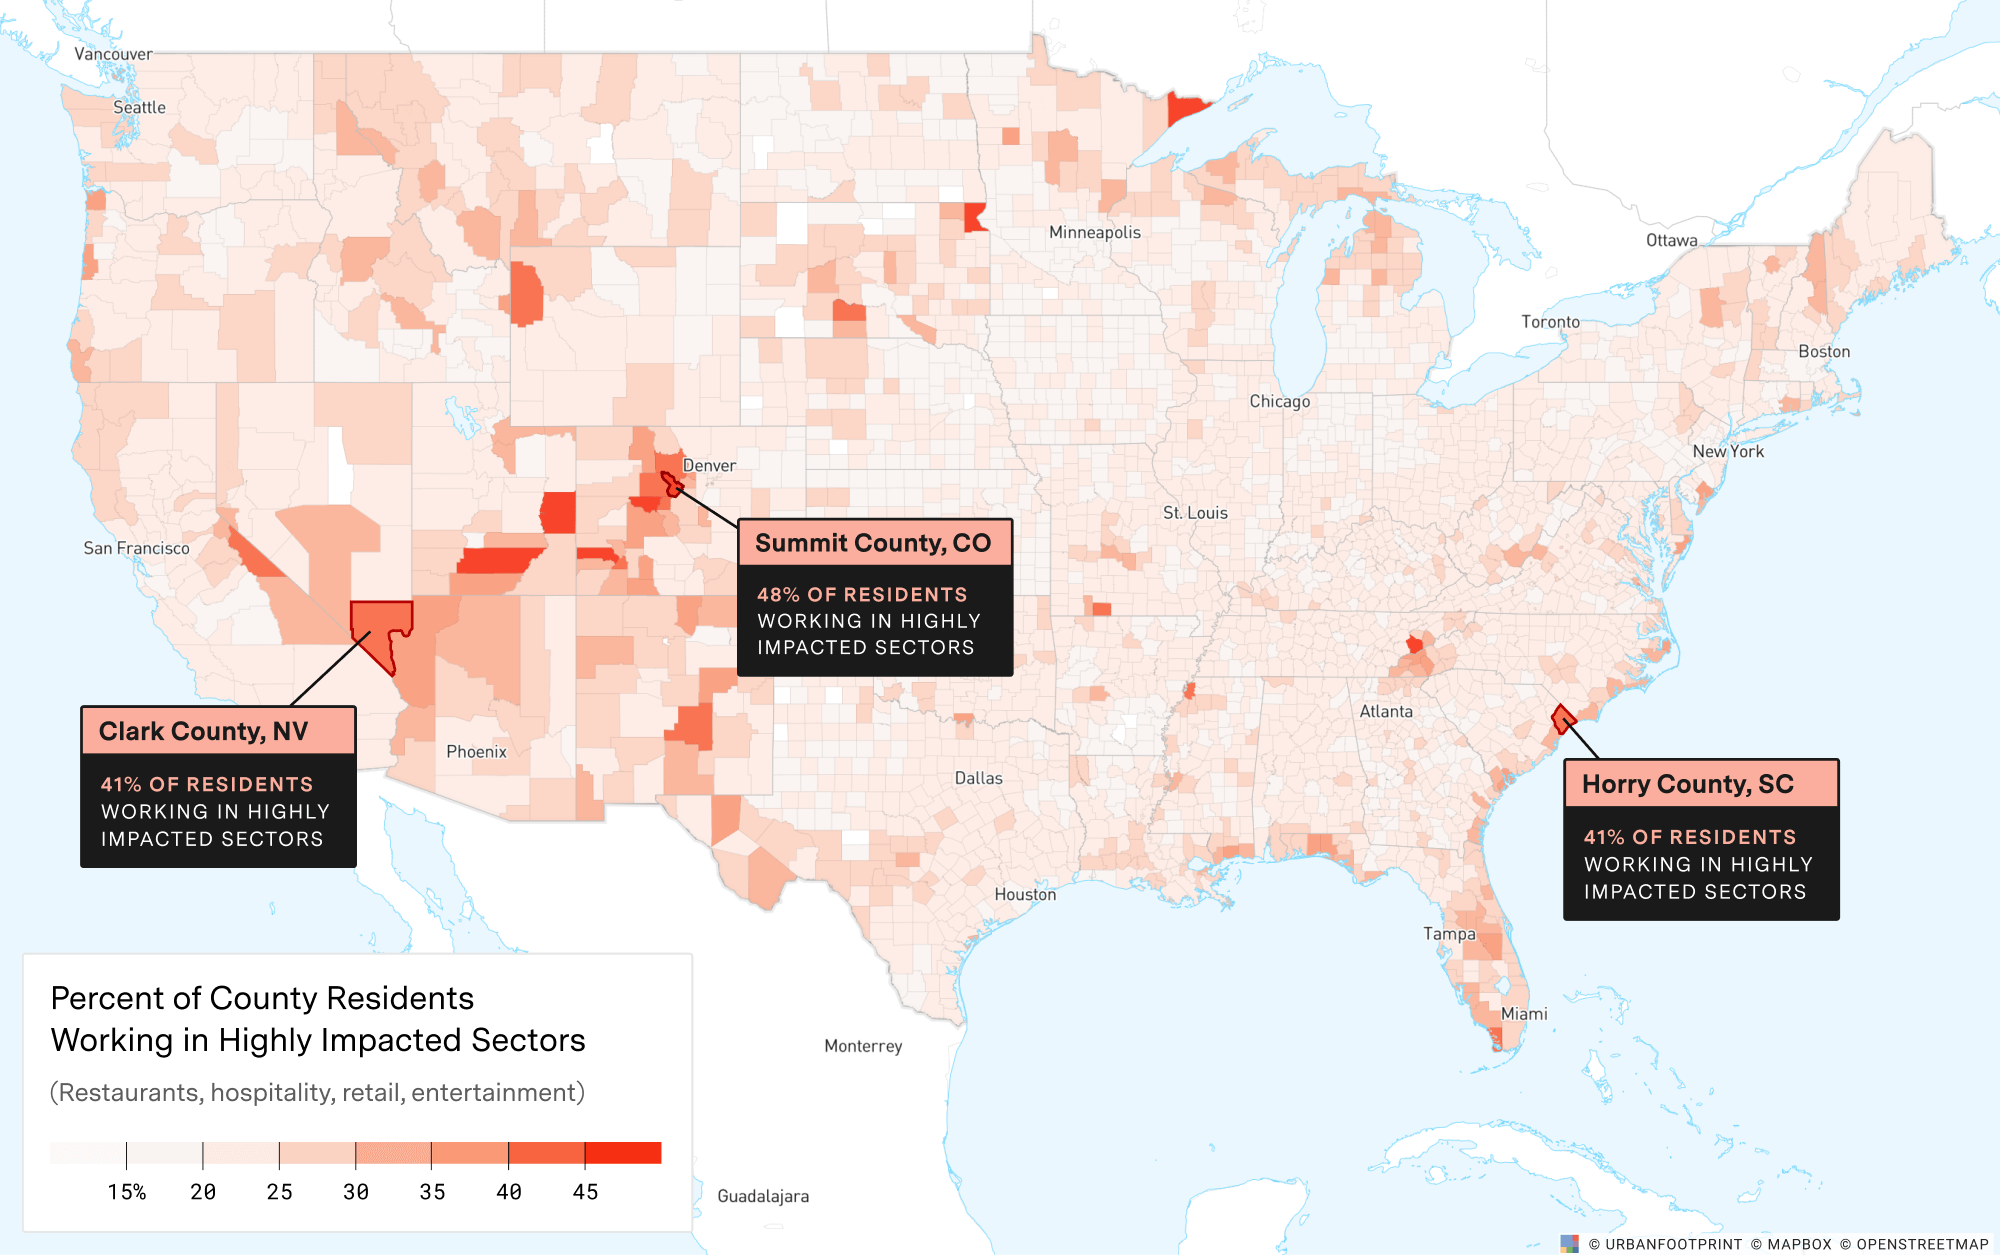
For low-wage retail, service, and hospitality workers already living paycheck to paycheck prior to COVID-19, the impact of this crisis will be painful. Jobless claims data by sector is not yet available, but there are several indications that the crisis will hit some sectors much harder than others – restaurants, hospitality, retail, and entertainment have already seen a quick downturn in economic activity and spikes in layoffs. These sectors account for 22.5% of all employment in the U.S., and in some regions like Las Vegas and New Orleans, the proportion is much higher and thus the impact likely to be much greater.
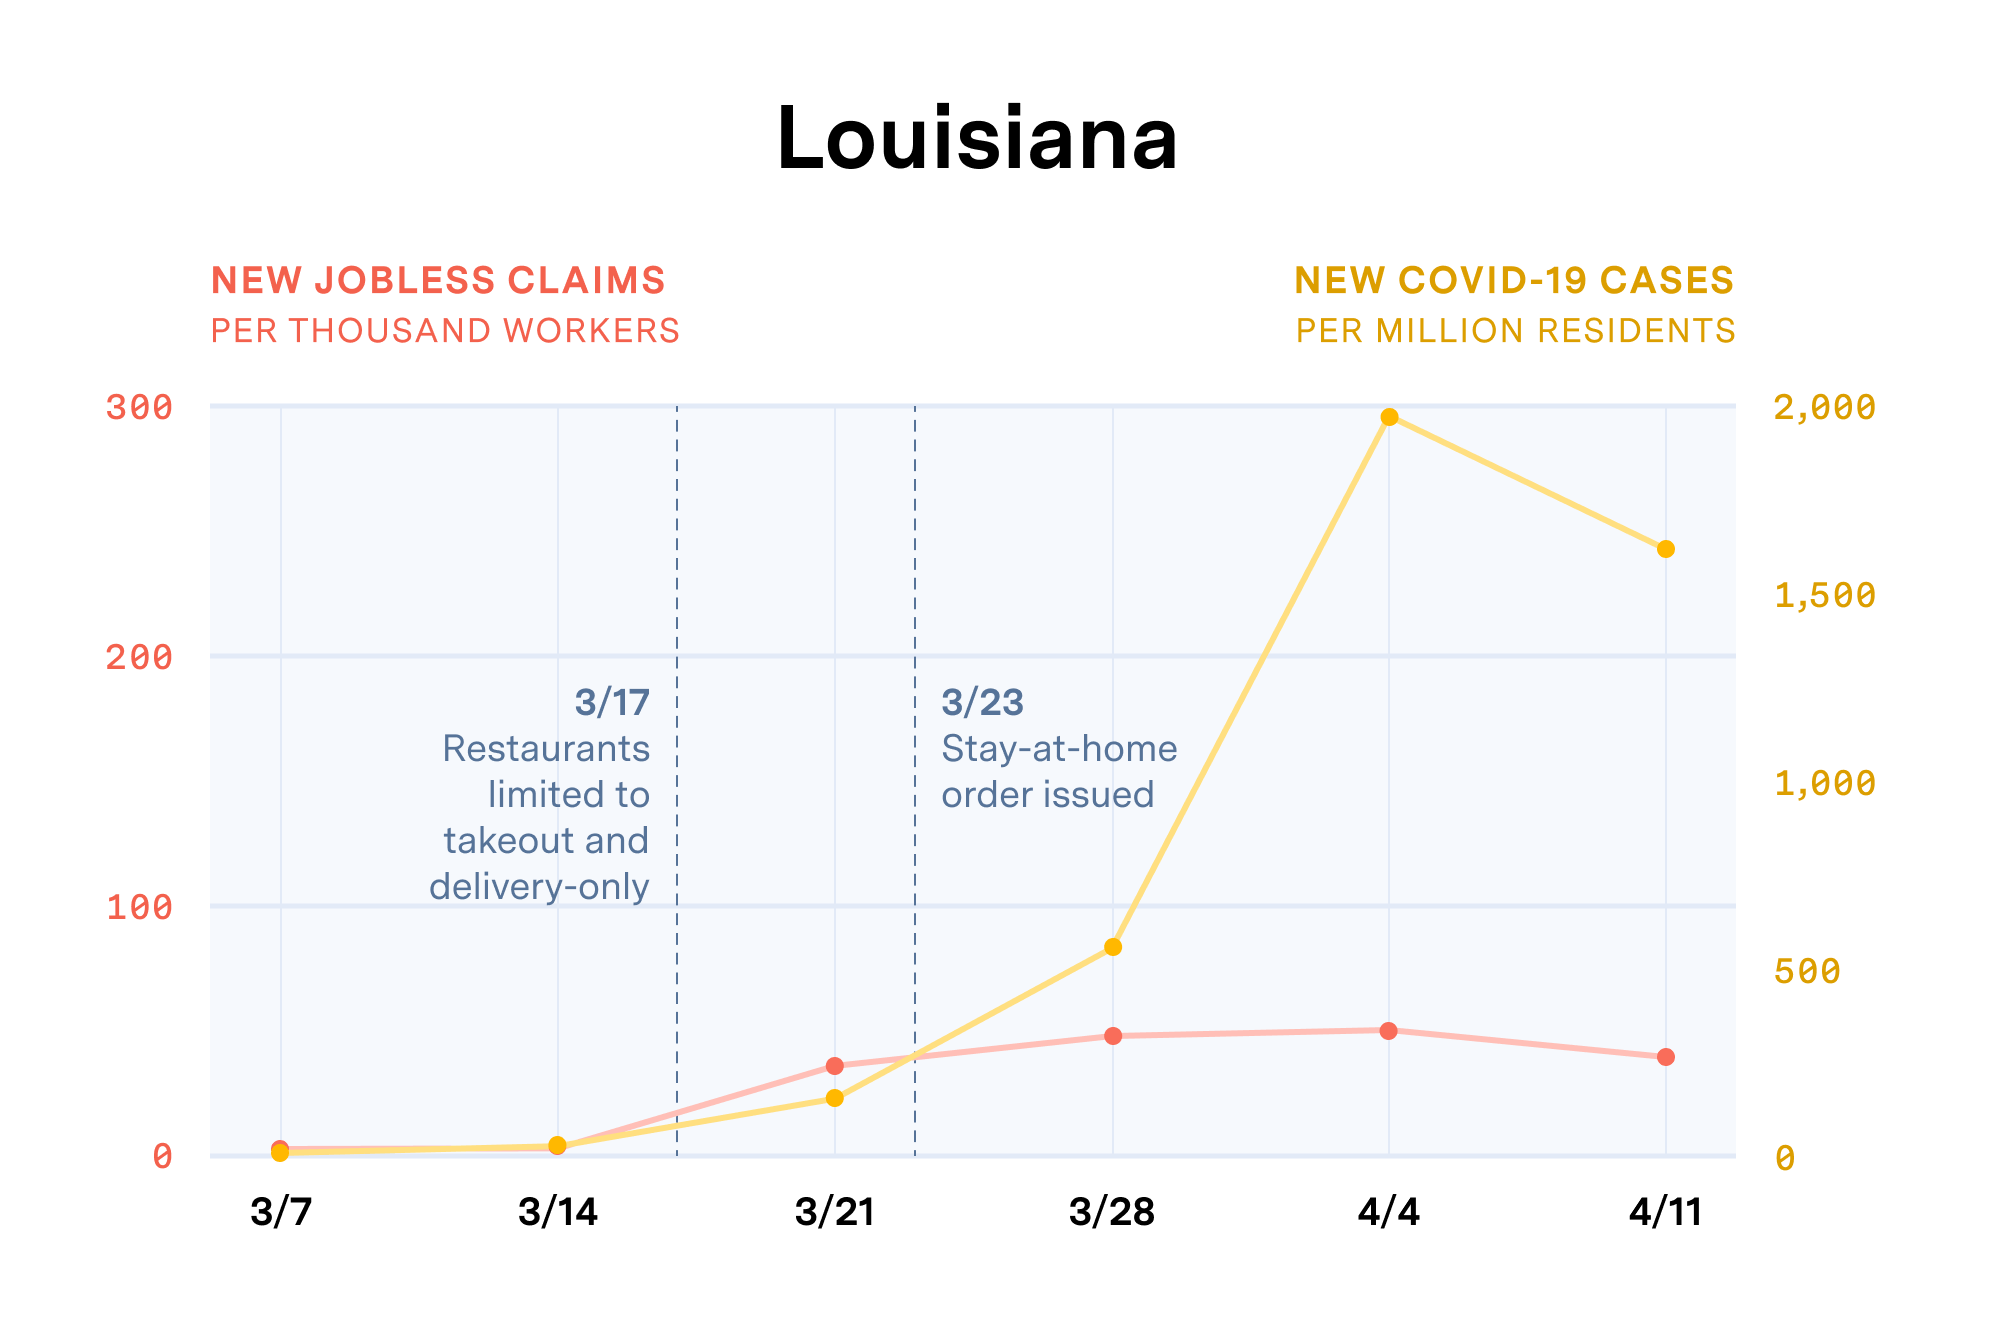
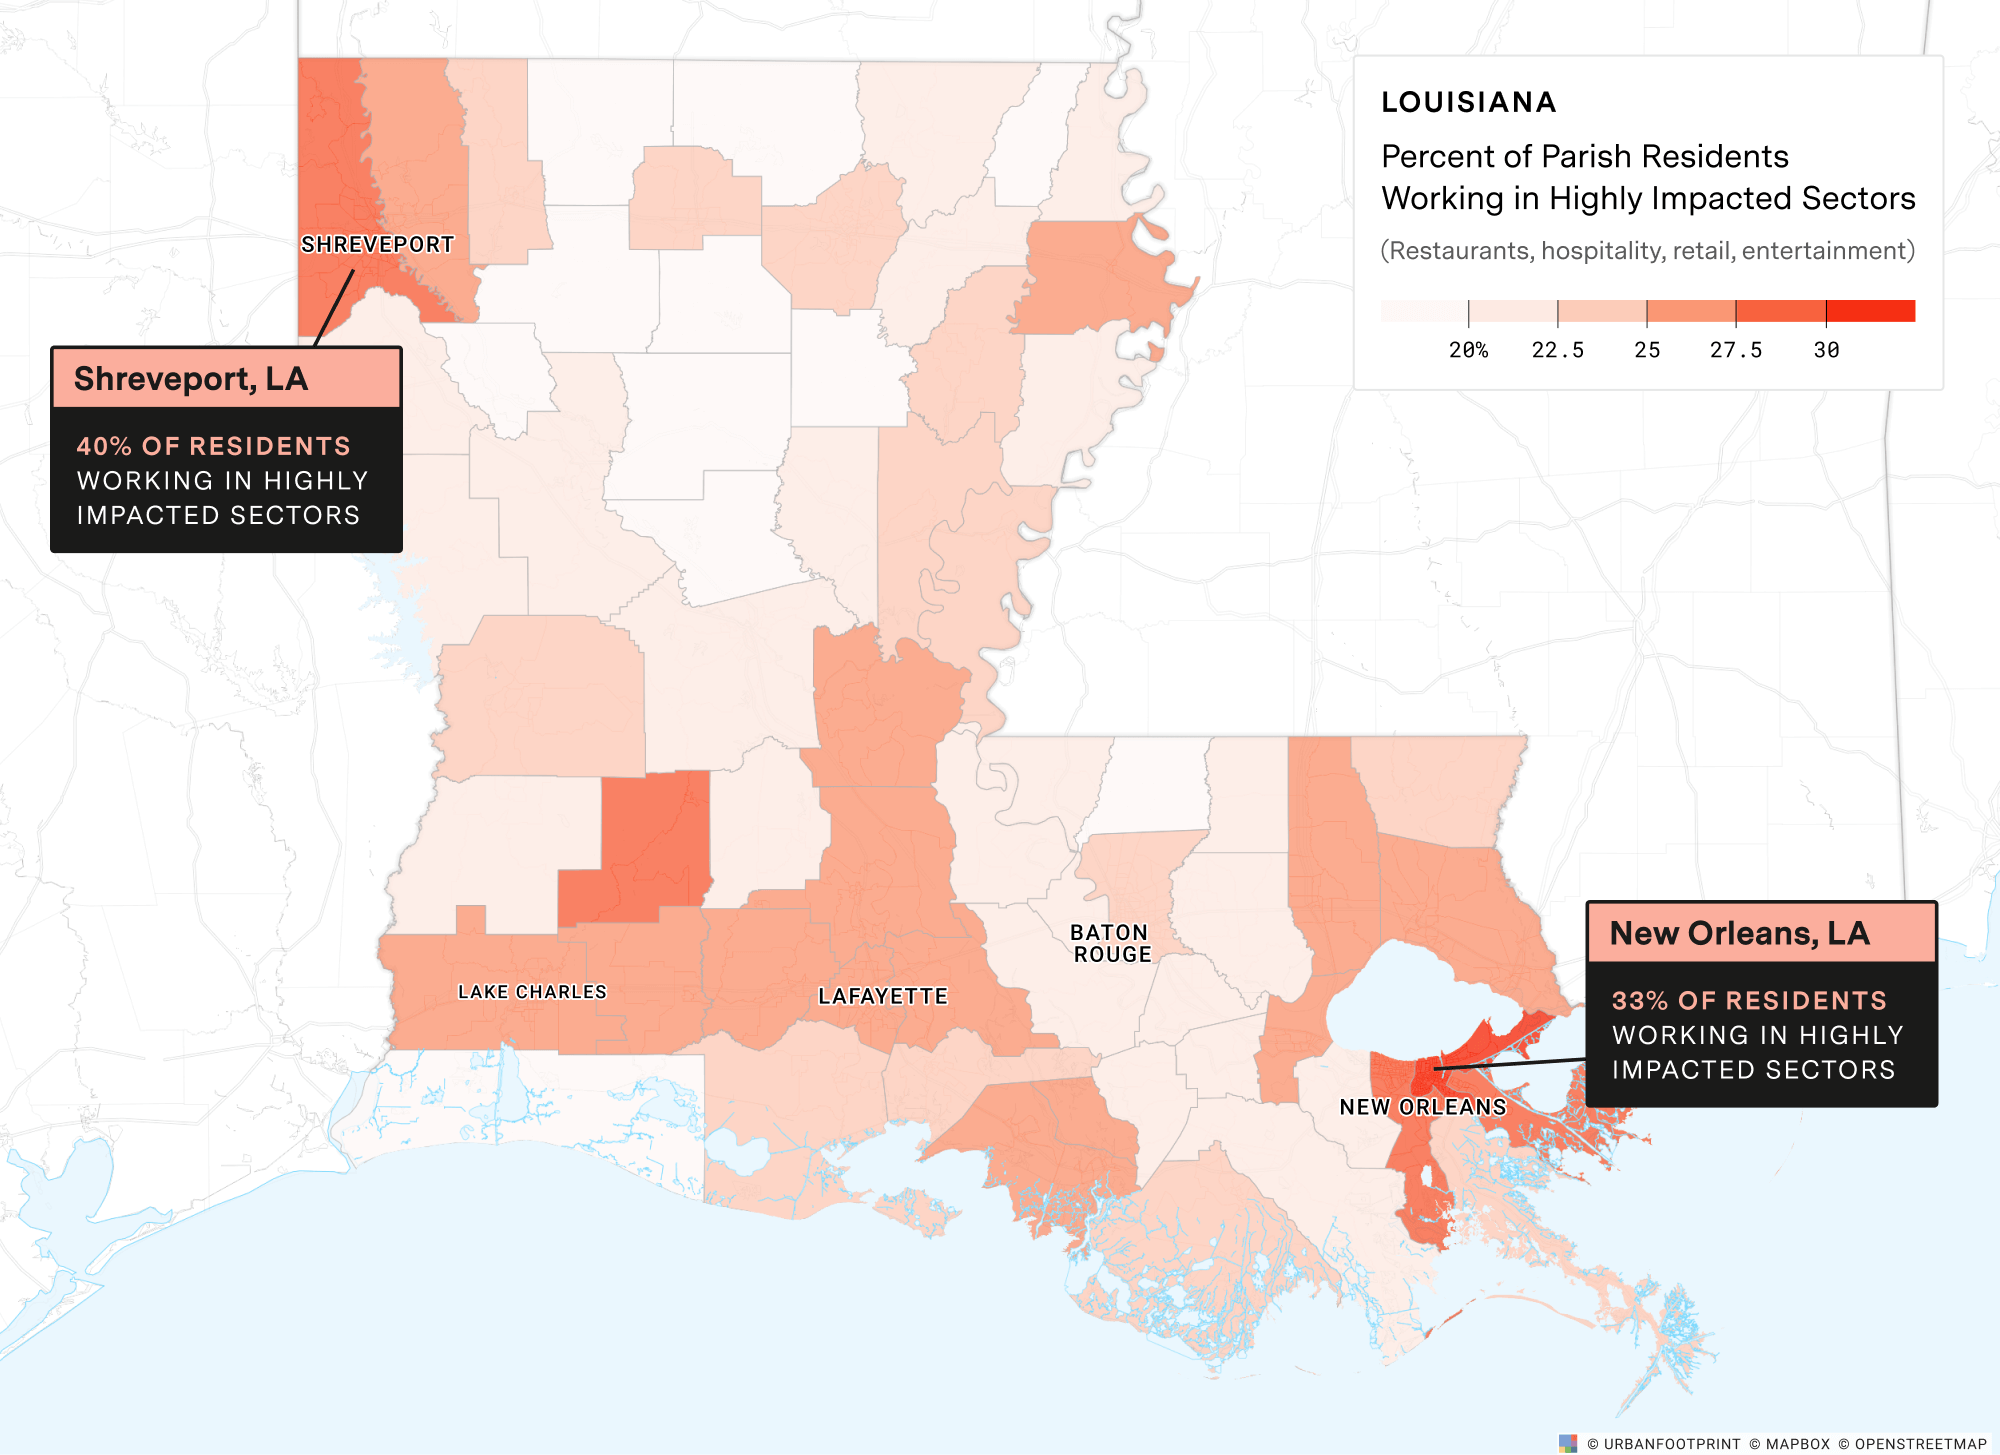
Given the high concentration of employment sectors most immediately impacted by the economic fallout of COVID-19 in Louisiana, we’ve focused our example analysis here on how mapping this data may help public agencies deliver critical economic aid and essential services where it’s needed most.
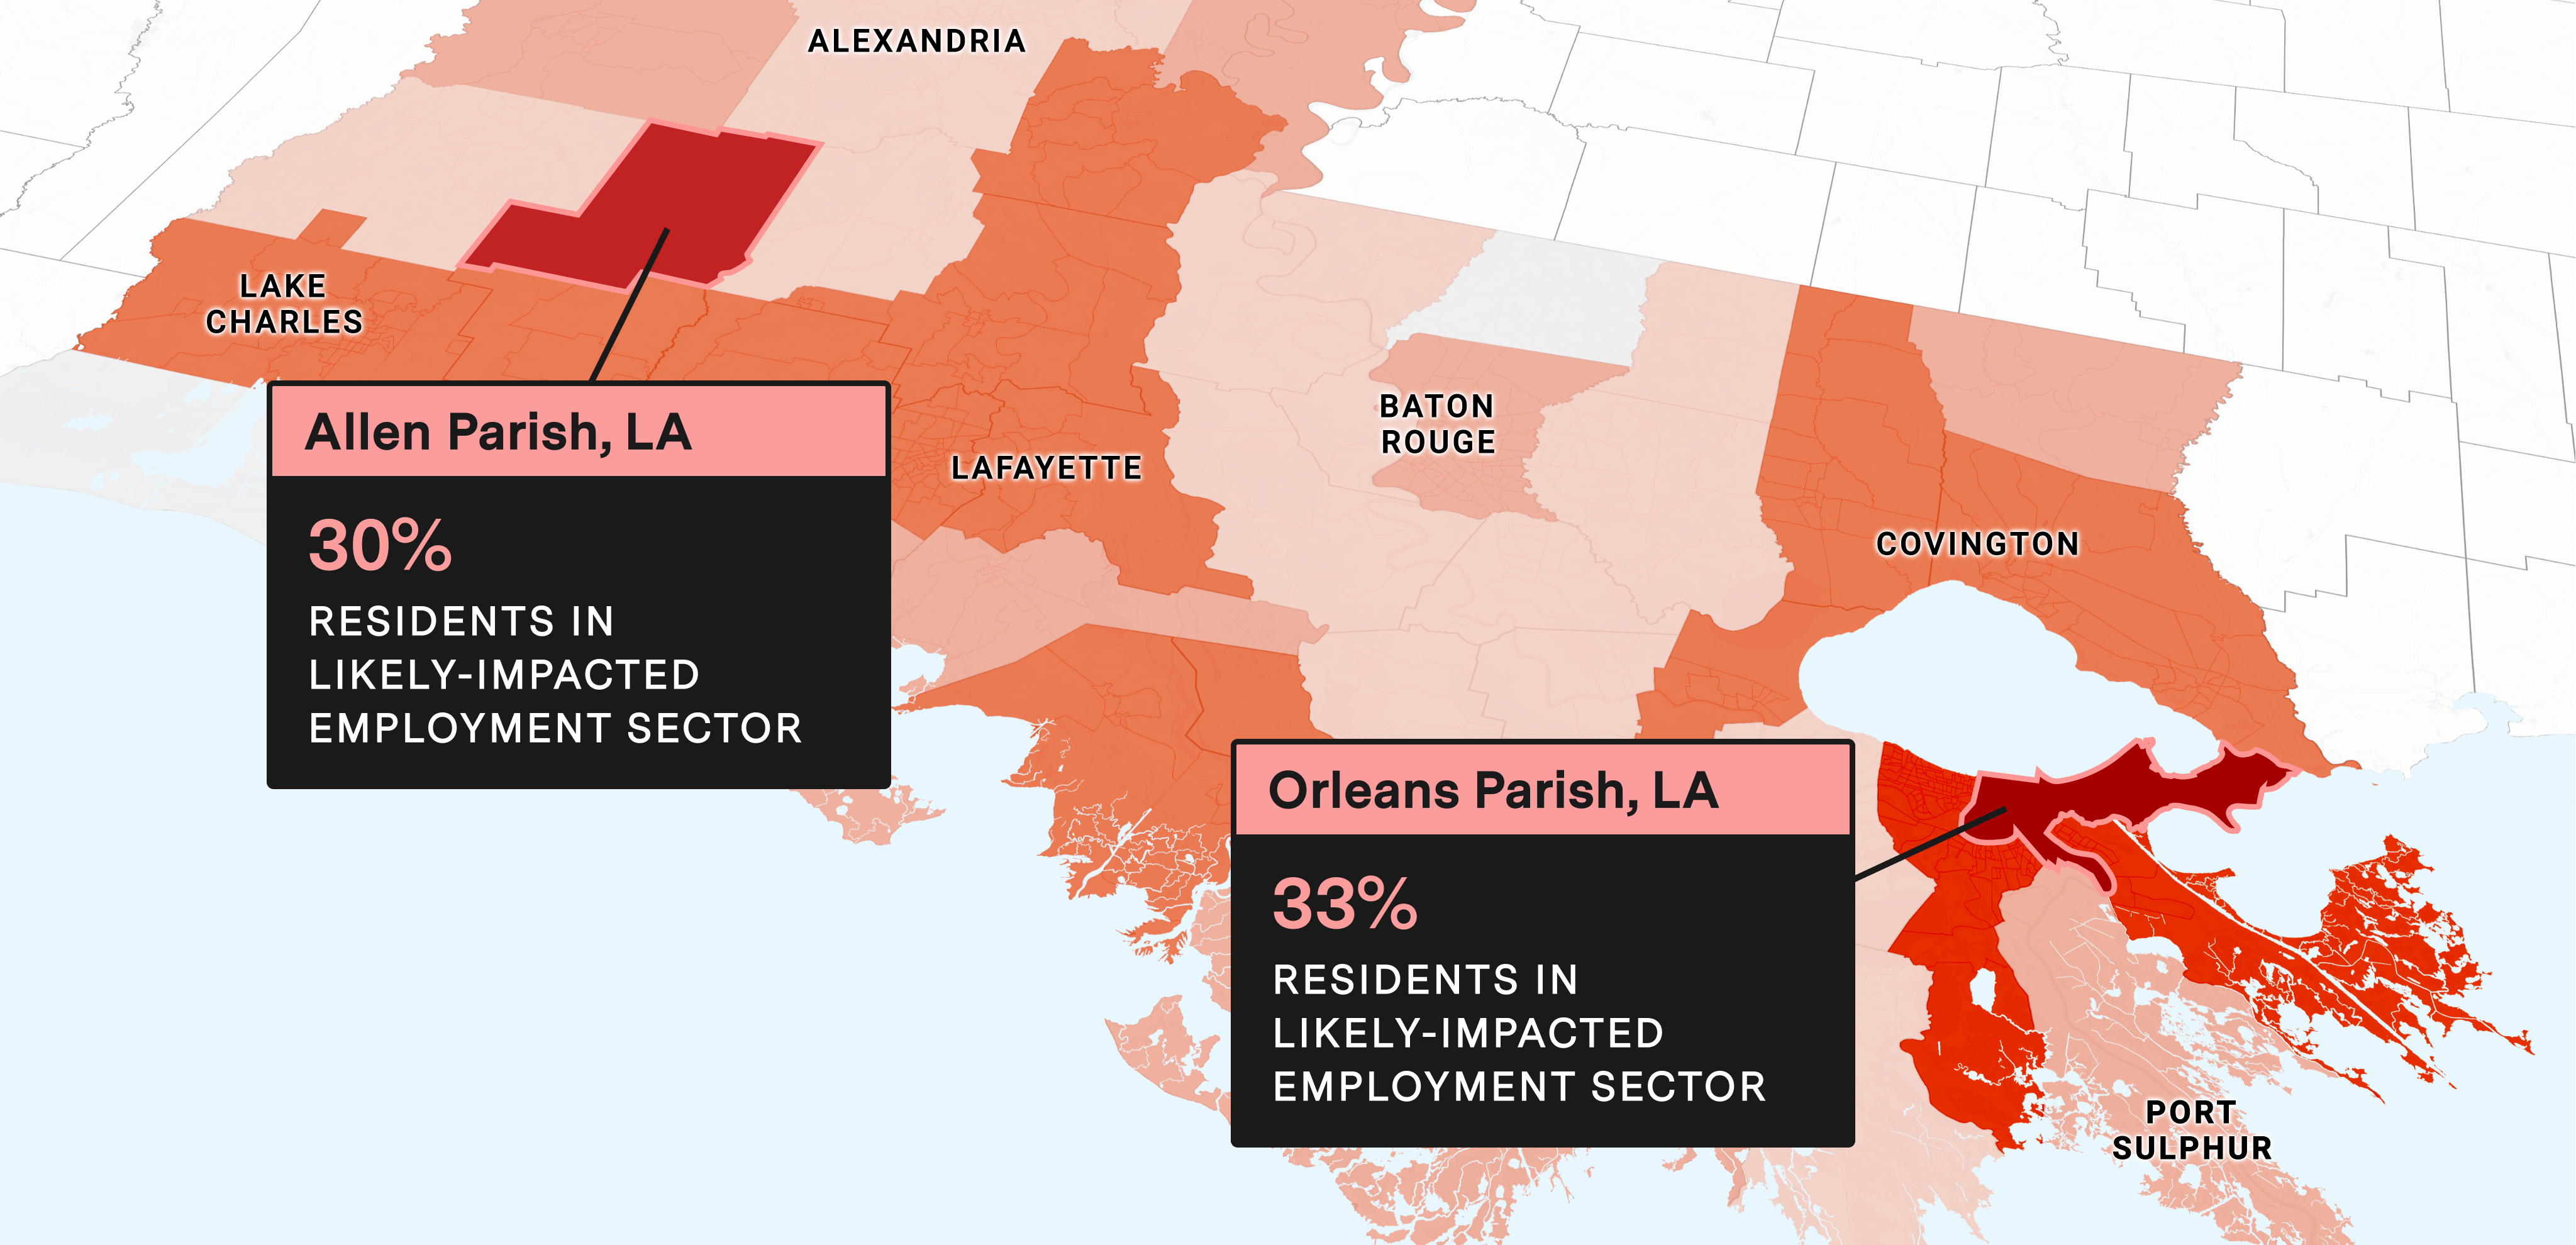
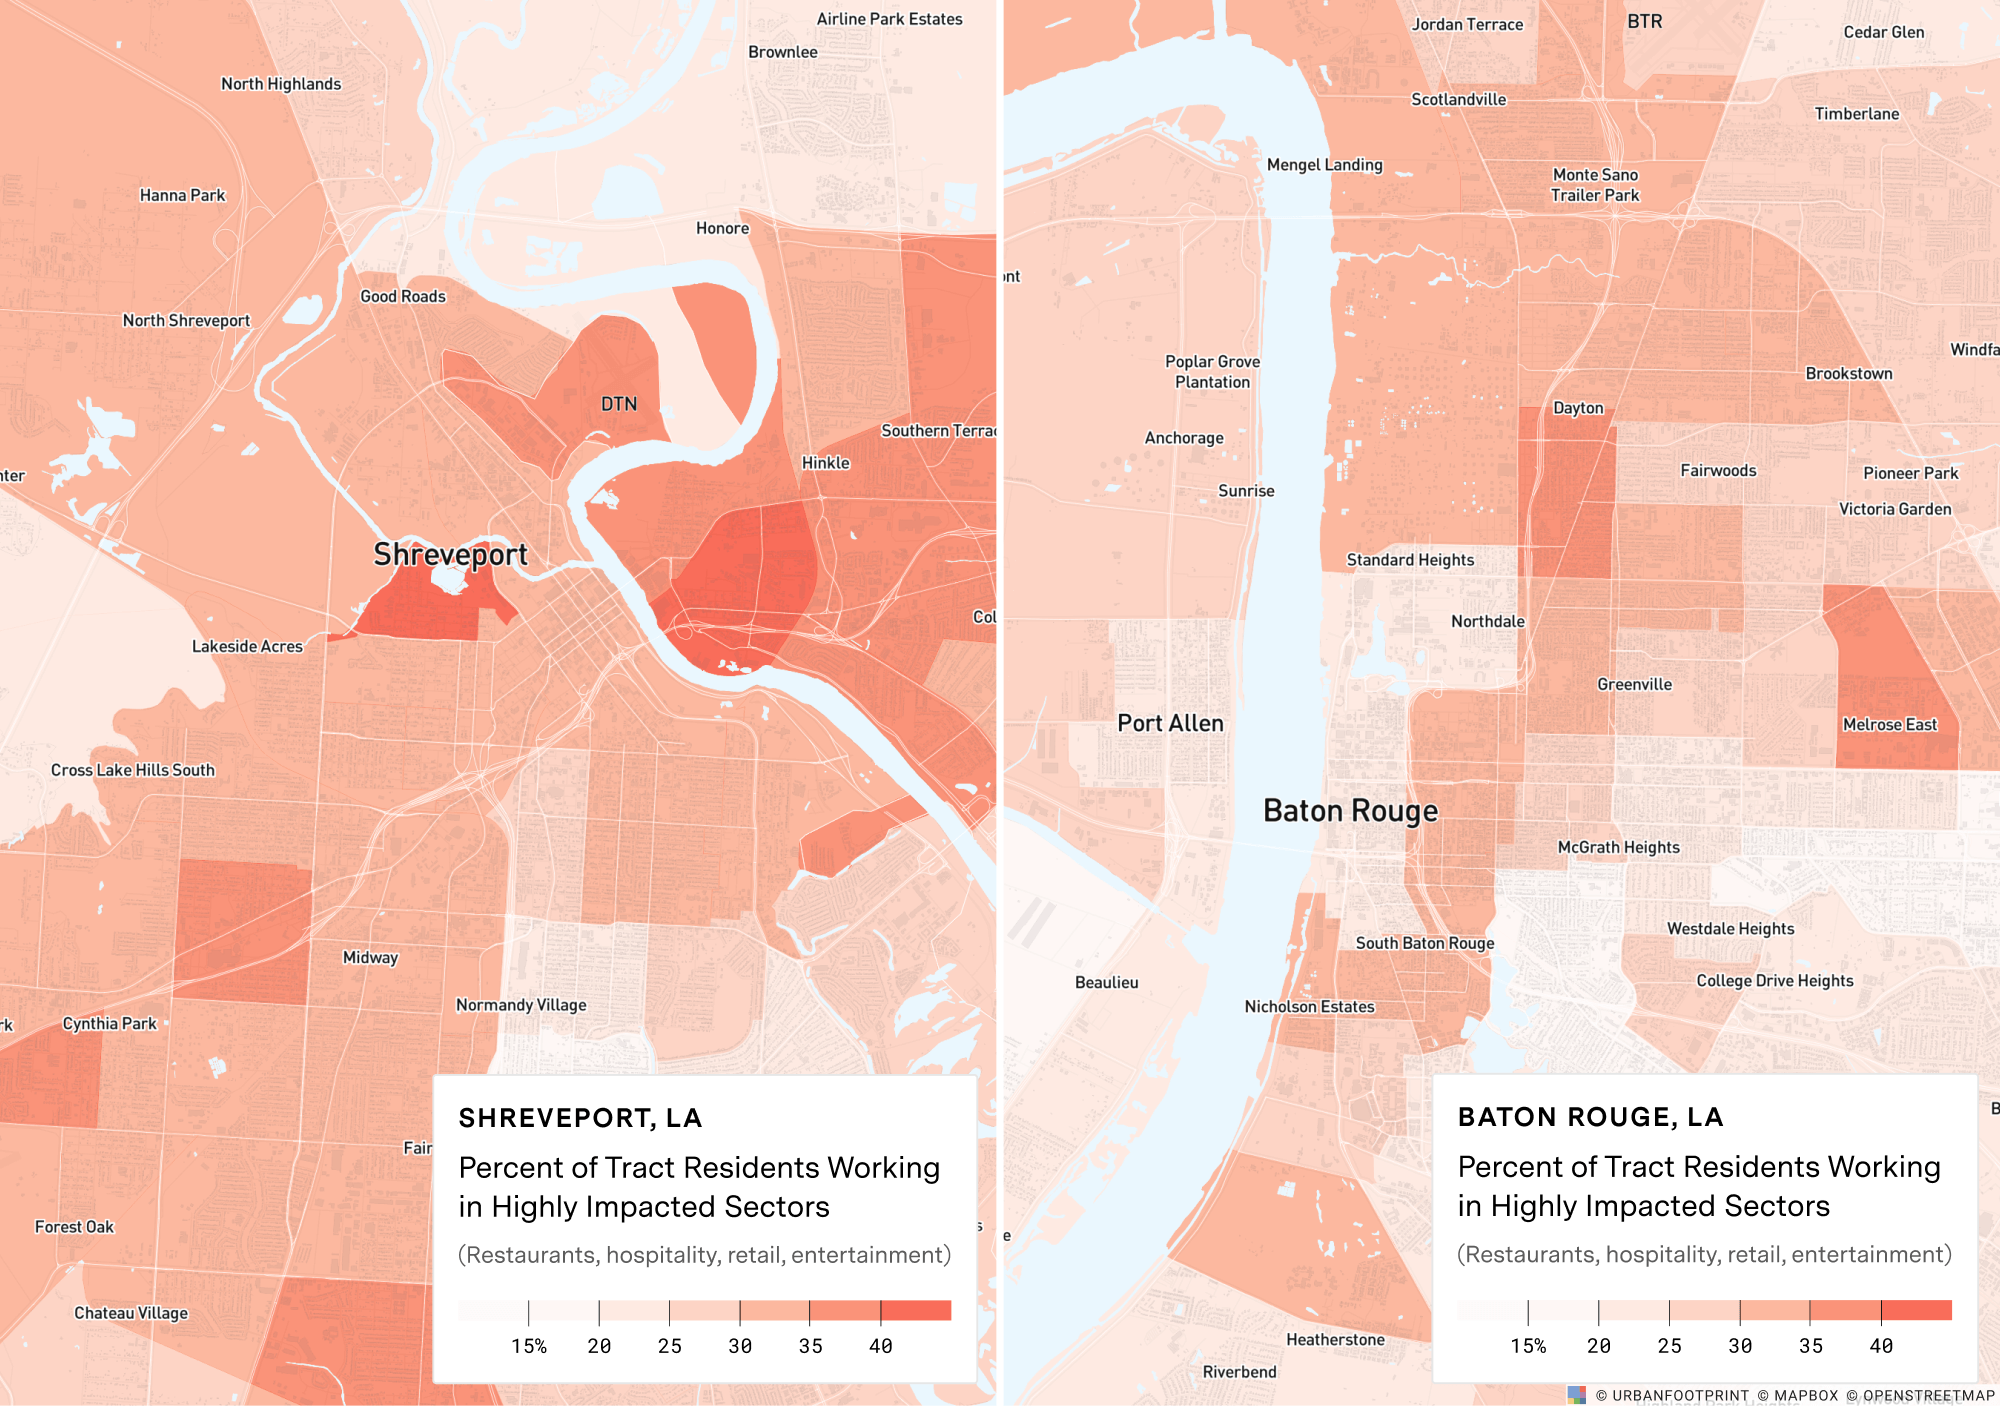
In Louisiana, restaurants, hospitality, retail, and entertainment account for 25% of all employment. In New Orleans, it’s even higher at 33%. And across the state, near the Texas border, in Shreveport, employment in these sectors account for upwards of 40% of the total.
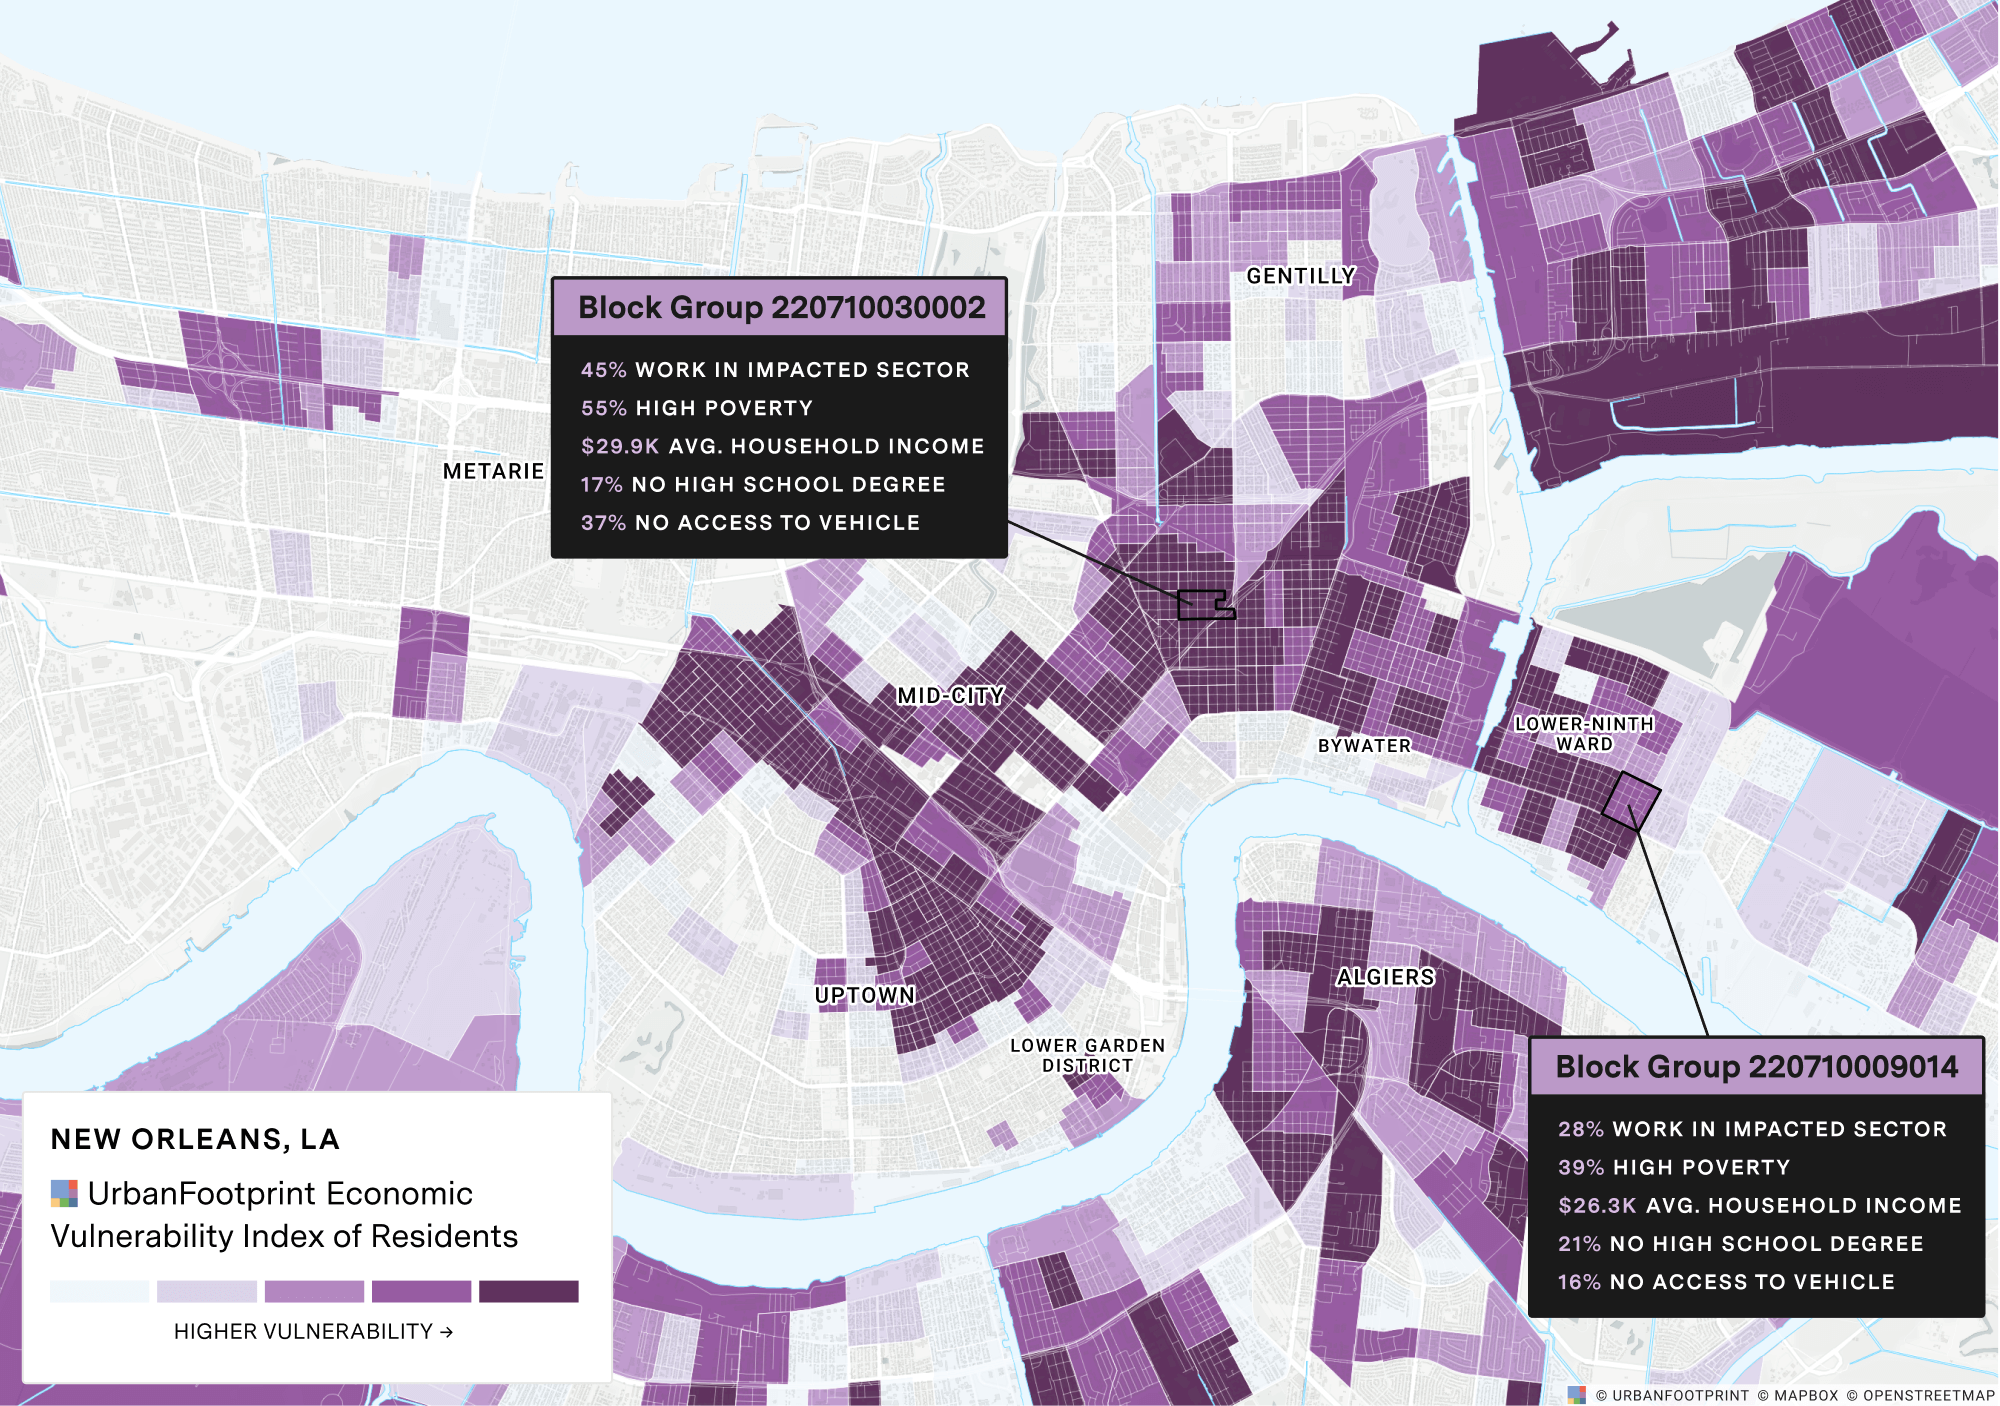
Digging even deeper into the data, within cities like New Orleans, neighborhoods adjacent to the tourism-rich French Quarter and Jackson Square neighborhoods are almost wholly reliant on these economic sectors – nearly 50% of residents hold restaurants, hospitality, retail, and entertainment jobs.
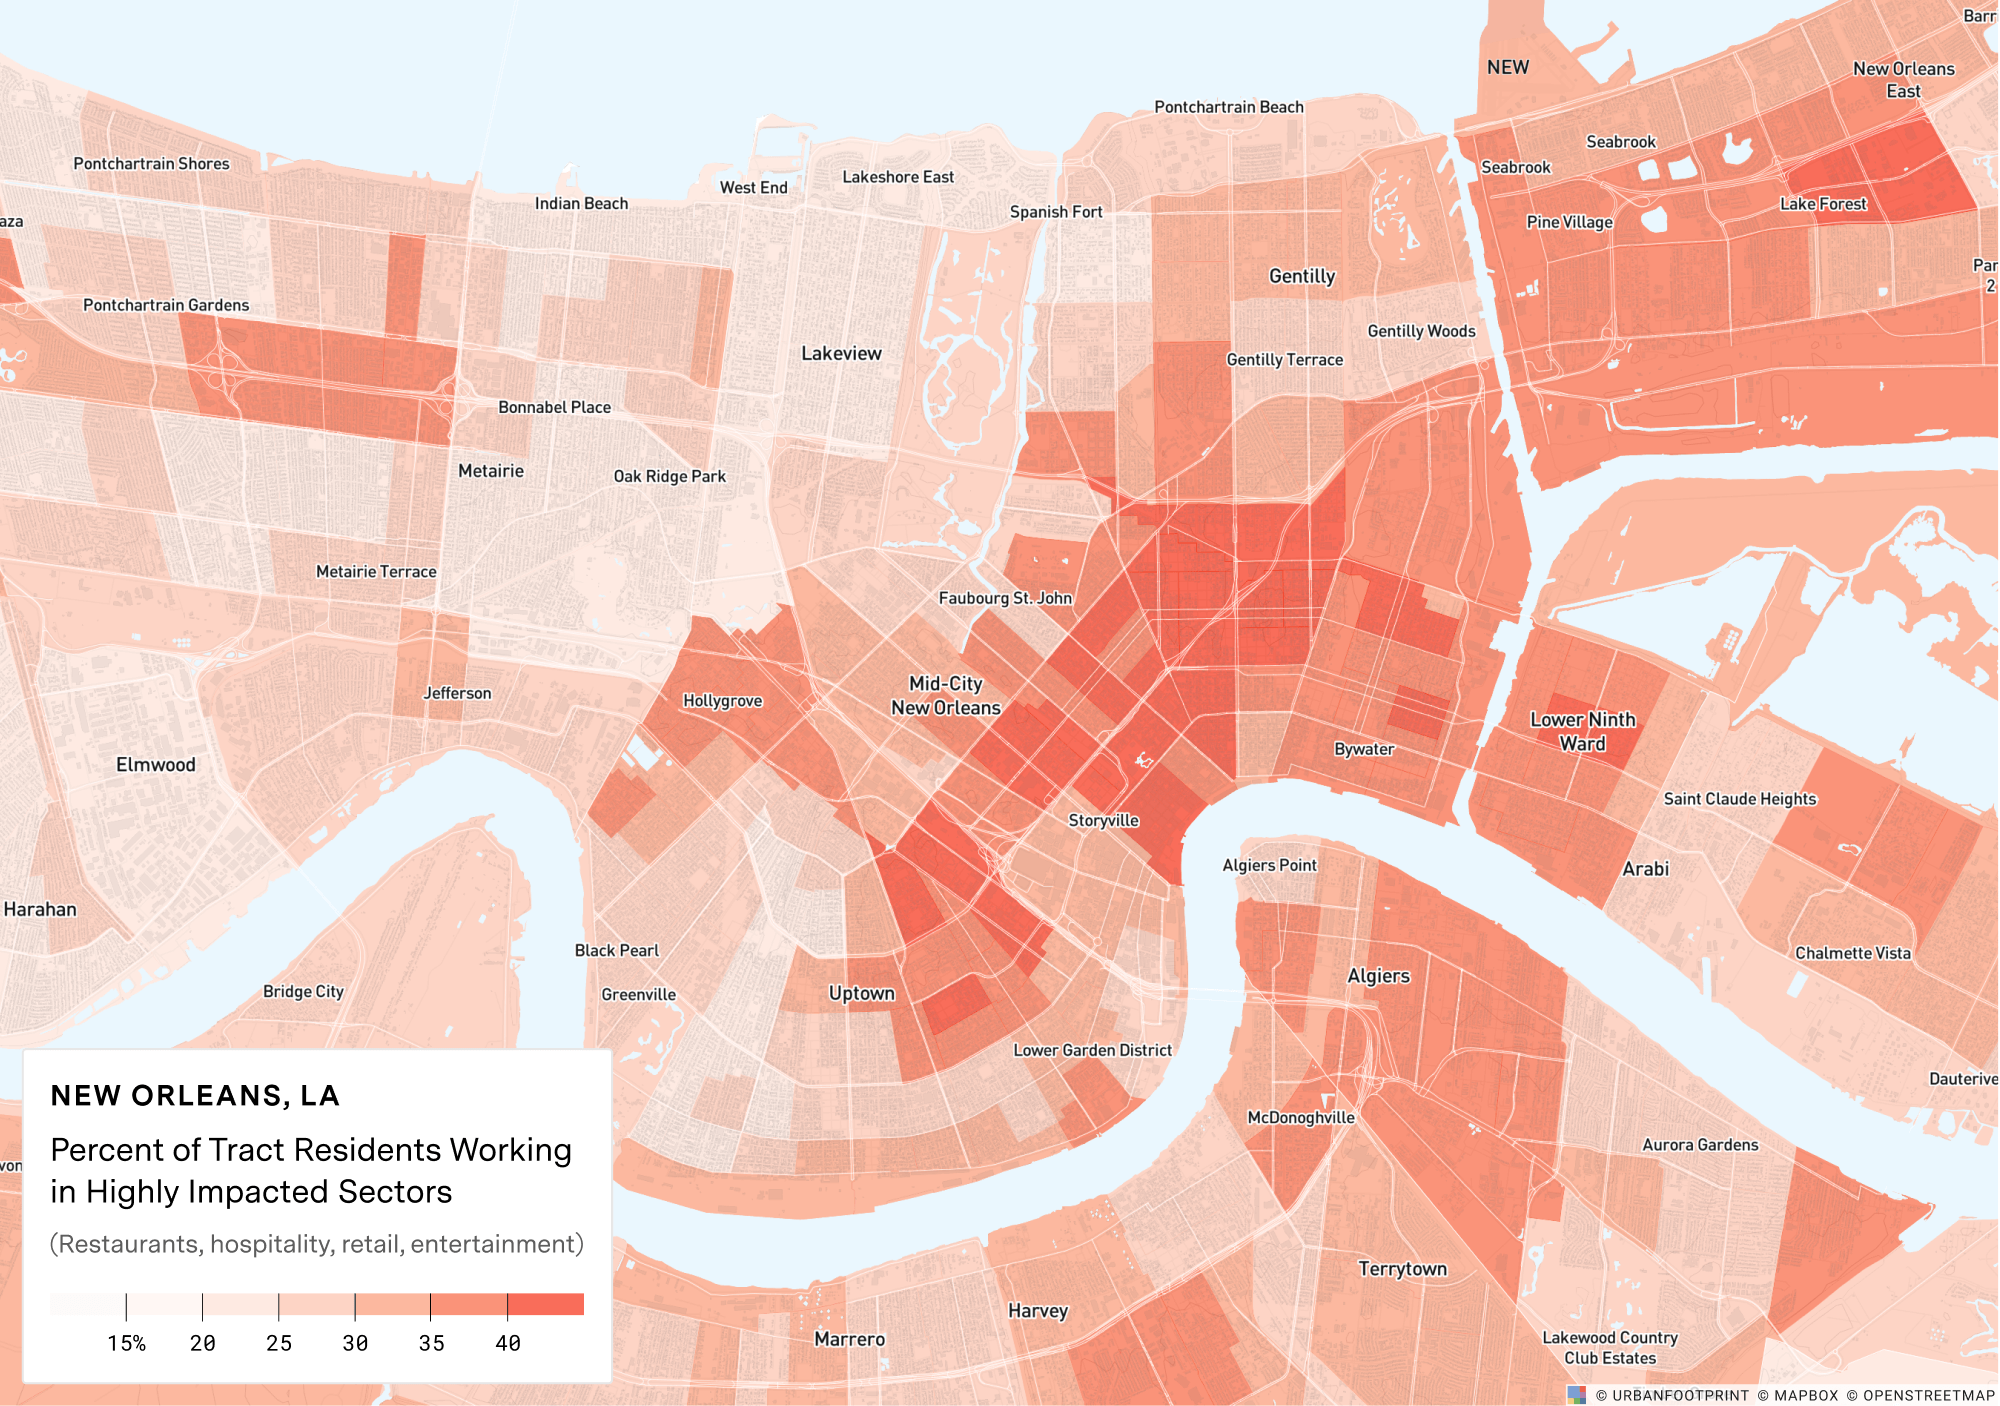
Baton Rouge has similarly high contractions in specific neighborhoods, as does Shreveport to the west.
In combination with many more factors that we’ll begin to discuss below, mapping employment sector by neighborhood can start to provide important clues on where immediate economic aid and services may be needed most.
Using a Vulnerability Index to map and plan for the direct distribution of social and economic relief.
These numbers and maps tell an important story and can serve to direct the distribution of social and economic relief. But we need to dig a few layers deeper into the data to understand where residents are most vulnerable, and thus where relief is most urgent. We can further evaluate impacted areas based on levels of income, education, underlying medical conditions, and even access to food and critical services to understand where the need is most urgent and how we can deliver effective support. Such a ‘Vulnerability Index’ can serve to quickly highlight areas with the greatest need.
Mapping neighborhoods with less foundational resilience to economic disruption and understanding where the rise out of steep unemployment will likely be the most difficult can serve as an important starting point in understanding where additional economic, social, mental, and even medical support may be especially needed now and for the weeks and months to come.
In a continuing effort to support public agencies in response to COVID-19, we plan to share additional insights on how access to essential services like grocery stores will be impacted by the expected changes and reductions in public transit in the days and weeks ahead.
Have a question? Let us know. We’d love to hear from you.
