


If you’re interested in creating a project like this, let us know!
Transit accessibility is essential to supporting thriving, sustainable, and equitable communities. While many planners and community stakeholders strive to achieve widespread access to low-cost, high quality transit, they often face a tall list of hurdles from conception to implementation. One of the most daunting challenges often comes in the form of data. How can organizations quickly and accurately assess current land use conditions and potential future impacts to identify opportunity sites that consider each site within the context of a region’s overall transit accessibility?
As cities around the world attract renewed interest in urban investment, those involved in contemporary urban development – from urban planners, to large institutions, and private developers – must consider and navigate a complex array of disparate data sources to arrive at the answer.
The UrbanFootprint Transit Accessibility analysis module helps planners and community stakeholders approach this critical challenge by making it easy to sort through large amounts of urban data in novel, relevant ways. In this blog we’ll walk through how it works, featuring the City of St. Louis as our example site.
Evaluating Transit Accessibility in St. Louis
Separate from St. Louis County, the City of St. Louis has been grappling with an extended period of urban contraction. In 1904, when St. Louis hosted both the World’s Fair and the first Olympics held in the United States (and only the third in modern history), it boasted the fourth largest population in the country. By midcentury, the city surged past 850,000 residents.
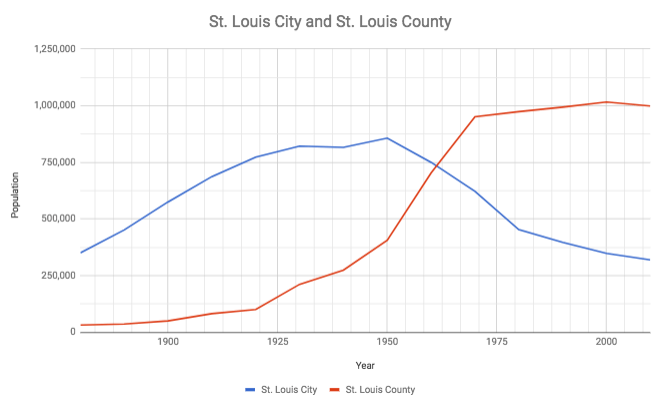
Today, after decades of sustained urban population decline, lost to the County suburbs and beyond, the City of St. Louis sits at a population of roughly 320,000, ranking 58th on the list of largest U.S. cities.
Recent years, though, have seen reinvestment in the urban core of St. Louis. A vast supply of affordable housing stock, much of which boasts intricate, early 20th century brickwork along tree-lined neighborhood streets, has led to an increase of new residents in some neighborhoods. These include those along the South Grand Avenue corridor and around urban green spaces, such as Tower Grove and Lafayette Park.
Navigating Vast and Complex Data to Distill Meaningful Insights
For urban development investments in St. Louis, navigating the available housing and parcel stock can be a daunting effort. This is true for developers working to identify a single investment parcel or a city agency or institution engaged in the management and improvement of parcels at a neighborhood or city-wide scale. The St. Louis Land Reutilization Authority (LRA), the oldest land bank in the country, owns more than 11,000 vacant or abandoned parcels alone.
One method of prioritizing this available housing stock is to target land parcels with the greatest access to jobs. As seen in the employment map of St. Louis, taken from the built-in base parcel canvas in UrbanFootprint, jobs are largely concentrated along the central spine of the city, where the major east-west Interstate 64/40 corridor makes its way from the County, through the neighborhoods south of Forest Park, to the Central West End and through Midtown to the Downtown core.
Currently, most of St. Louis’ vacant parcels tend to lie away from areas of employment. Thus, identifying areas with high levels of accessibility to as many jobs as possible becomes an effective method of sorting through over 17,000 parcels to curate a list of candidates with strong development potential.
An oft-cited driver of successful emerging urban areas is accessibility. Using transit nodes is one heuristic of assessing an area with high accessibility. With UrbanFootprint, we can quickly bring up the entire public transit network for the greater St. Louis region, as well as all available bus stops.
As is visible in the above image, we can see how the vacant parcel stock tends to lie away from the corridors serviced by the MetroLink light rail system. However, identifying what constitutes a high quality bus line can be difficult to discern.
Utilizing UrbanFootprint Analysis Modules
Because UrbanFootprint holds the transit data for all operators in the United States that make their data publicly available, we can analyze the service quality at each transit node and evaluate walk network data for the greater St. Louis area. This will help to determine what parcels are near stops with higher quality transit service and are thus better suited for enabling nearby residents to have access to the greatest number of jobs in the region.
To analyze these parcels by job accessibility, we select the “Transit Accessibility Module” from the list of available “Active Modules” in our “Analyze” menu.
Upon completion, the Transit Accessibility module produces a robust set of outputs that allows a user to view the number of jobs accessible from each parcel within 15-minute intervals, amongst a host of other useful calculations, such as:
- Time to nearest park, restaurant, hospital, school
- Number of households reachable by transit within 15-minute intervals
- Acreage of park accessible by transit and walk within 15-minute intervals
Combining Output Layers
From these results, we can select the upper bounds of the accessibility results and subset the parcels to only those that have access to more than 115,000 jobs within 30 minutes. This represents approximately half of all jobs within the city limits.
By intersecting the two results – the parcels that have access to over 115,000 jobs within 30 minutes and our residential vacant parcels dataset – we can produce a subset of parcels with high transit accessibility to explore further.
Results from the Accessibility Module output help highlight smaller clusters of units that could be investigated further. Additional modules and data layers can assist in further refinement exercises.
For example, a city looking to understand how these units relate to historical redlining could select UrbanFootprint’s Home Owners’ Loan Corporation (HOLC) Redlining Areas layer from the Layer Manager library. This layer contains HOLC grade classifications the federal government set during the New Deal era which shaped urban and suburban development patterns through present day.
Easily Accessible Planning Data Opens the Door for Smarter Plans and Better Outcomes
As urbanists, we know sustainable communities thrive on an interwoven fabric of factors that impact social equity, environmental health, and economic resiliency. Our land use decisions are inextricably tied to the health and well-being of our communities. By making traditionally complex and overwhelming urban datasets more readily available and accessible, everyone, from planners to institutions, developers, and engaged citizens will be better equipped to analyze critical land use decisions from all angles.
Interested in learning more about our Accessibility Module? Book a demo with our team or sign up for a free trial.
Have questions or ideas for new planning analyses via UrbanFootprint? Email or tweet us. We’re happy to chat.
Note: UrbanFootprint map images are supported by © Mapbox and © OpenStreetMap.
Published June 19, 2018
