


If you’re interested in creating a project like this, let us know!
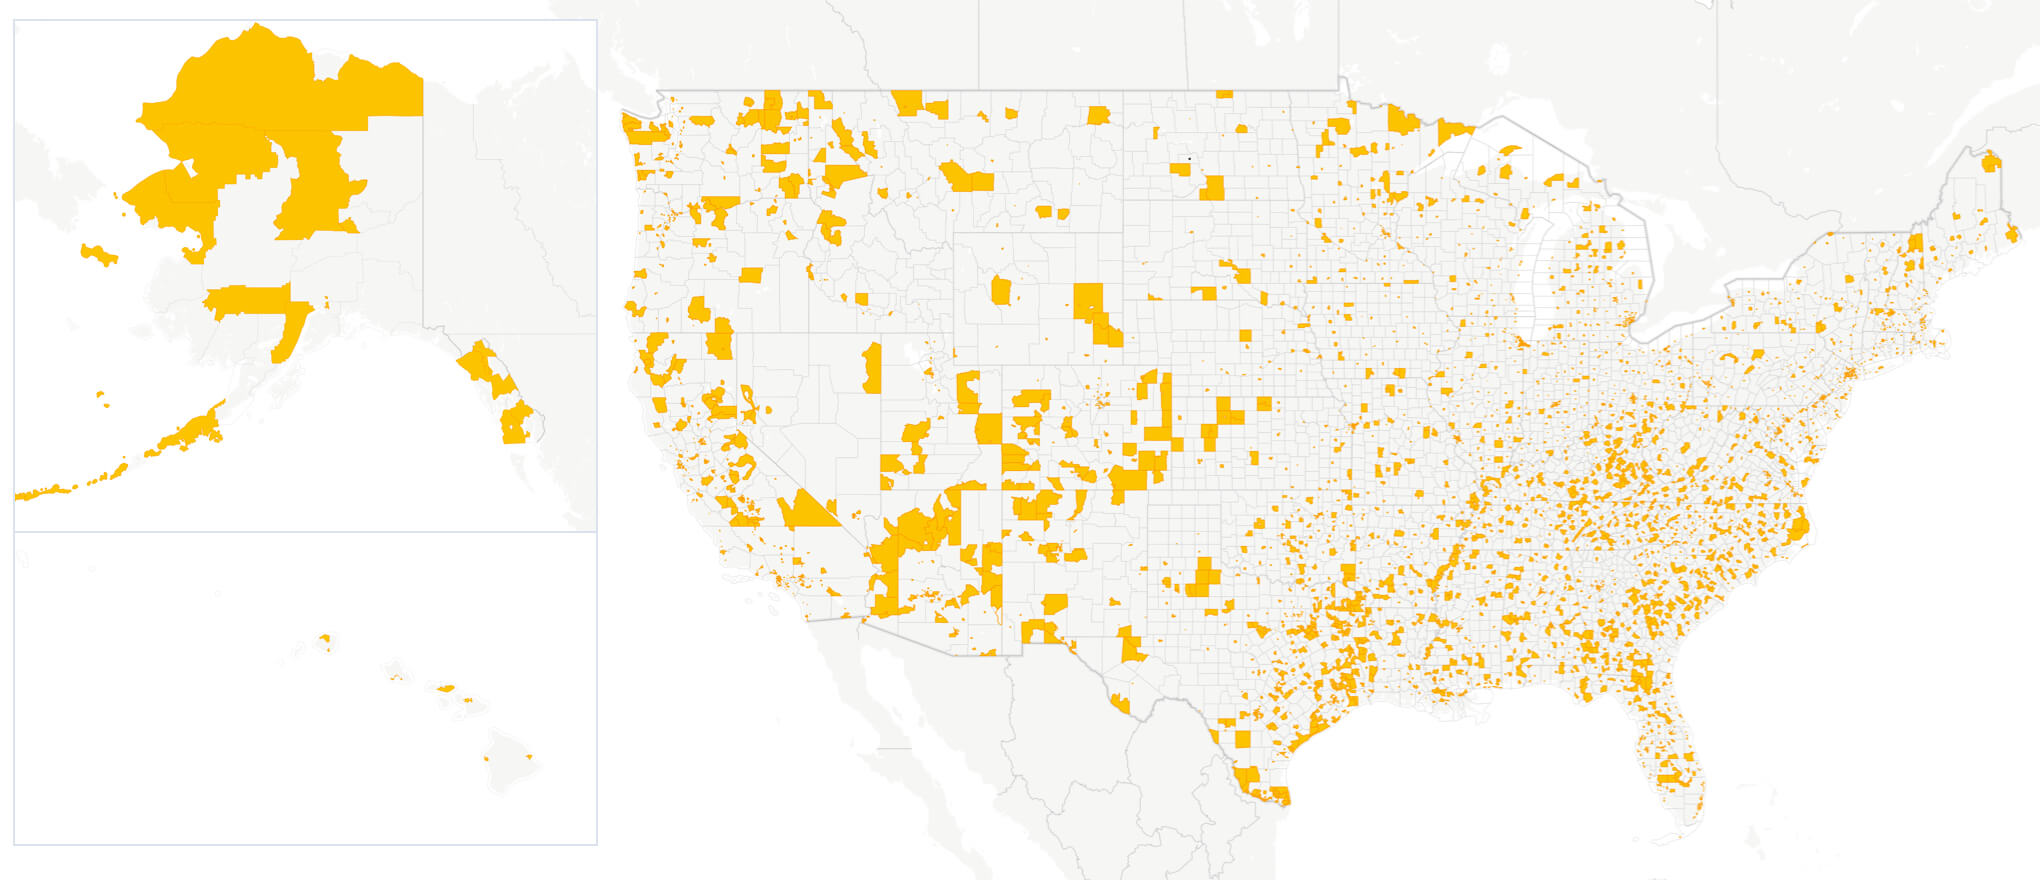
The Tax Cuts and Jobs Act passed by Congress in 2017 created ‘Opportunity Zones’ as a way to steer private sector investment into disadvantaged, and often overlooked, parts of American communities. The bill incentivizes projects in Opportunity Zones by offering tax breaks on investments, with greater tax breaks associated with longer investment timeframes. The bill directed each state to identify census tracts that would qualify, resulting in over 8,700 Opportunity Zones nationwide as displayed in the map below.
Opportunity Zone data is available out-of-the-box with UrbanFootprint, making it easier than ever to locate and analyze these areas in your community.
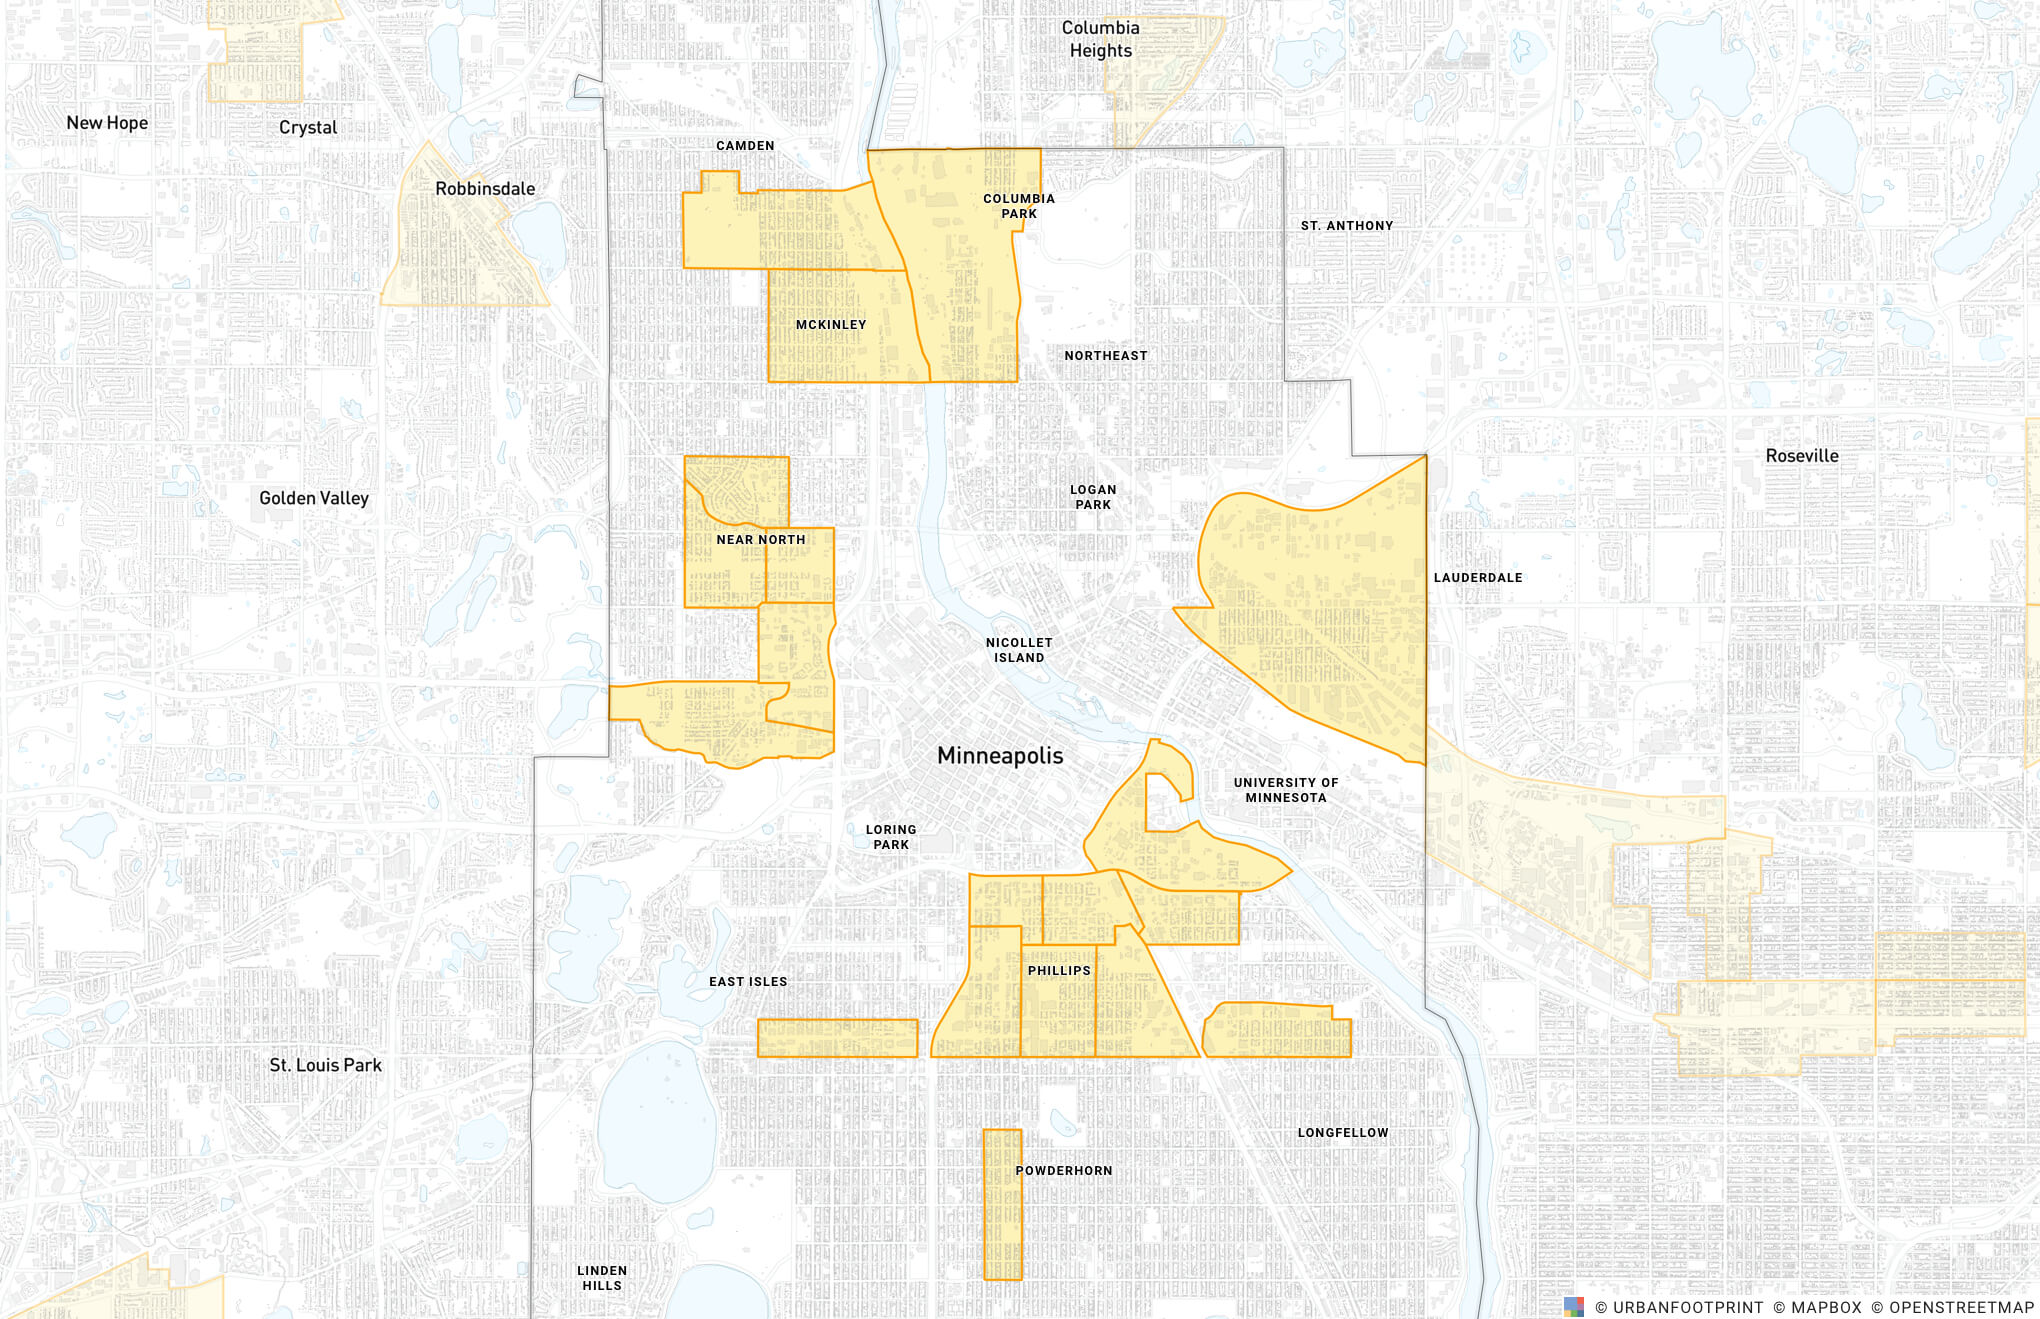
Paired with UrbanFootprint’s parcel-level land use data, you can take the analysis a step further to assess what particular properties within Opportunity Zones could accommodate new development. As an example, let’s look at the Opportunity Zones defined for Minneapolis. There are 19 census tracts designated as Opportunity Zones in the city, spanning 4,640 acres of land, or roughly 18 percent of the parcelized land in the city.
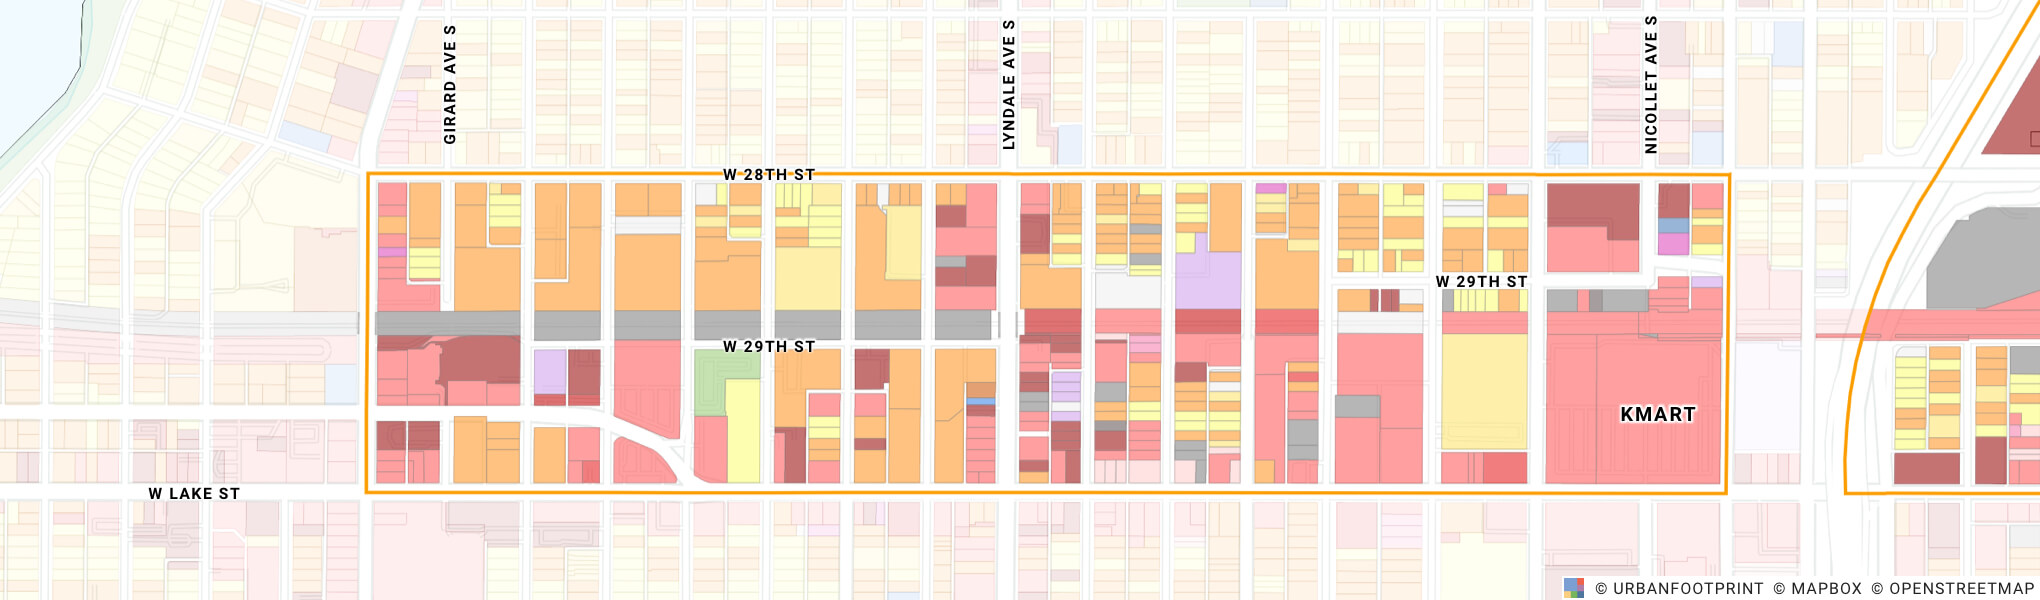
Next, let’s zoom in further to identify eligible parcels for new development. In this example, we are looking at an Opportunity Zone surrounding the Midtown Greenway, a rail corridor that has been converted to a bicycle and walking trail. The corridor features a mix of residential (orange) and commercial (pink) land uses.
We can further assess development potential by looking at UrbanFootprint’s Parcel Reference Data layer, which compiles tax assessment data and structure information for each parcel. The map below shows the Improvement to Land Value ratio for each parcel. Teal parcels have a high improvement value compared to the land (unlikely to redevelop). Orange indicates parcels with low improvement value compared to the value of the land.
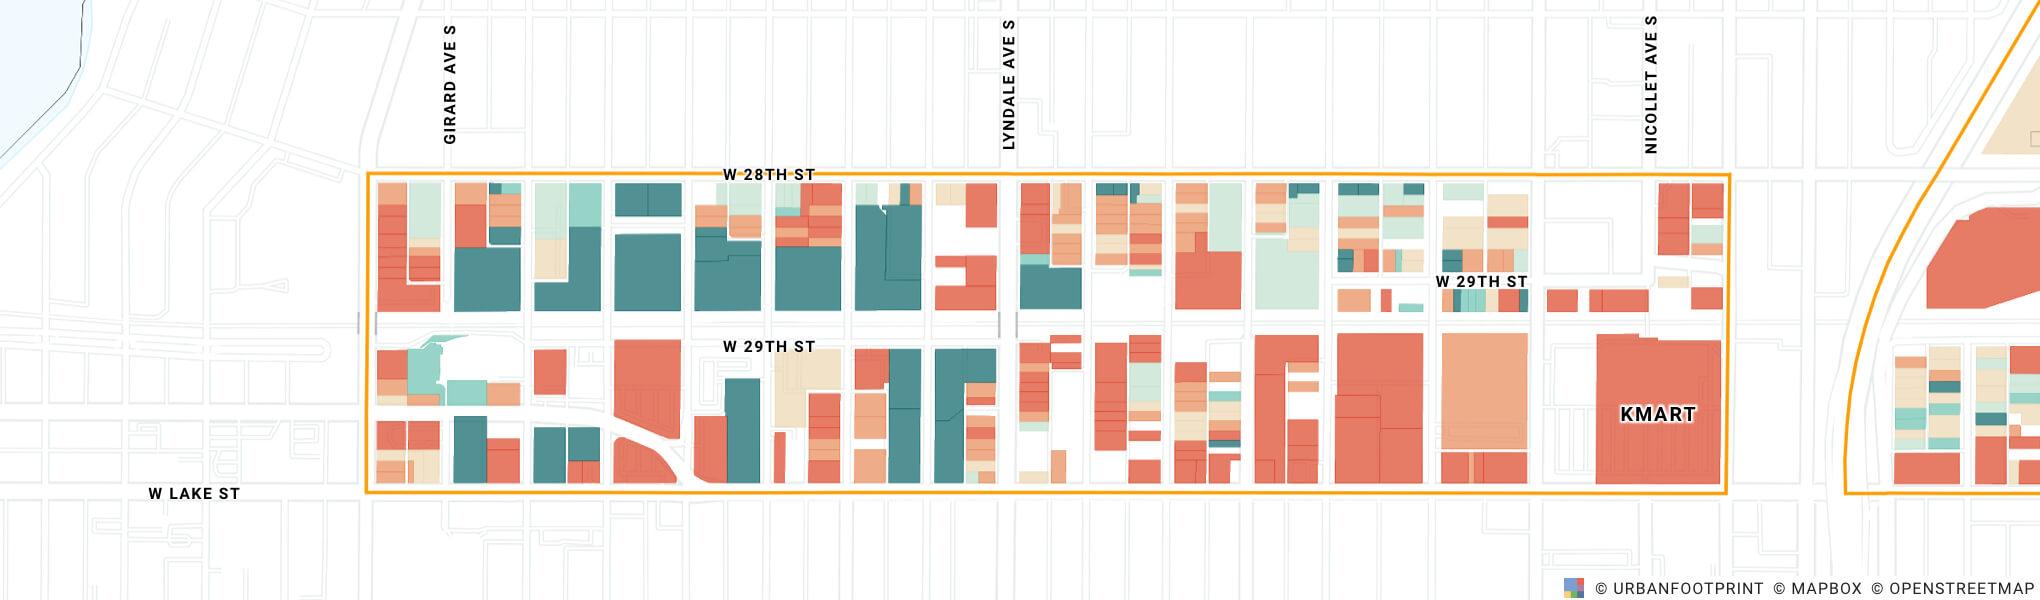
Using UrbanFootprint’s filter functionality, we can select just parcels where the land value is greater than the improvement value.
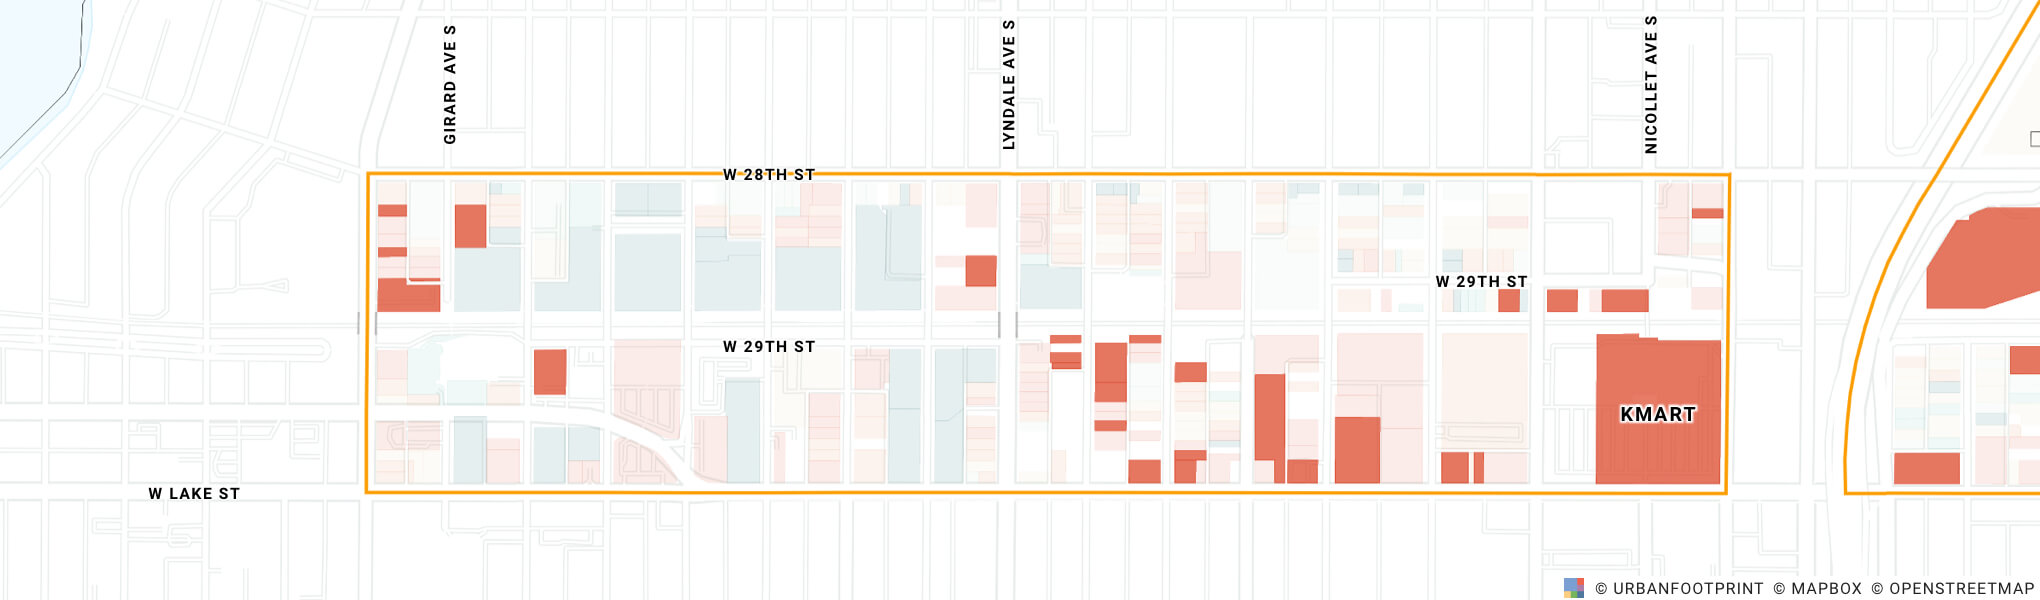
The large Kmart parcel on the eastern edge of the zone is an interesting candidate. We can see on the map that the parcel actually interrupts Nicollet Avenue – a major Minneapolis roadway. In fact, the city of Minneapolis nominated this census tract for consideration as an Opportunity Zone precisely because of their desire to see redevelopment of this site. The Kmart splitting Nicollet Avenue has long been the ire of Minneapolis residents, with the city going so far as to buy the land beneath the Kmart just to ensure they can control the redevelopment of the land should Kmart’s lease on the building expire. In this case, the Opportunity Zones tax advantage may provide an opportunity for the city to work with investors to help reconnect the road network and encourage development along a primary bicycle commute corridor in the process.
Interested in exploring and mapping Opportunity Zones in your community or planning project?
Book a demo with our team and learn how to set up your own analysis in minutes. We’ll share how to quickly explore existing conditions, map insights from thousands of preloaded datasets, build future scenarios, and analyze plan impacts in terms of transit accessibility, emissions, energy use, and more.
Have a question or comment? Let us know! We’d love to hear from you. Tweet us your thoughts or send us a note.
