


If you’re interested in creating a project like this, let us know!
Land use is the main lens that UrbanFootprint uses to view the world. UrbanFootprint has the most comprehensive, nationwide land use database available, which allows you to map and assess existing land use (i.e. the intensity and distribution of residential, commercial, and other uses) for any U.S. location. To make this wealth of parcel-level data easier to work with, we’re excited to introduce UrbanFootprint’s new land use categories. The land use categories provide a normalized view of the world and a common language for all stakeholders to better understand urban regions across the U.S.
Use the slider below to compare the more detailed Land Use Types (Level 4) on the left to the simplified Land Use Summary (Level 2) on the right:
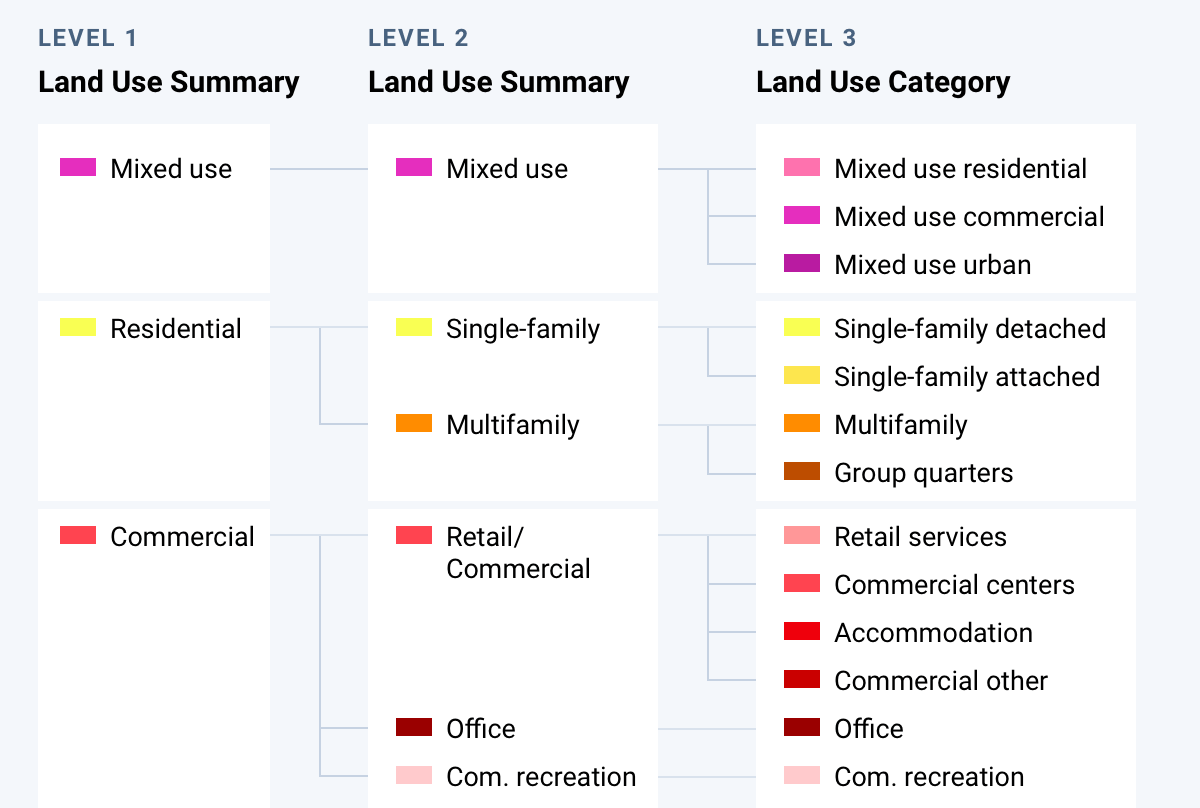
While UrbanFootprint’s out-of-the-box building types and place types make it easy to understand existing land use and build scenarios, the more simplified land use categories allow you to choose the level of detail you’d like to explore, acting as an overlay for the detailed building and place types. The nested structure (see below) allows you to view and query land use data at multiple levels of detail, depending on the question you are trying to answer or the idea you want to convey in a map.
Let’s take a look at a few examples of how to use land use categories to quickly understand everything from your project area to identifying potential sites based on specific criteria.
Map existing land use
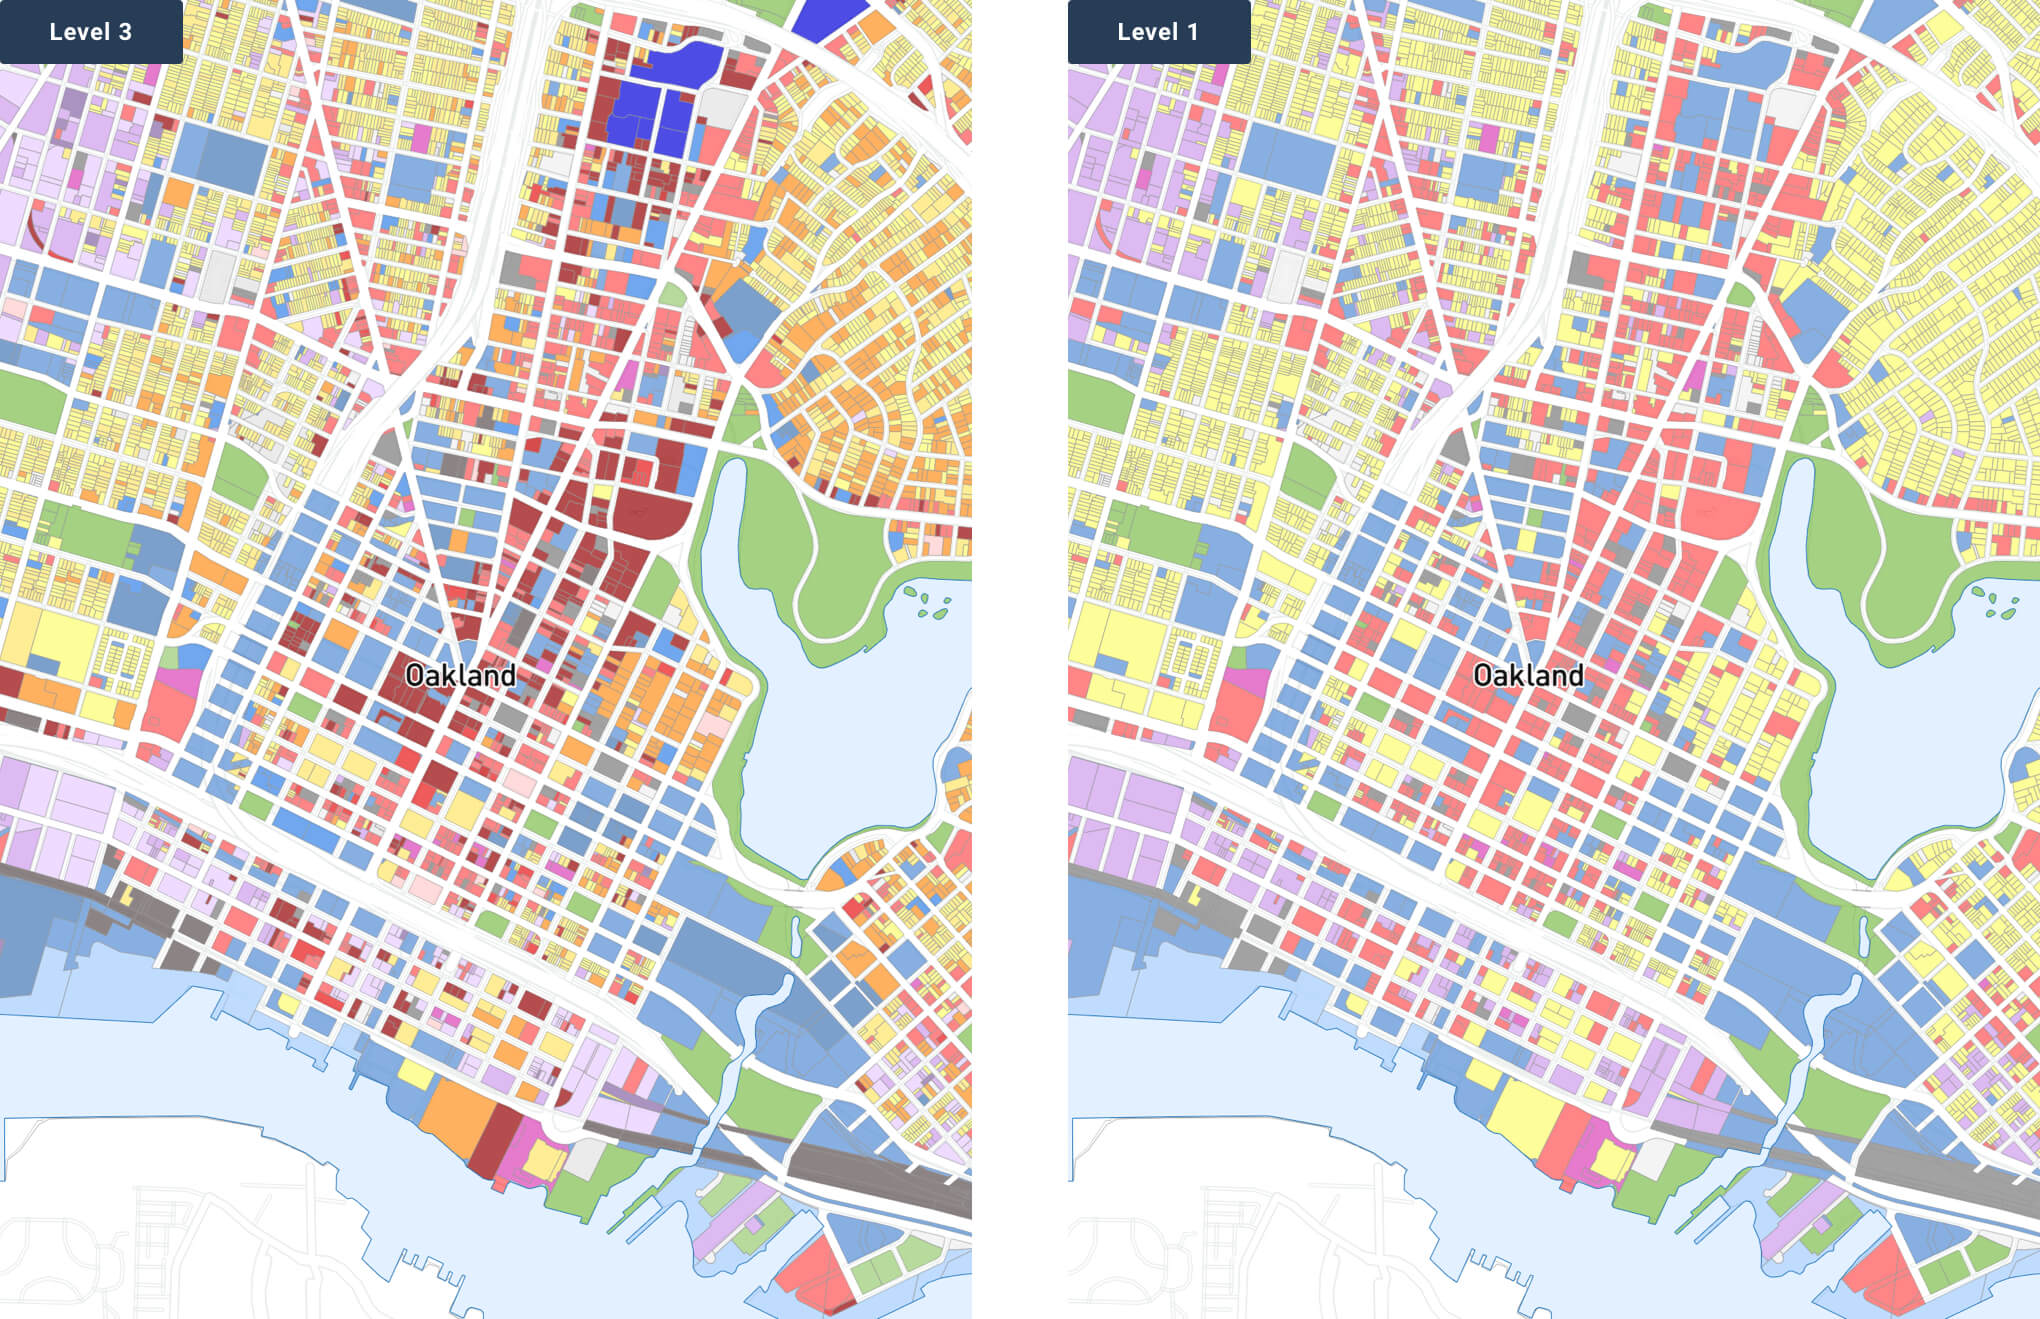
Let’s say you’d like to create a map of existing land use in Oakland, California. Upon creating a project, UrbanFootprint will display all the parcels in the city, color-coded by land use, as shown on the left in the exhibit below. However for this use case, a more simplified view of these land use categories may be preferred. To make a simpler map, change the column from the more detailed Land Use Category (Level 3) to a Land Use Summary Category (Level 1). Using this curated data and symbology, you can export easy to understand existing condition maps for proposals and existing conditions reports. (For more details, check out a step-by-step tutorial here).
Identify potential sites for Accessory Dwelling Units
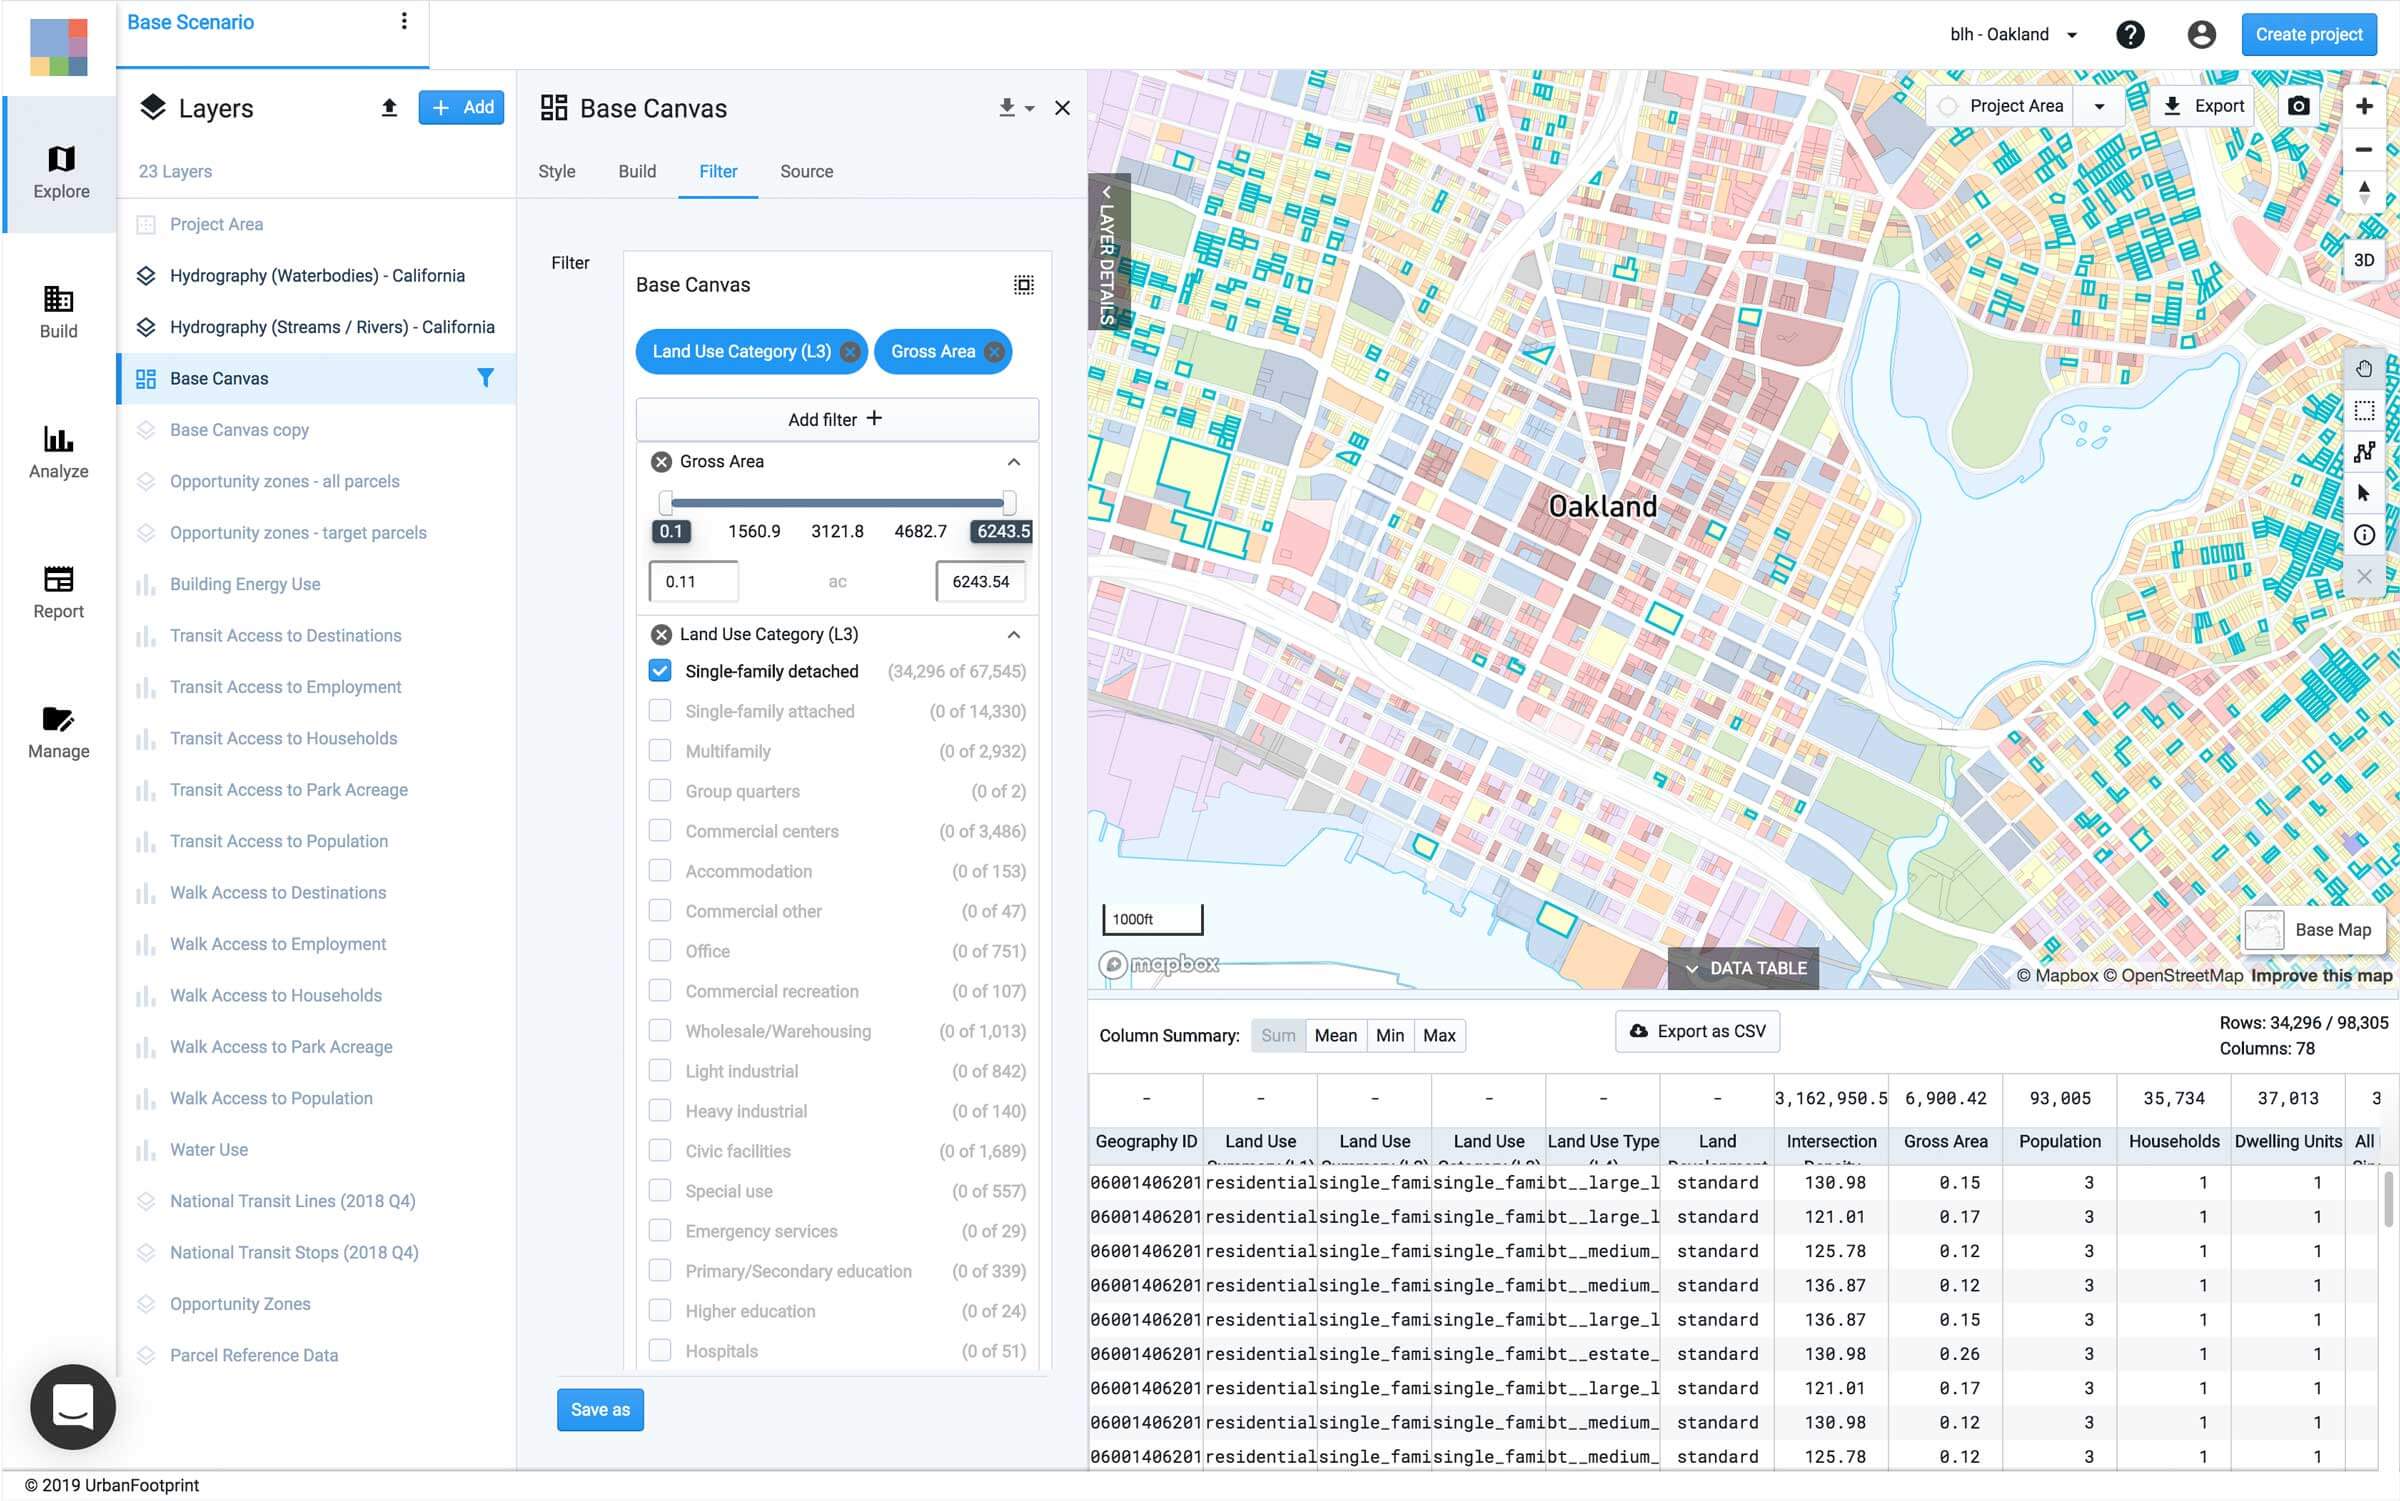
You can also leverage the land use categories to quickly identify parcels that match a certain criteria. In this example, let’s say you wanted to locate all single-family lots over 5,000 square feet, as potential sites for Accessory Dwelling Units (a small additional unit on a single-family property) in Oakland.
Using the level 3 land use category, you can select all single-family detached parcels bigger than 5,000 square feet. The parcels highlighted in teal below meet the criteria. Looking at the data table, you can see 34,000 parcels are potential sites for Accessory Dwelling Units.
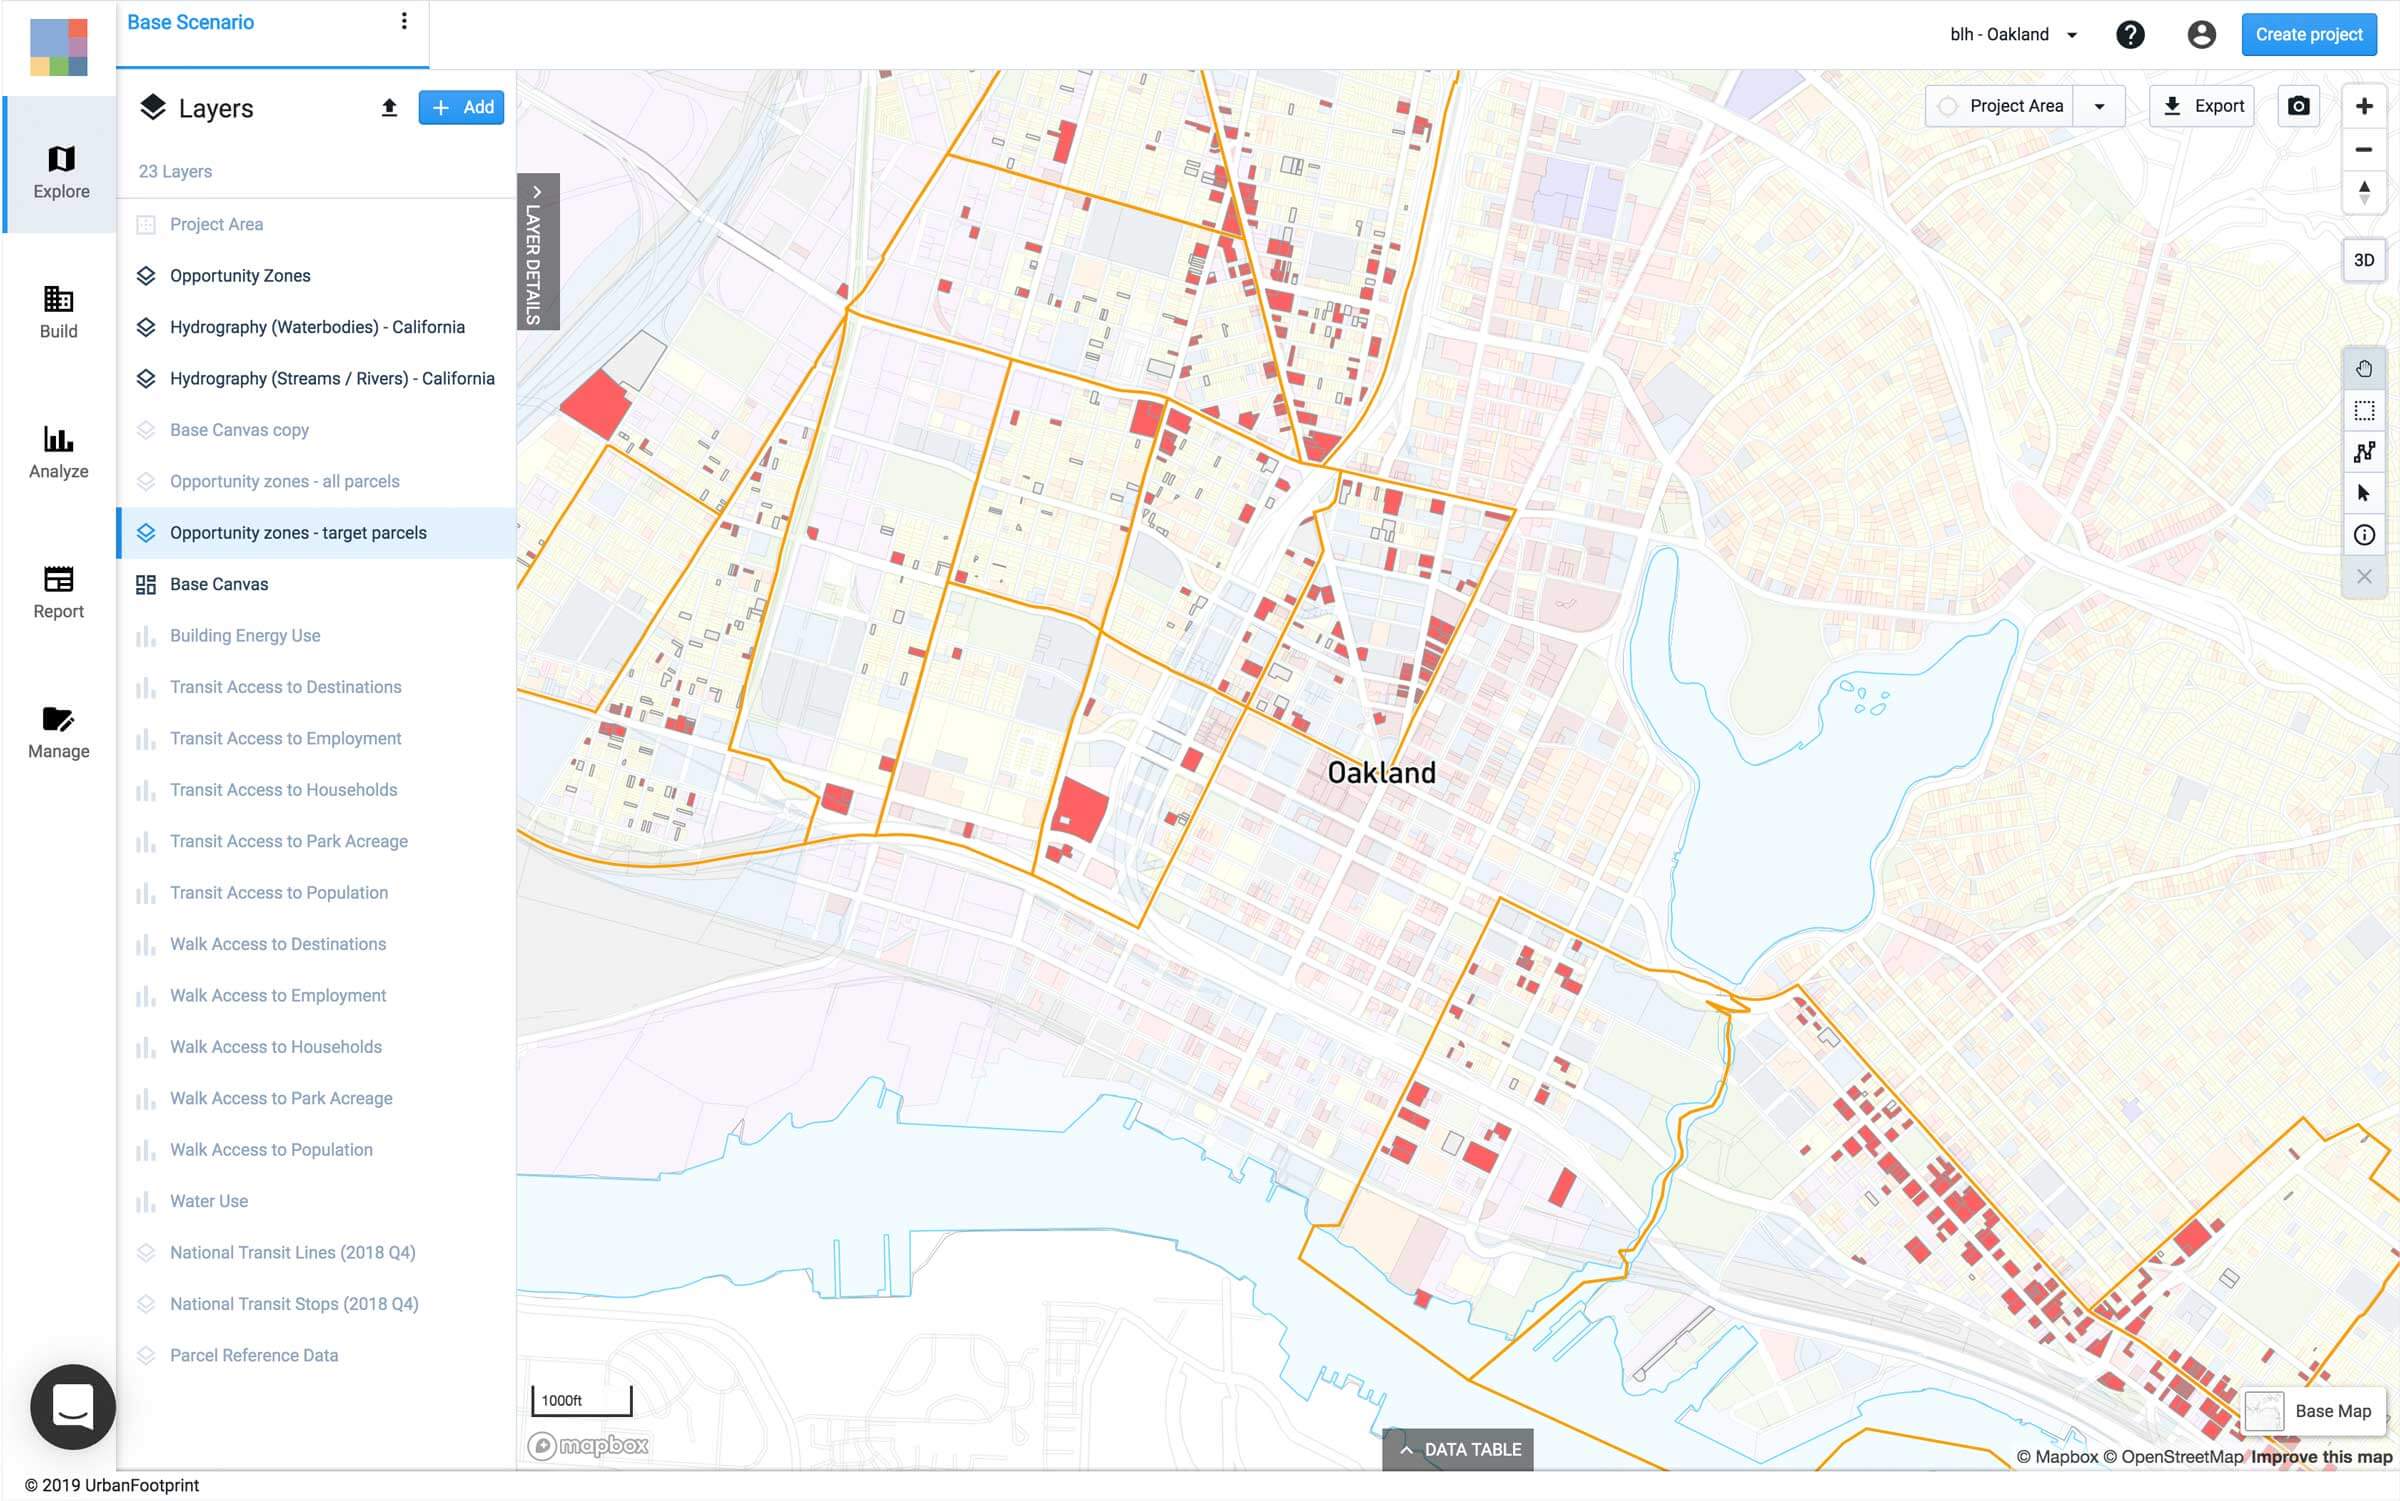
Identify redevelopable parcels in Opportunity Zones
You can include additional layers to ask more complex questions of the data. For example, we recently did an analysis of redevelopable parcels in Opportunity Zones. Applying this analysis to Oakland, first you would identify all parcels within the Opportunity Zone Census tracts.
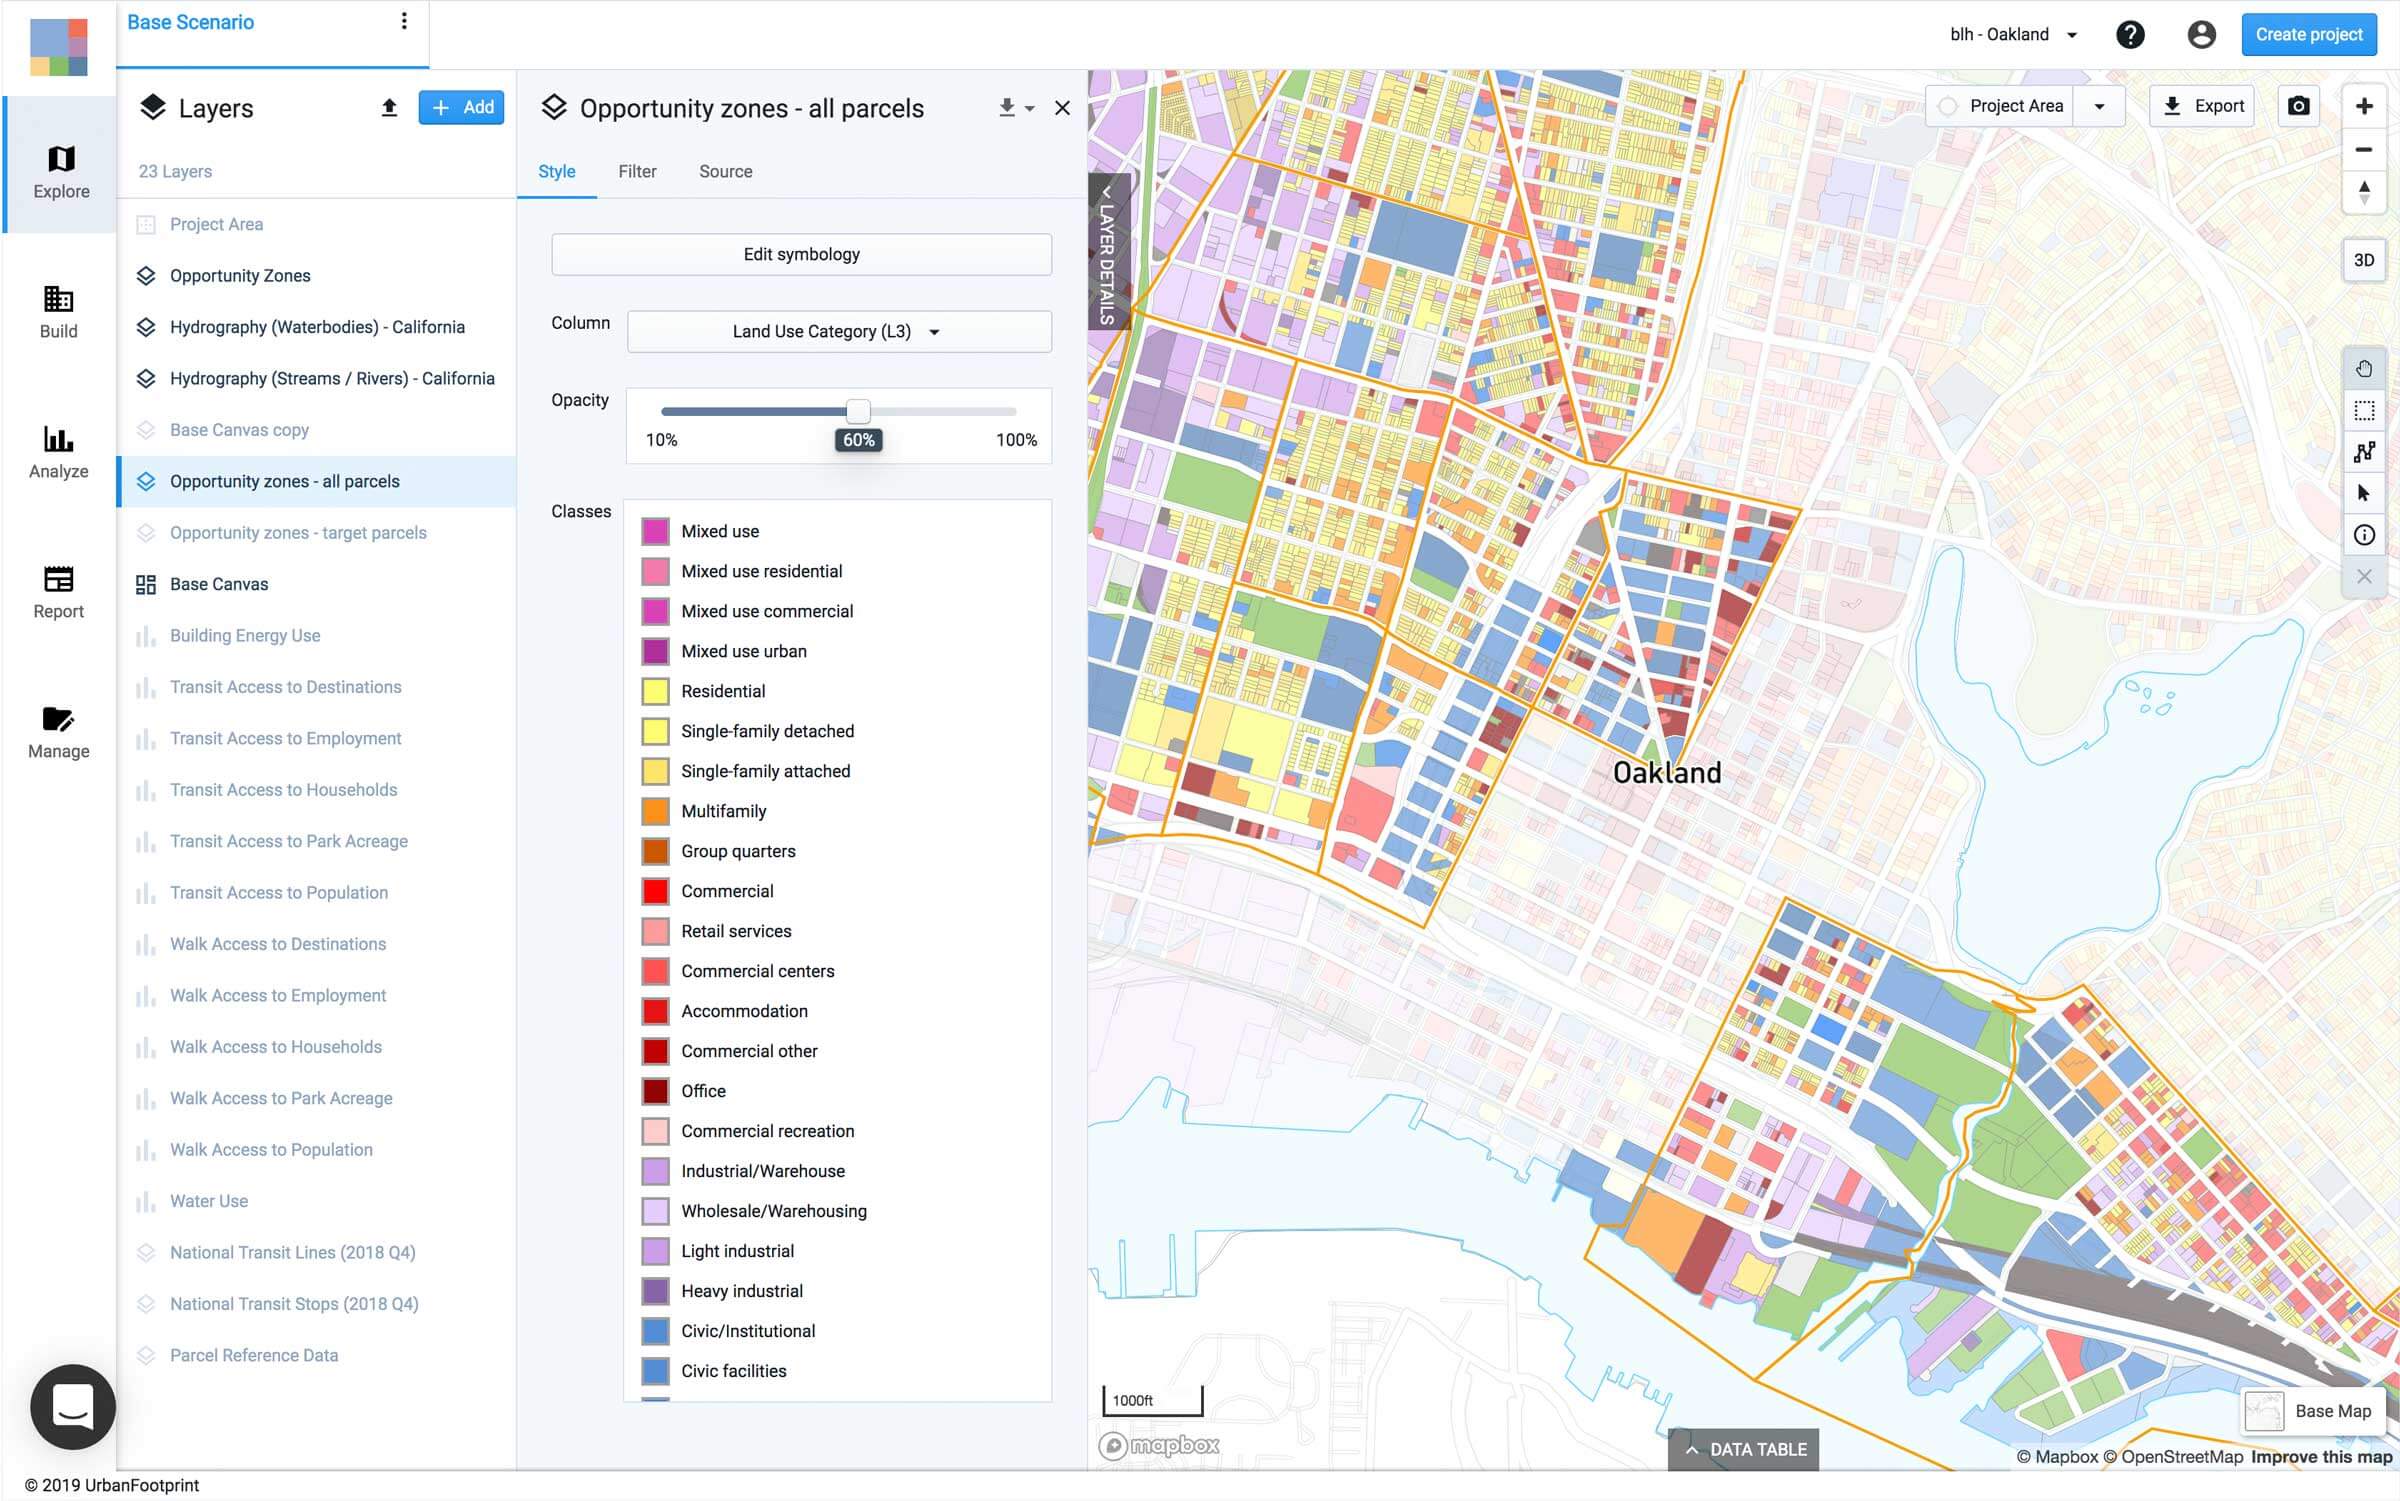
You could then further refine the selection to include only commercial centers and vacant parcels where the value of the land was greater than the improvement value, resulting in 1,745 parcels (450 acres).
| Parcels | Acres | |
| All Opportunity Zone tracts | 23,799 | 26,250 |
| Potential for redevelopment | 1,745 | 447 |
| Commercial centers | 1,289 | 400 |
| Vacant | 456 | 47 |
To learn more about land use categories in UrbanFootprint, see our documentation article.
Ready to get started? Learn more about leveraging land use data in UrbanFootprint.
Have a specific use case or example you’d like to review? Book a demo with our team. We’ll share how UrbanFootprint is designed to enhance and streamline your planning process.
