


California State Senator Scott Weiner’s Senate Bill 50 aims to address California’s housing crisis by stimulating more housing development in existing residential areas. SB 50 made it one step closer to law last month as it made it past the Senate’s Governance and Finance Committee. Like so many bills, as SB 50 winds through the legislature and grows in complexity, it becomes increasingly difficult to understand and measure the potential impacts of the proposed legislation.
In this study, we’ll illuminate the data needed to better understand how SB 50 may address California’s complex and urgent housing crisis. Similar to our evaluation of 2018’s SB 827, and our analysis of upzoning California’s vast commercial strip corridors, we’ll attempt to peel back the onion that is SB 50 and shed some light on how its various layers might impact communities across the state.
The Many Layers of SB 50
Let’s quickly summarize the basics of SB 50. While the bill initially focused on upzoning in and around high quality transit areas, it’s gotten more nuanced as it now includes several qualifying factors to specify which areas are eligible. These include the addition of focusing on ‘jobs rich’ areas, new disqualifying filters for ‘sensitive areas’ where displacement could be more likely, and ‘hazard’ filters for fire and natural disaster risk.
The onion gets thicker with the merging of SB 4 into SB 50, which allows up to four housing units on vacant land originally zoned for single-family homes and the splitting of existing single-family homes into multiple units. The latest draft also limits the highest upzoning around transit to counties with over 600,000 residents.
Clearly, parsing the impacts of SB 50 is complex. For the purposes of our study, we’ll focus on where the impact will be greatest – in the 14 most populated counties of the state. For these counties, the bill would impact existing residentially zoned areas in the following ways:
- For parcels within ¼ mile of a rail or ferry stop, the zoning would be increased to a 55-ft height maximum, a maximum Floor Area Ratio of (3.25), and density limits and parking minimums waived.
- For parcels from ½ to ¼ mile of a rail or ferry stop, the zoning would be increased to a 45-ft height maximum, a maximum Floor Area Ratio of (2.5), and density limits and parking minimums waived.
- For parcels within ¼ mile of a stop on a high quality bus corridor1, density limits are waived, parking minimums are lowered to ½ space per unit, and height limits and other zoning restrictions remain unchanged.
- For parcels within “jobs-rich areas”2, density limits are waived, parking minimums are lowered to ½ space per unit, and height limits and other zoning restrictions remain unchanged.
- For all other residentially-zoned parcels, single-family zoning restrictions are lifted to allow for up to four units on a parcel, so long as the existing building area is not increased by more than 15% and other zoning regulations are still upheld.3
For each of these above criteria, there are important additional stipulations and disqualification criteria aimed to ensure development is not encouraged in disaster-prone areas or in areas where sensitive populations may be adversely impacted by the bill. These include:
- Sensitive communities are not immediately subject to the zoning changes. Rather they have until 2025 to decide to opt in or define their own changes. The bill currently defines sensitive communities as:
- Very High Fire Hazard Severity Zones6 are exempt from the upzone impacts.
- Coastal Zones in small cities are also exempt from the upzone process, with all coastal areas limited to infill development only.
- Historic Districts already adopted by state senate are also exempt.
- Tenant-Occupied and Rent Controlled parcels are exempt.
Peeling the Onion: Exploring the Potential Impacts SB 50
How is a county, city, or neighborhood impacted by the various eligibility and disqualifying criteria of SB 50? What parts of a city will be impacted? How big of a change will it be from existing zoning? As the bill gets more complex, these questions become more difficult to answer.
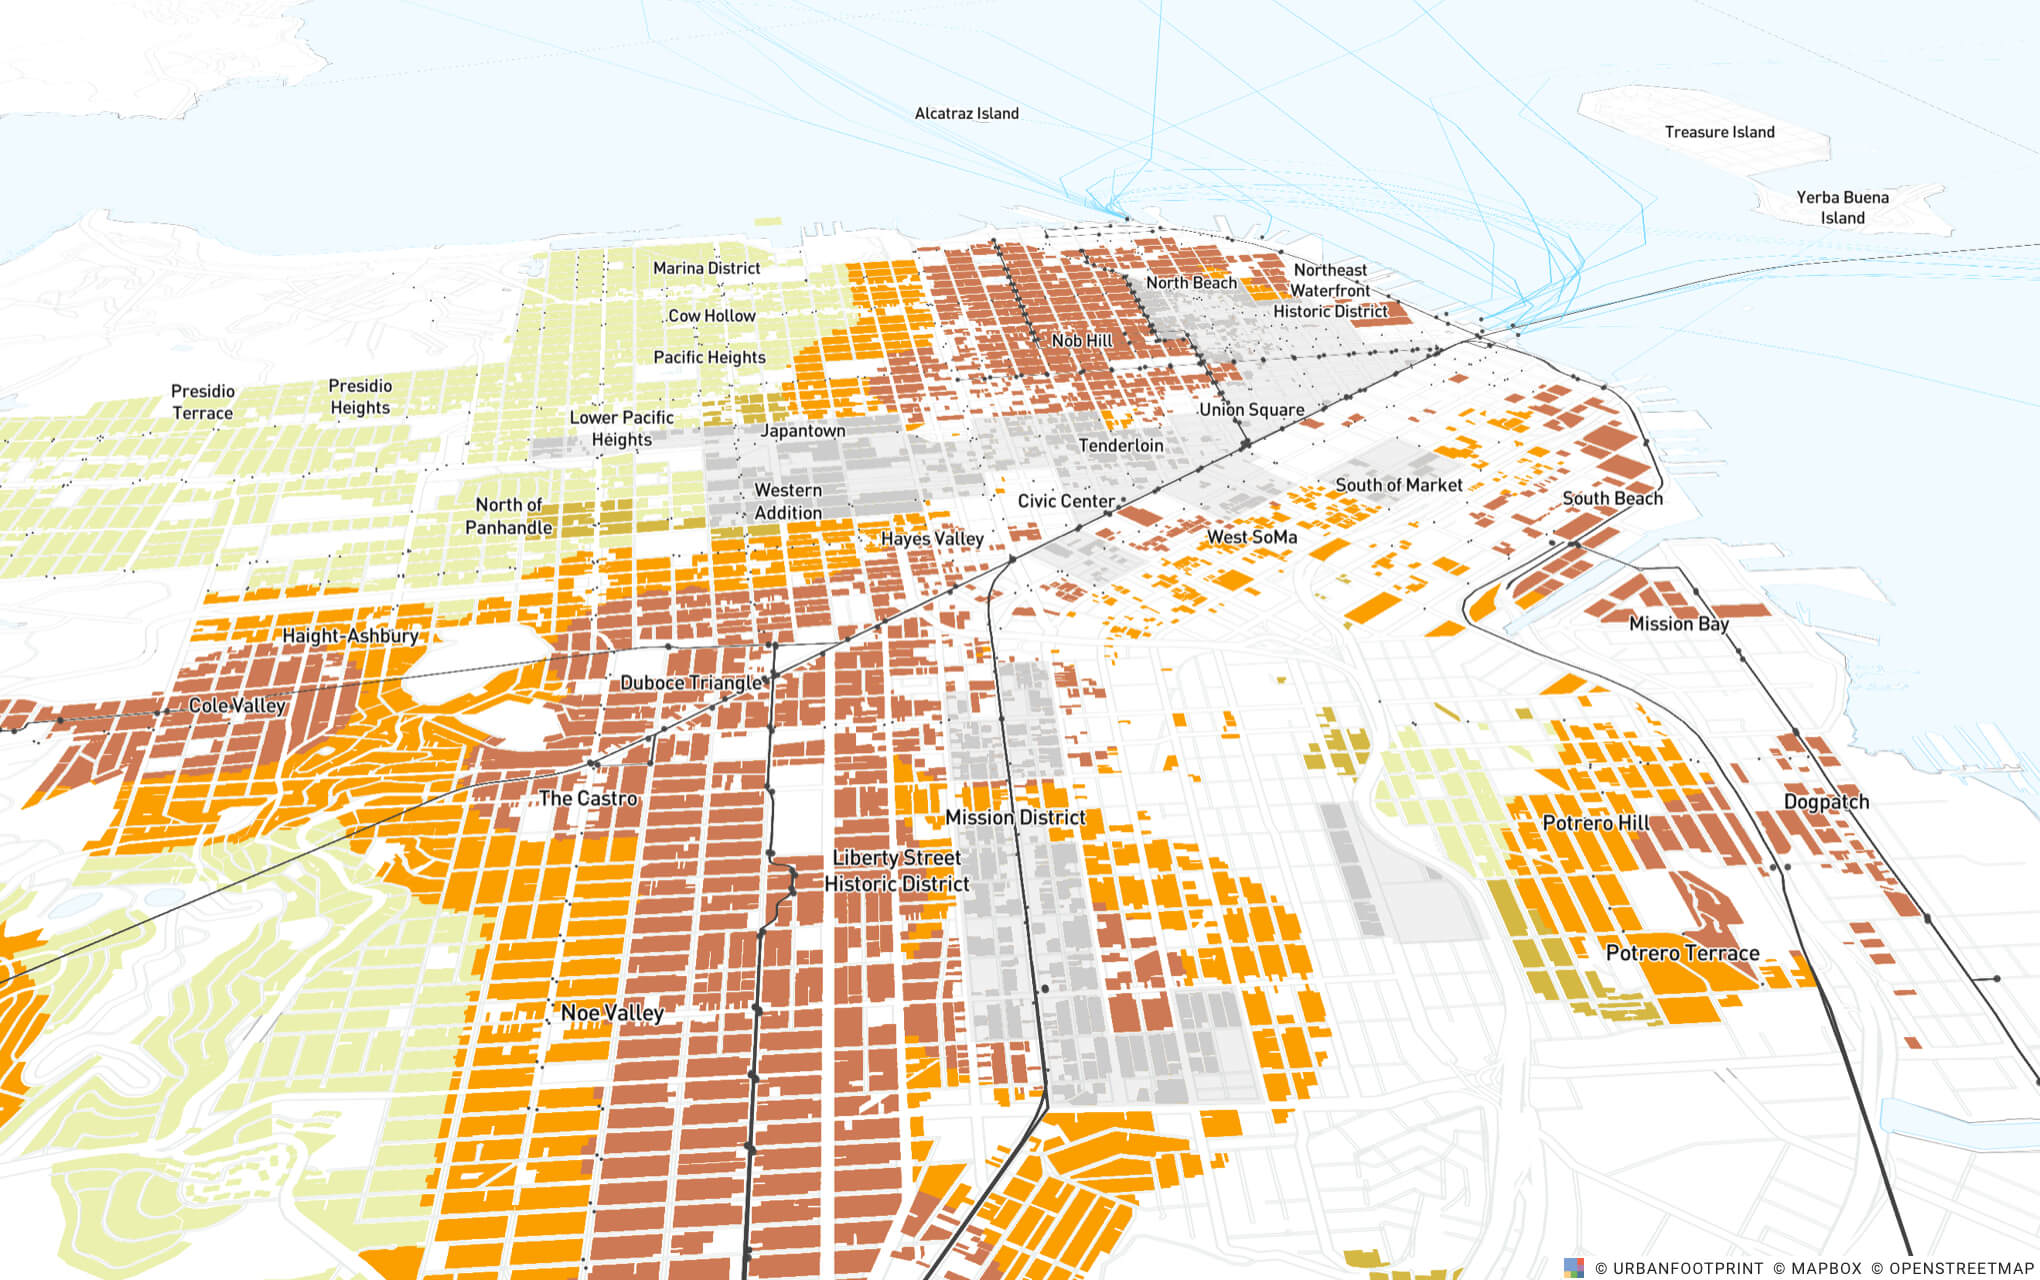
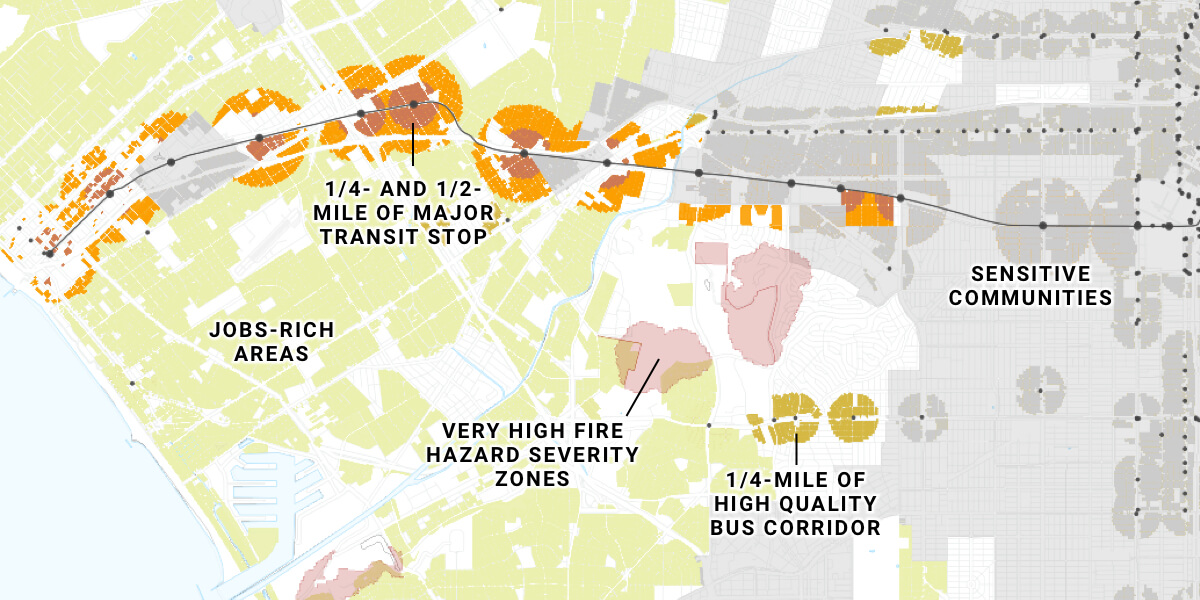
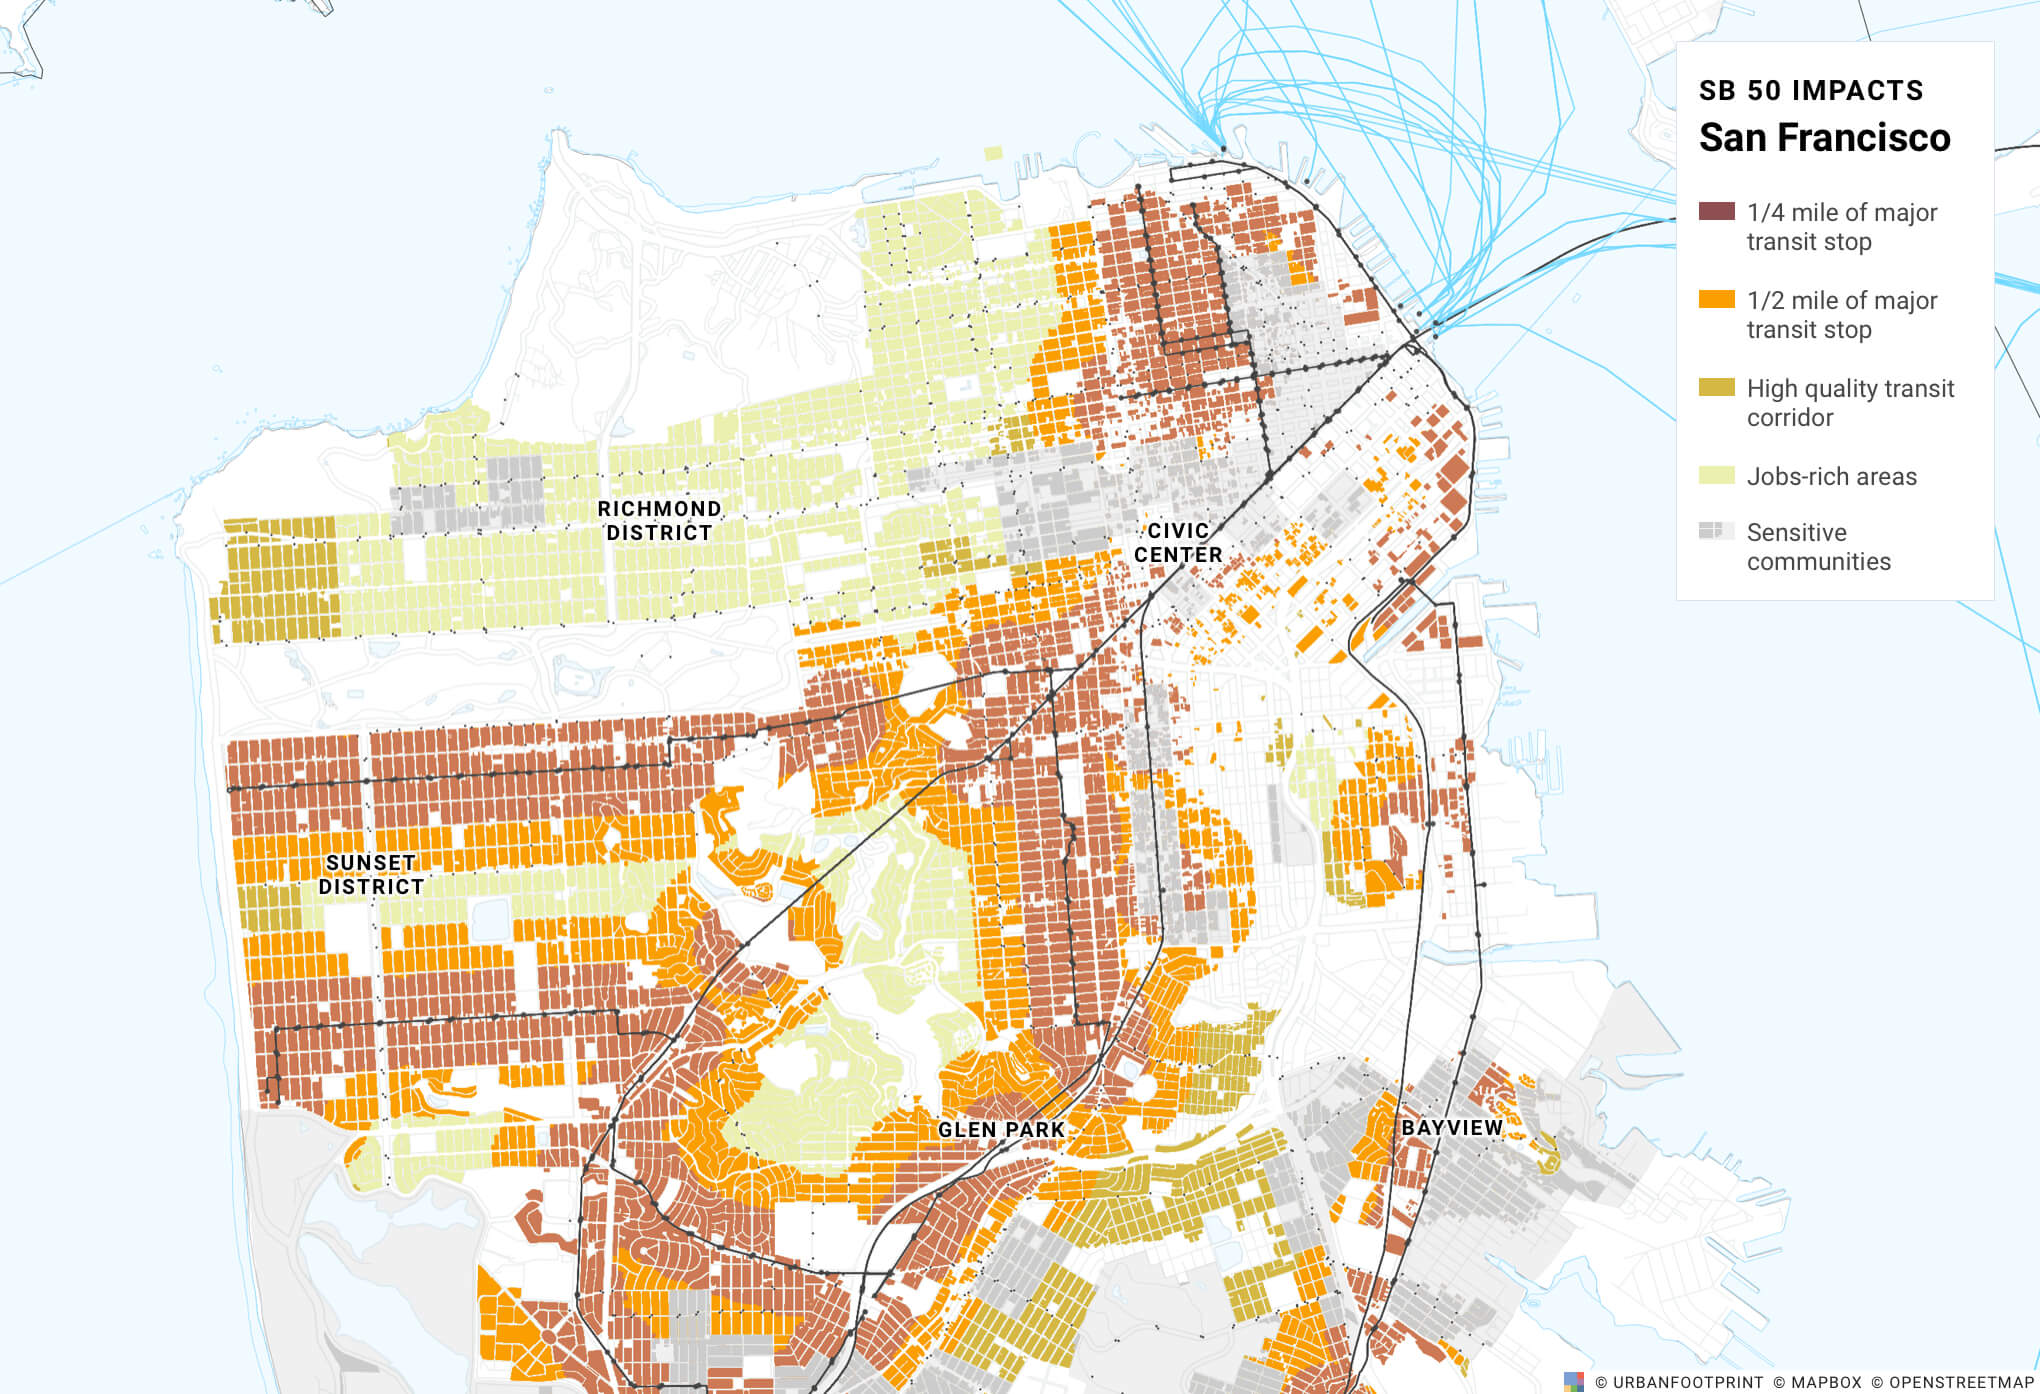
As most datasets required to do this analysis are already available in UrbanFootprint, we wanted to help peel the SB 50 onion to tease out how its various provisions could impact different communities across the state.Each of SB 50’s criteria can be represented as different geospatial layers, and each of them can be visualized, interrogated, intersected, and evaluated for any city in California directly within UrbanFootprint. First, we use the UrbanFootprint Base Canvas, a normalized layer of nationwide parcels, to quickly evaluate current land use conditions. Then, a host of curated reference layers interface with the Base Canvas to hone in on the areas eligible for SB 50 upzoning, as visualized in the map sequence below.
We used these layers to evaluate the impact of the bill in the fourteen largest counties in the state to explore how each region may be impacted by the various provisions in the bill. Here are some of the key takeaways from our analysis.
Key Takeaways:
The Jobs-Rich provision could play an outsized role, compared to high quality bus corridors.
Jobs-rich areas and high quality transit areas are eligible for the same ‘upzoning’ or removal of density limits. When the areas are overlaid with one another, the jobs-rich areas encompass a much greater area than the transit rich areas. There are debates underway as to how to specifically define a ‘high quality bus corridor’ under SB 50. Should it be defined by 10-minute or 15-minute service headways? Other criteria? But it turns out in most areas, the bus corridors are already included under the jobs-rich provision. This suggests the debate over the definition of high quality bus areas may be less important than the criteria to define a ‘job-rich’ area.
Sensitive community provisions play a large factor depending on the region of the state.
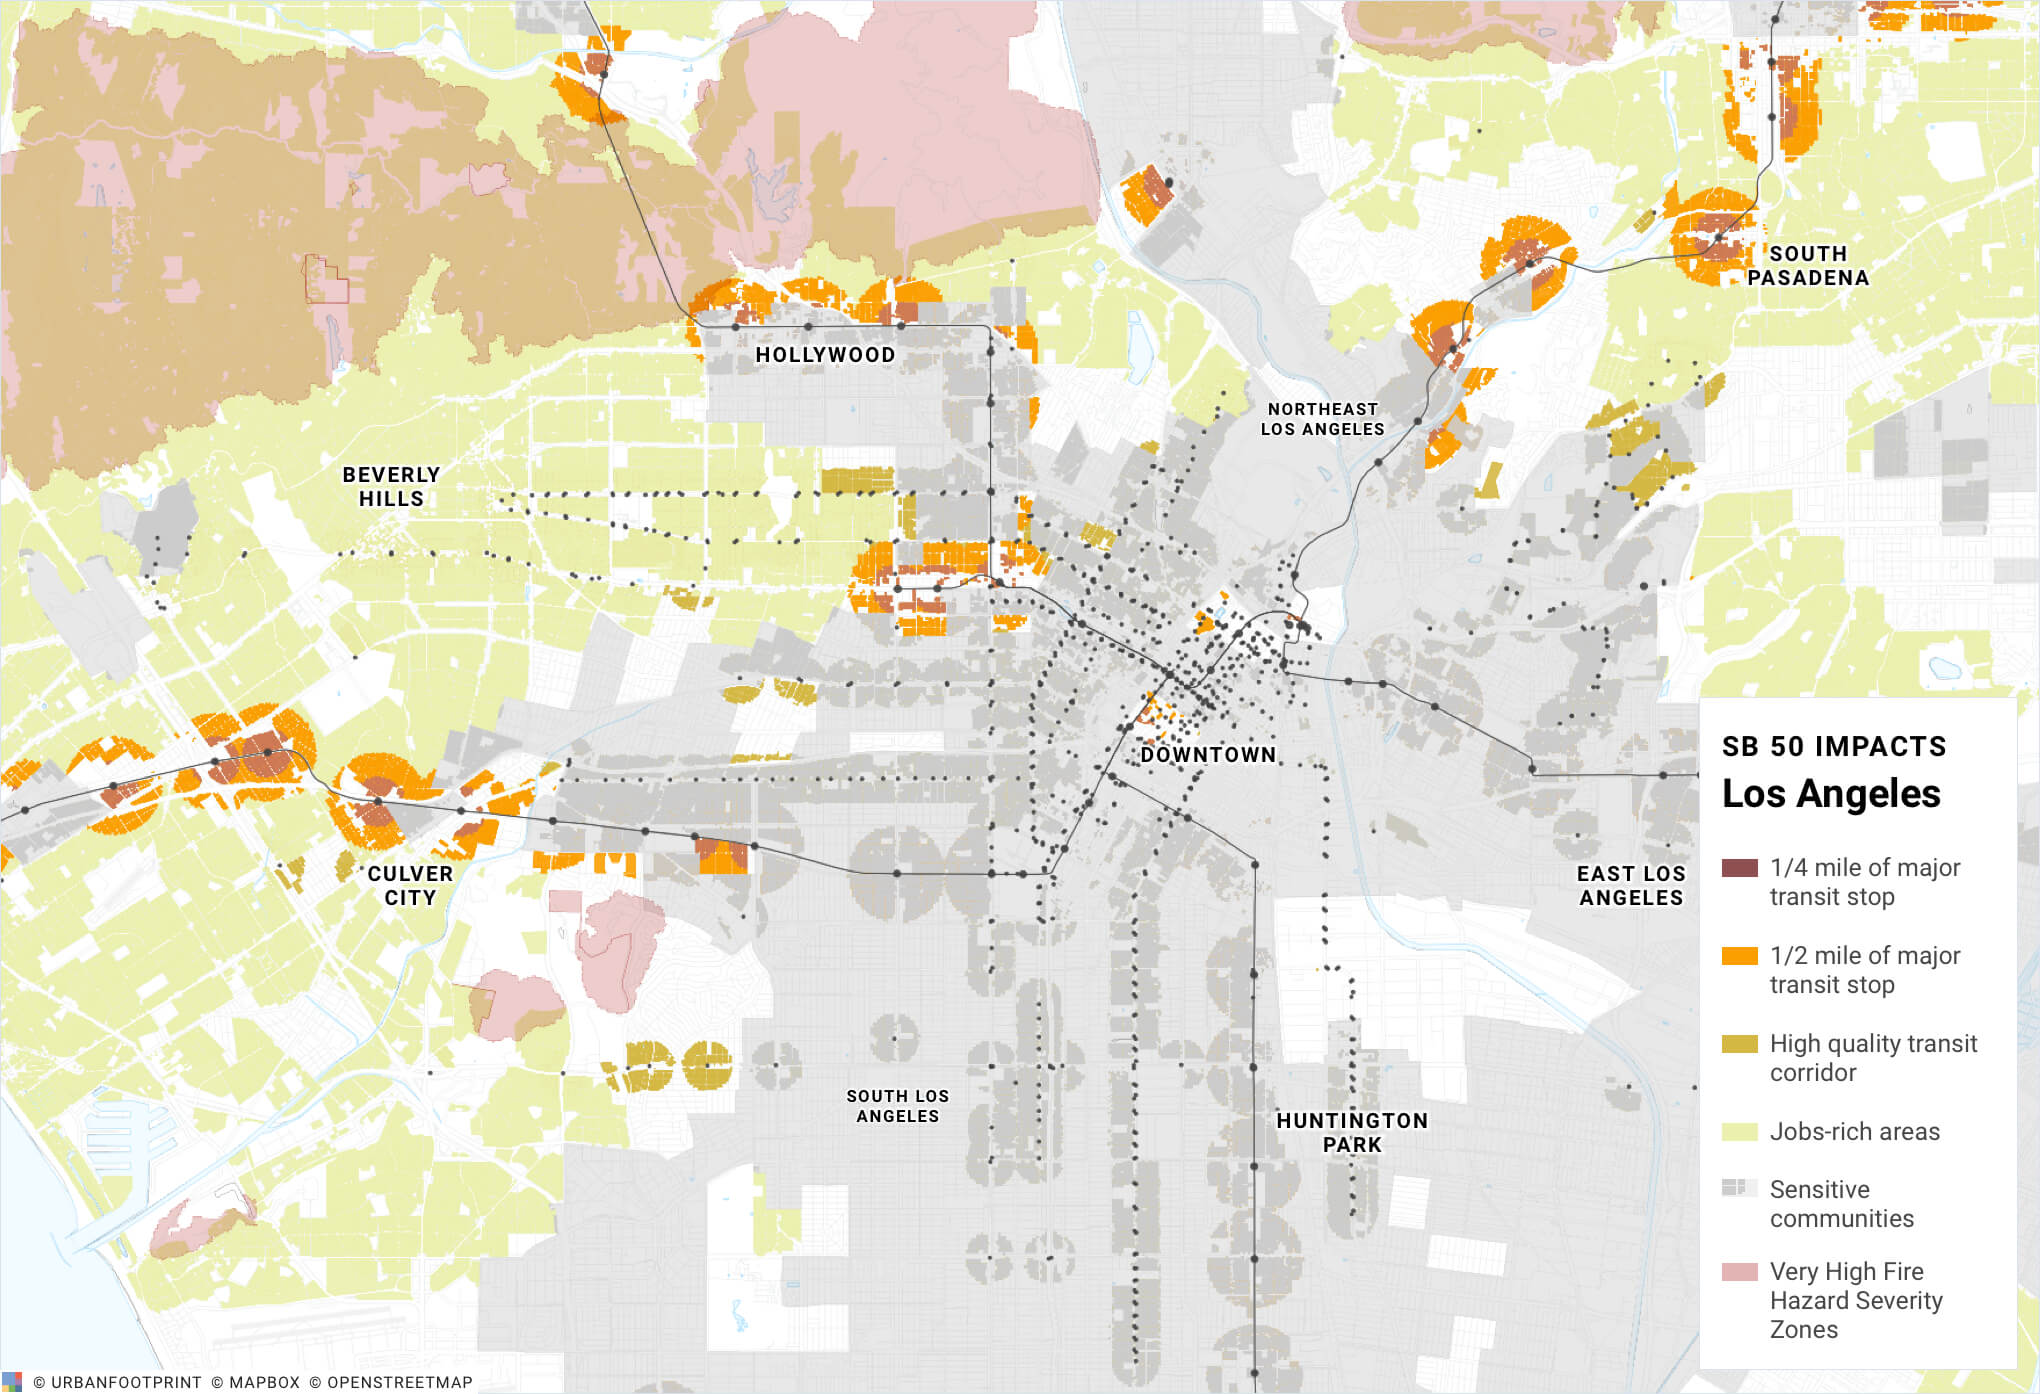
SB 50 provisions aimed to reduce detrimental impacts of the bill on disadvantaged communities have an outsize impact in certain parts of the state. For Los Angeles County, this provision removes over 10,000 acres, or over 60% of residential properties, that would otherwise have been upzoned to four or five stories based on SB 50’s rail and ferry station areas criteria. Other counties, such as San Francisco, have significantly fewer areas considered ‘sensitive’ based on the bill’s criteria, and therefore have a higher proportion of their station areas included in the upzoning under SB 50.
![]()
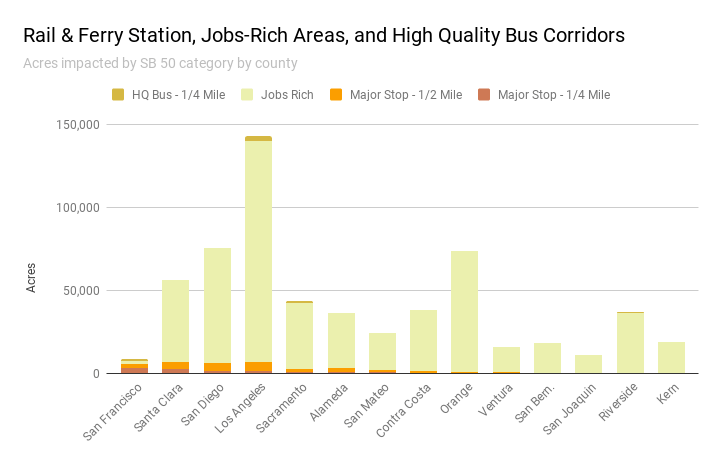
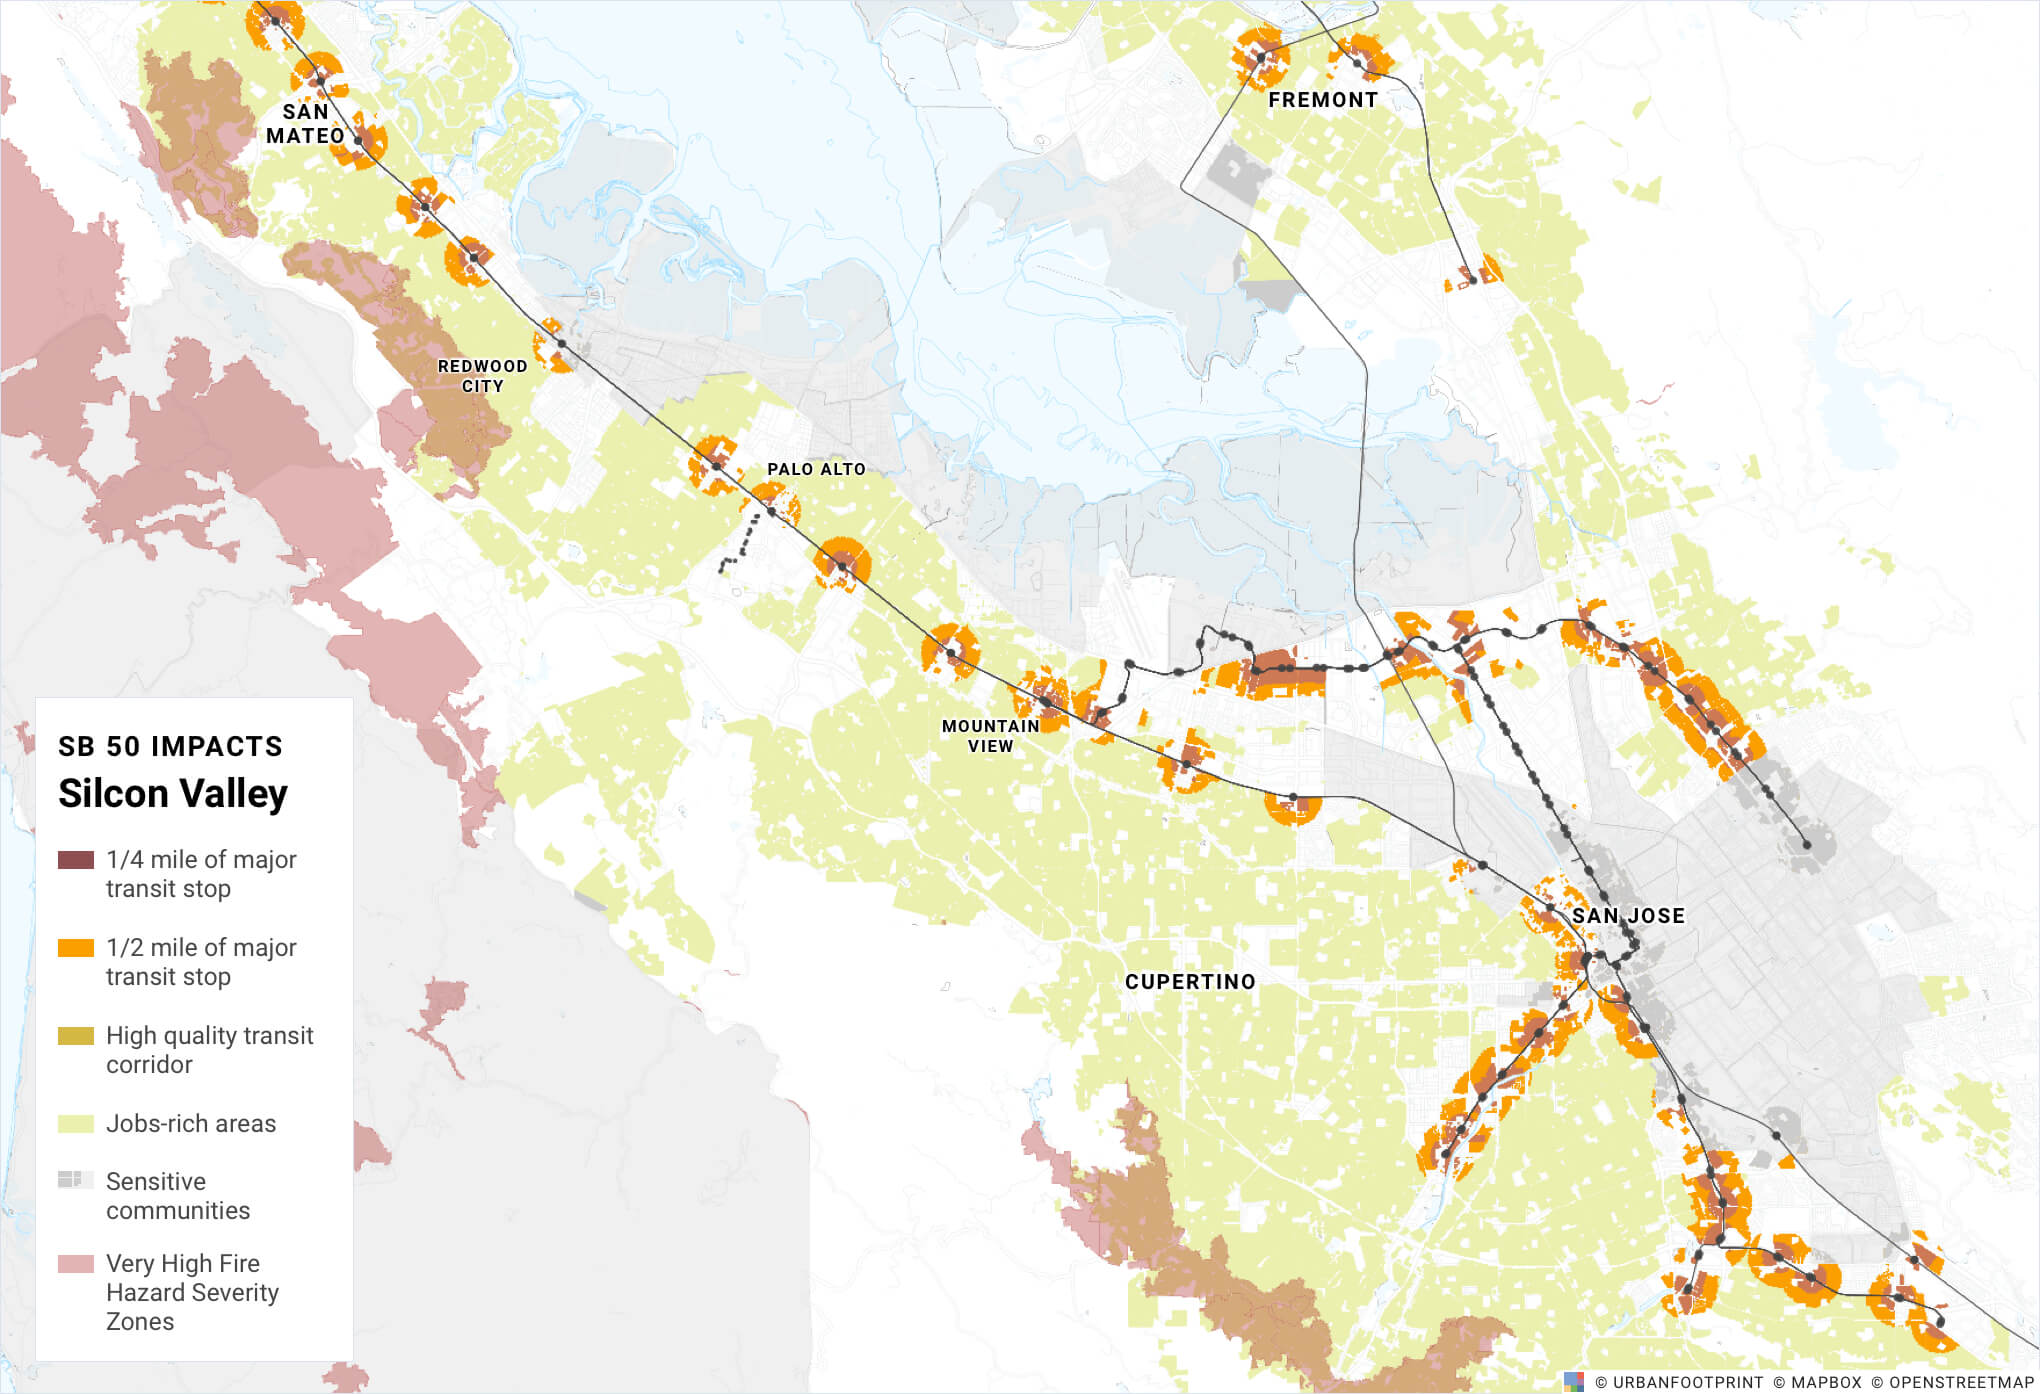
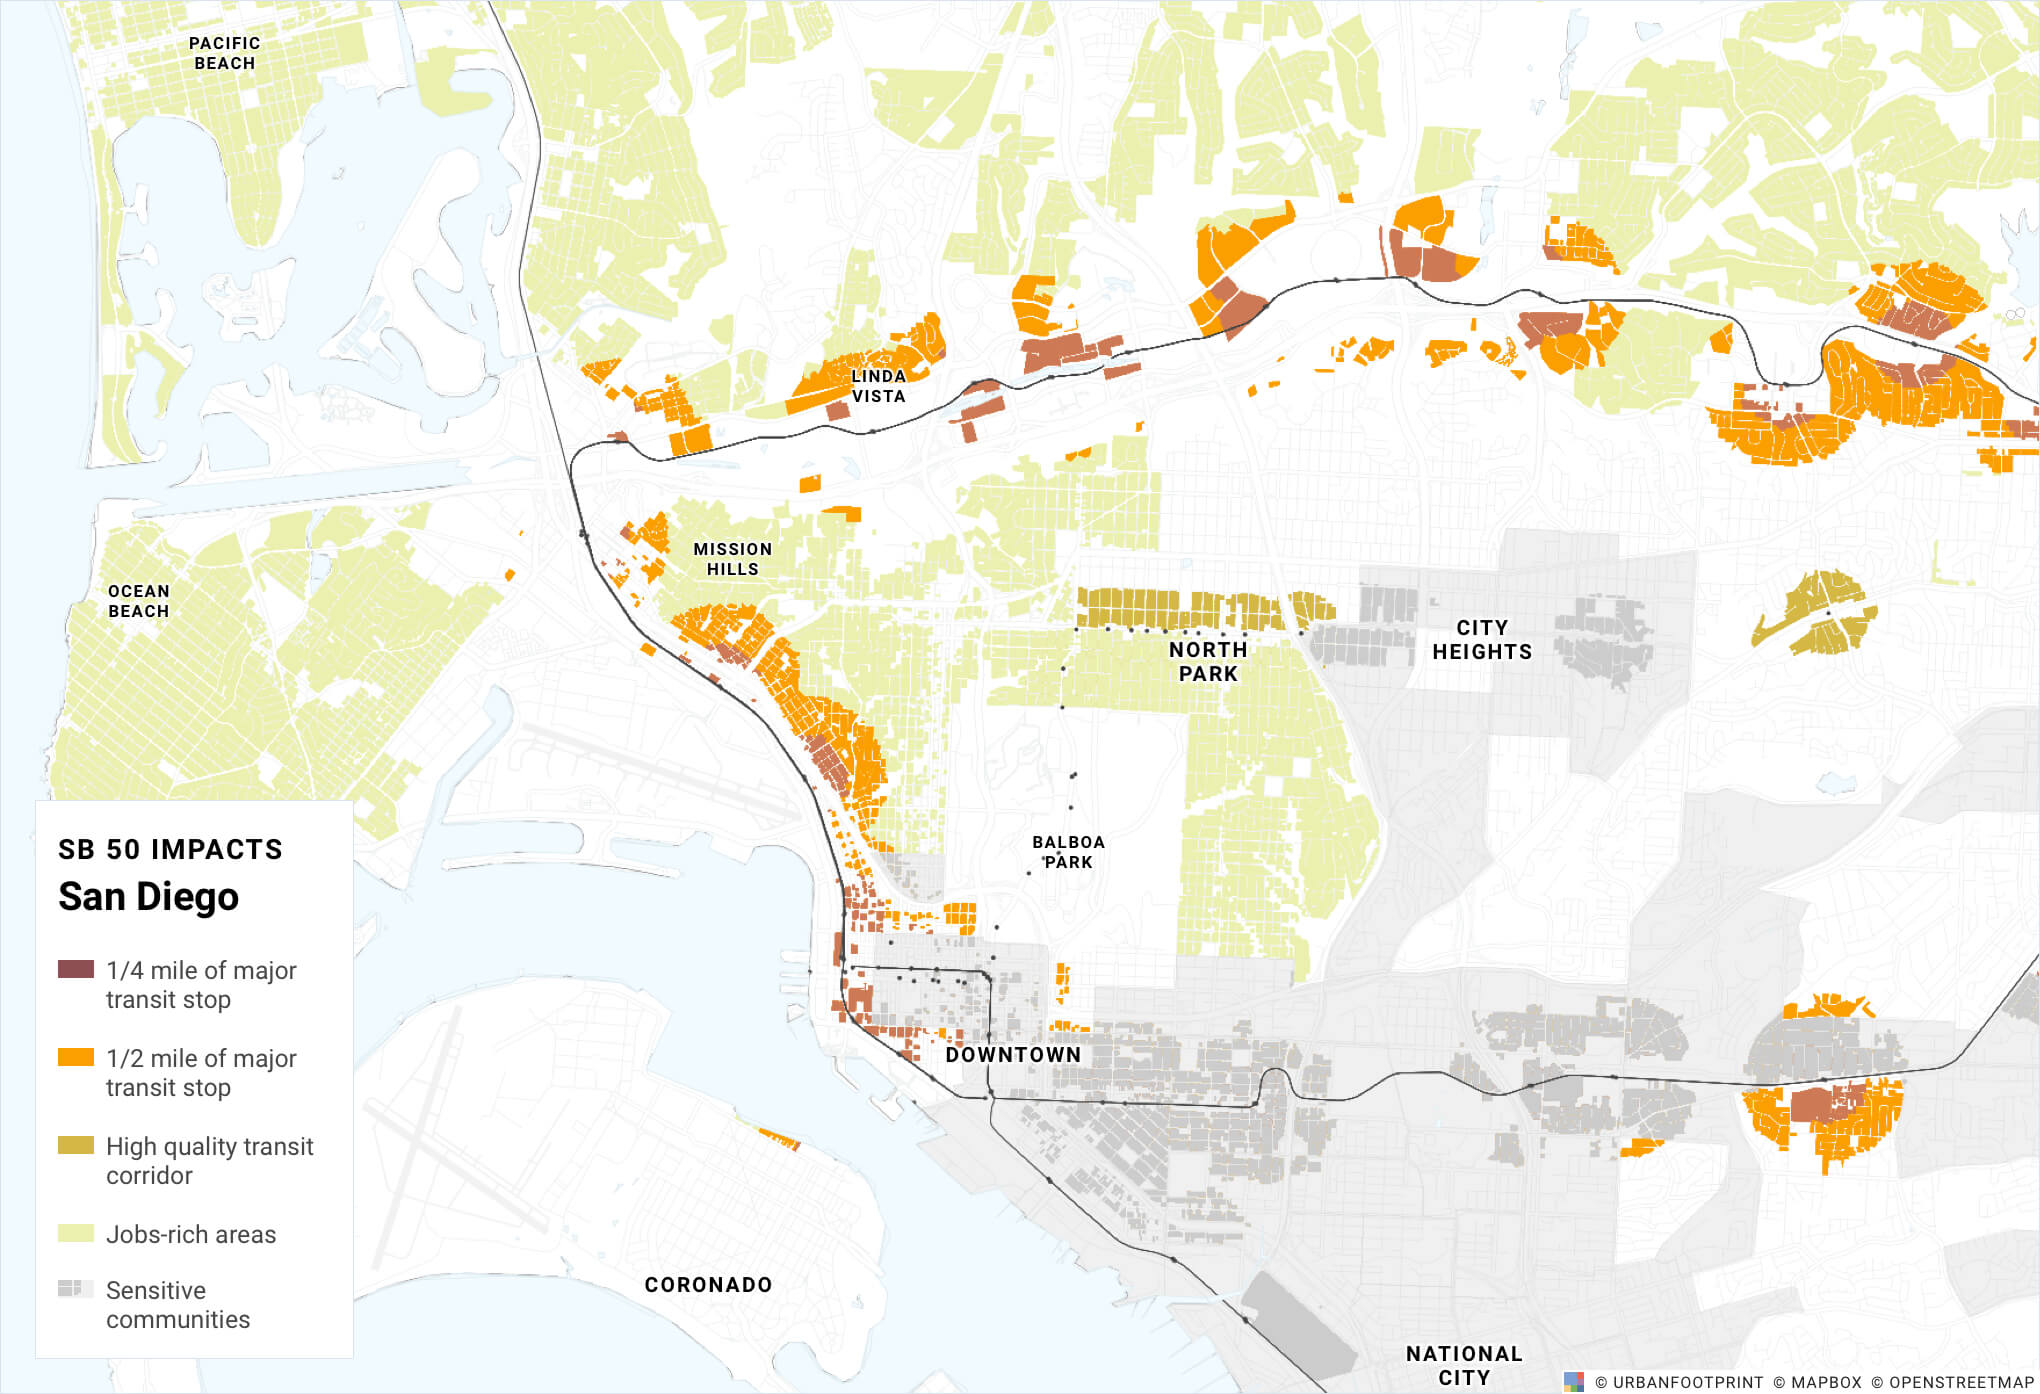
San Francisco, Santa Clara, San Diego, and Los Angeles counties have relatively equal amounts of land impacted by rail and ferry-based upzoning.
After accounting for sensitive communities and hazard areas, we found that these four counties each have between 5,000 and 6,500 acres of land eligible for the four to five story upzoning in SB50. This suggests that SB 50 is fairly evenly distributed in its impact across the major metropolitan areas of the state.
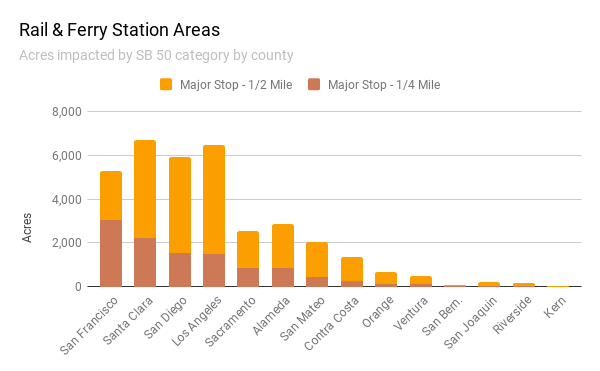
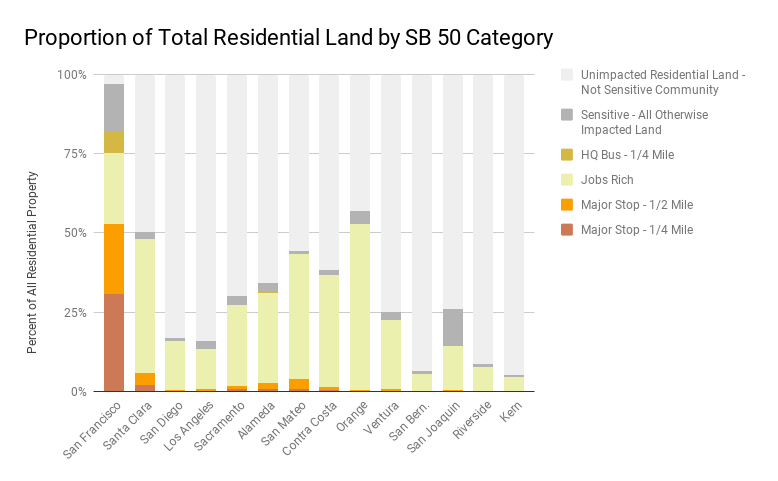
However, if we consider the land impacted as a proportion of overall residential land in each county, San Francisco sees the greatest impact by far with over 75% of all residential land in the city eligible under provisions in the bill.
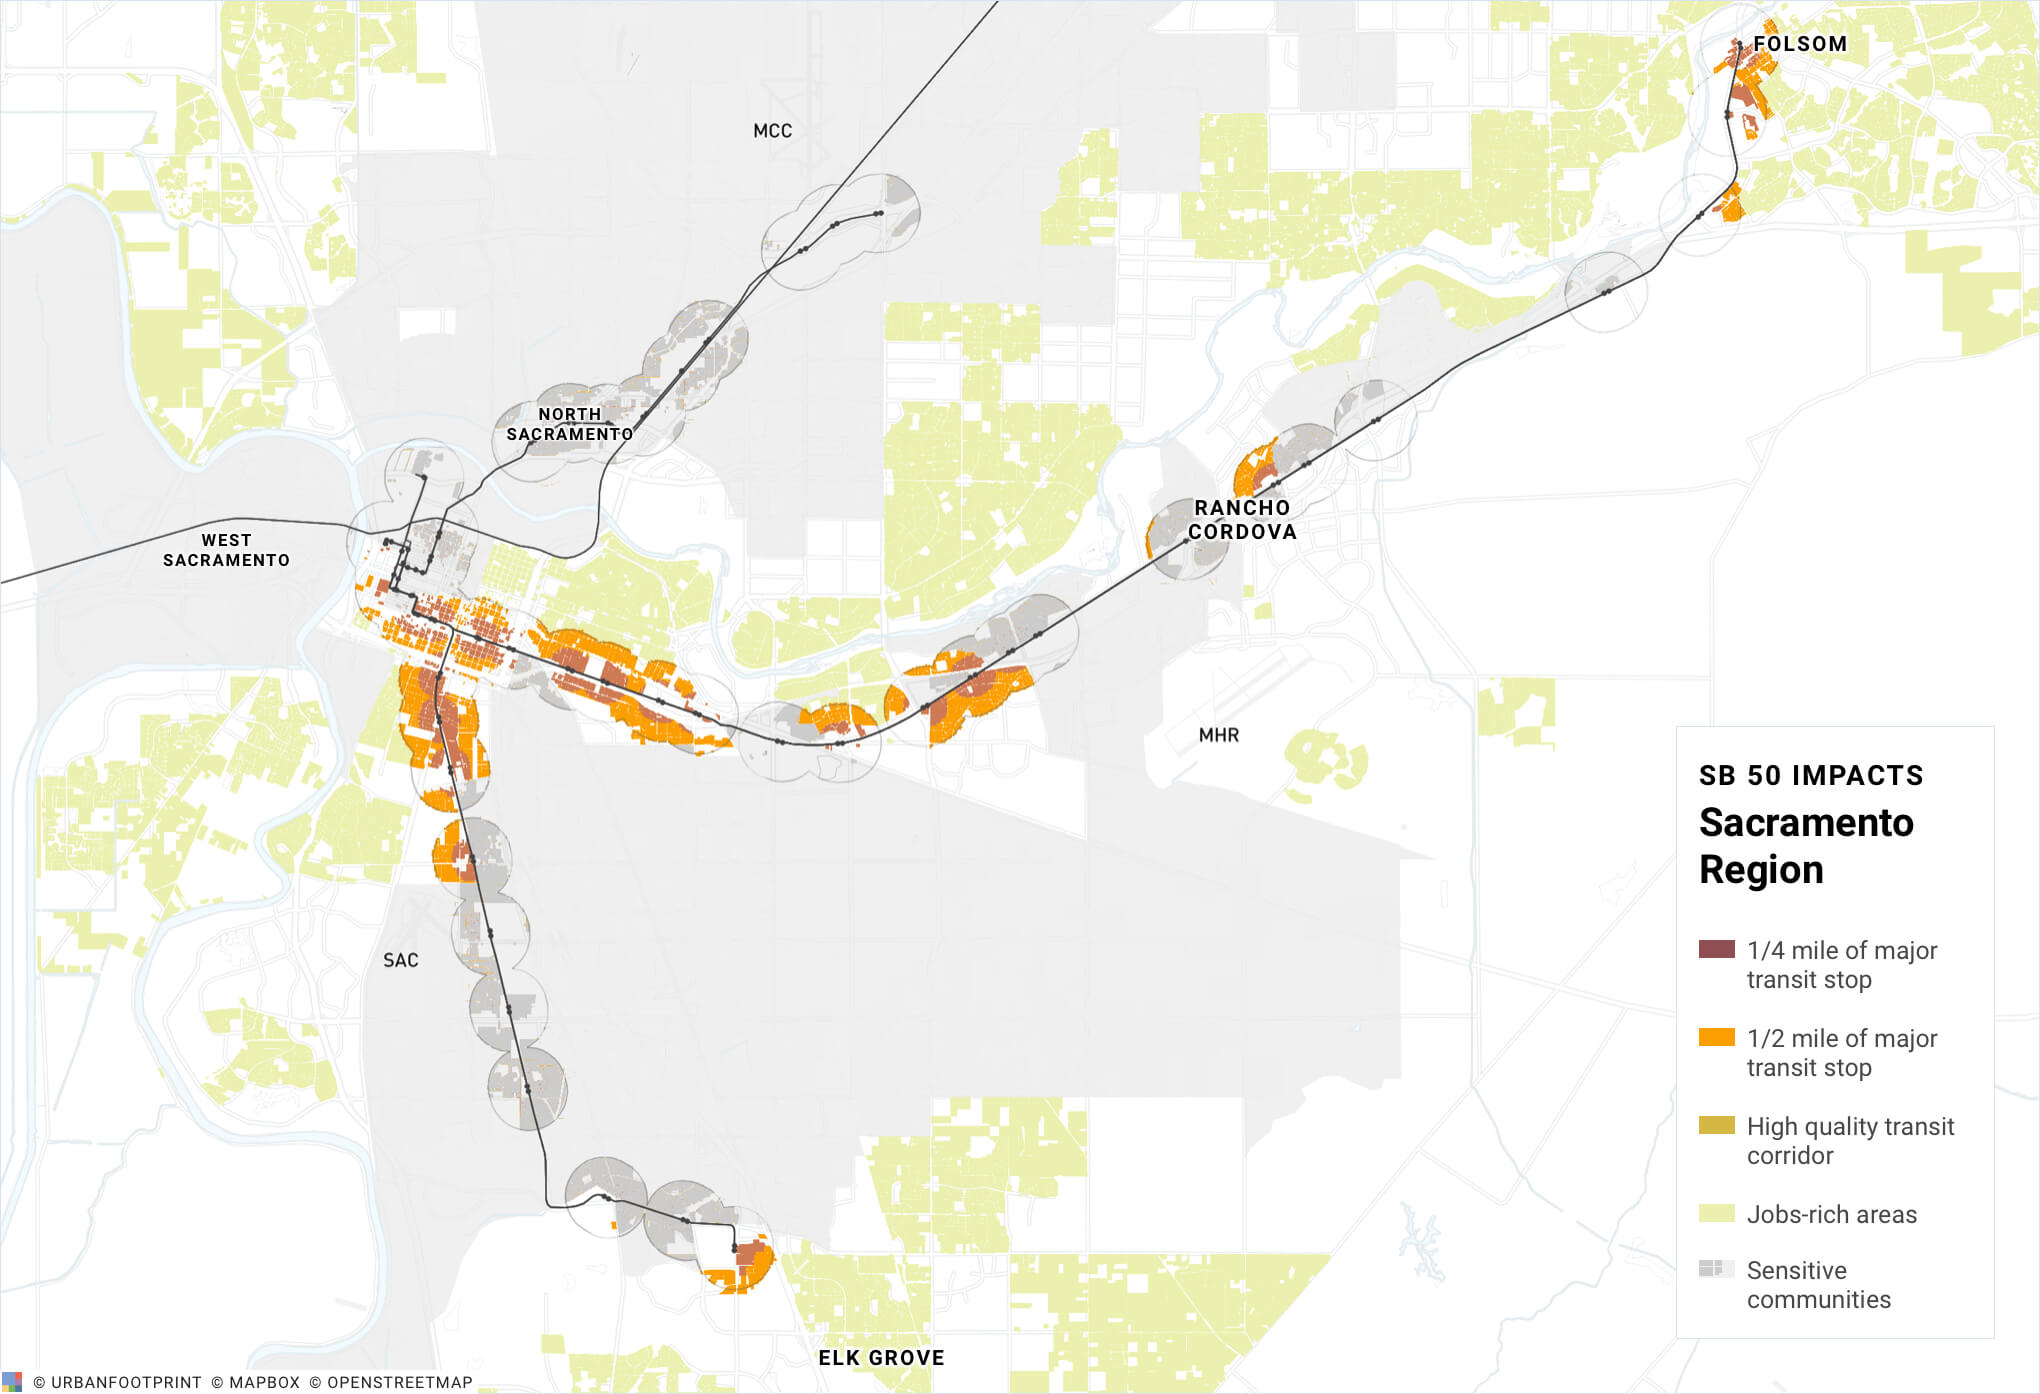
The maps below show the impacted areas for each major metropolitan region.
Ready to Learn More? Dive into the Details of the SB 50 Debate
Stay tuned as the SB 50 debate unfolds. We’ll be following up with detailed instructions on all the steps you need to take to mimic our analysis. We also plan to continue our analysis and unpack the potential impacts of the bill on factors like the tenant occupancy provisions, as well as the possible change to single family zoning statewide.
Have a question? Interested in learning more about this analysis? We’d love to hear from you. Send us a note or schedule a demo with our team. We’ll share how UrbanFootprint can help you further examine SB 50 in California and support so many of your other planning, mapping, and analysis needs.
—
Appendix: Assumptions for the Analysis
There are a few caveats to this analysis that are worth mentioning.
- This analysis is based on existing land use, not zoning. The bill specifies land that is zoned for residential use is eligible. While most land that currently has residential use is zoned accordingly, there are variances where a land use predates a zoning change.
- The area considered eligible in this analysis does not consider whether a property is currently tenant-occupied, or has been tenant-occupied in the past ten years.
- Weekend transit schedules were not considered in defining high quality bus corridors. The analysis also assumes the morning peak is from 7 to 10 AM, and the evening peak is from 4 to 7 PM. The language of the bill gives flexibility for the peak hour period to be considered whichever three hour period has the most frequent service from 6 to 10 AM and from 3 to 7 PM.
- The analysis included any parcel that intersected a defined transit or job rich area. It did not disqualify parcels that have less than 25% of parcel area within the buffer area as specified in the bill.
- Coastal zones and historic districts were not included in the analysis. It was assumed that these areas would have a minimal impact on the overall scale of impacted areas.
- As ‘Jobs-Rich’ is not yet officially defined in the bill, we chose to use the “high-opportunity + jobs-rich, long in-commutes, and/or jobs-housing mismatch” definition set in the Mapping Opportunities in California project. This definition in the bill specifies areas that are both ‘High Opportunity’ and ‘Job Rich’. High opportunity is intended to encompass areas with characteristics associated with positive education and economic outcomes for residents of all incomes. Jobs rich is specified as areas that are close to more jobs than typical for the region, and would enable shorter commutes for residents compared to current conditions.
—
Footnotes
- 1.“High Quality Bus Corridors” at the time of this post are defined as routes that have less than a 10-minute average headway for three consecutive hours during the morning peak, from 6 to 10 AM, and the evening peak, from 3 to 7 PM. These corridors must also maintain an average headway below 20 minutes over the course of a weekday from 6 AM to 10 PM and an average headway below 30 minutes on weekends.
- 2. This term refers to areas that are both “jobs-rich” and “high opportunity”. For the purpose of this analysis we use the “high-opportunity + jobs-rich, long in-commutes, and/or jobs-housing mismatch” definition set in the Mapping Opportunities in California project carried out by the Haas Institute for a Fair and Inclusive Society, the Urban Displacement Project, the Terner Center for Housing Innovation, and the California Housing Partnership. See here for more information on the project: http://mappingopportunityca.org.
- 3. Note that we are not assessing this provision in our current analysis.
- 4.California Tax Credit Allocation Committee (TCAC) Opportunity Maps demonstrate spatial dynamics of opportunity for different neighborhoods and regions of the state. All areas in the state are designated either ‘High Segregation & Poverty’, ‘Low Resource’, ‘Moderate Resource’, ‘High Resource’, or ‘Highest Resource’. See here for more information: https://www.treasurer.ca.gov/ctcac/opportunity.asp
- 5.CalEnviroScreen is a screening dataset that was designed to identify communities disproportionately impacted by various sources of pollution and with population characteristics that make them particularly vulnerable to pollution. The top 25th percentile of scores in the dataset represent regions that are most burdened across the state. See here for more information: https://oehha.ca.gov/calenviroscreen/report/calenviroscreen-30
- 6.Refers to regions particularly at risk of wildfire based on CALFIRE’s Fire Hazard Severity Zones. See here for more information: https://www.fire.ca.gov/fire_prevention/fire_prevention_wildland_zones
