


If you’re interested in creating a project like this, let us know!
Can we solve our housing crisis and increase mobility through infill and next generation technology? As a case study, we evaluate the housing potential along El Camino Real, the 45-mile roadway through the heart of Silicon Valley, and examine the potential of next generation transit. We dig deep into the costs and benefits of infill housing, revealing critical energy, water, transportation, and cost challenges. We also looked at how new innovations in transit and mobility, such as Autonomous Rapid Transit (ART) technology, can support new growth along El Camino and countless corridors like it across the country.We discovered that 250,000 new dwellings are possible on the low density commercial land lining the boulevard and that enhancing a typical BRT system with Autonomous Buses can reduce operation costs by 48% and increase average speeds by 27%. This technology could trigger a revolution in TOD planning, catalyzing infill while spreading a new form of transit that is more affordable and more attractive to riders.
Across California, from the halls of the Sacramento capitol to city council meetings to community group discussions, the subject of housing cost is front and center. And nowhere is this issue felt more acutely than the San Francisco Bay area, a region that has added 11 jobs for every one home since 2010. This extreme mismatch in jobs and housing growth has seen the median home price in the Bay Area rise to $934,000, with San Francisco at $1.4 million and Silicon Valley enclave Palo Alto at a staggering $3.1 million. Rents in San Francisco have risen more than 60% since 2012.
In an effort to better understand how and where we can address California’s housing supply crisis, we used UrbanFootprint to explore the impacts of different approaches to new housing development. We aimed our sites within the heart of Silicon Valley, at one of its most critical arteries, El Camino Real, which extends nearly 45 miles from Daly City in the north to San Jose in the south, snaking past countless office parks, commercial strip centers and malls, and residential zones. There have been numerous efforts to enhance the corridor. Particular attention has been given to adding more housing to address critical needs – the most prominent being the Grand Boulevard Initiative. But thus far we have not seen a comprehensive study of what might be possible and feasible, especially in the context of new state policy initiatives focused on accelerating housing development – most notably Scott Weiner’s ill-fated SB 827. We wanted to narrow the information gap and insert some data-driven insight into the mix.
El Camino Today
While El Camino changes in character as it winds up and down the peninsula, it is mostly suburban in nature throughout its length. The area within a half mile of the corridor is lined by more than 2,000 acres of relatively low intensity commercial development and nearly 100,000 office jobs.
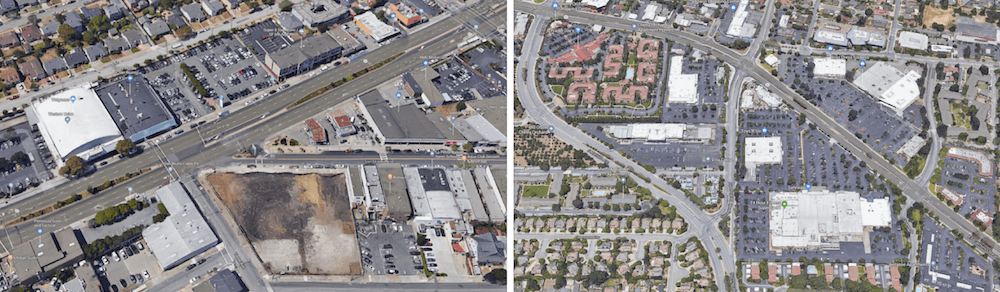
It is currently home to more than 55,000 single family residences and another 90,000 apartments and townhomes. BART rail extends from San Francisco to the north end of the corridor, and Caltrain commuter rail service runs along, or close, to most of the corridor. Valley Transportation Authority (VTA) light rail service touches the corridor in Mountain View, connecting to San Jose and other Santa Clara County job centers. Future High Speed Rail and other major transit service upgrades are slated to show up in the following years and decades.
How Much Housing Can the El Camino Corridor Accommodate?
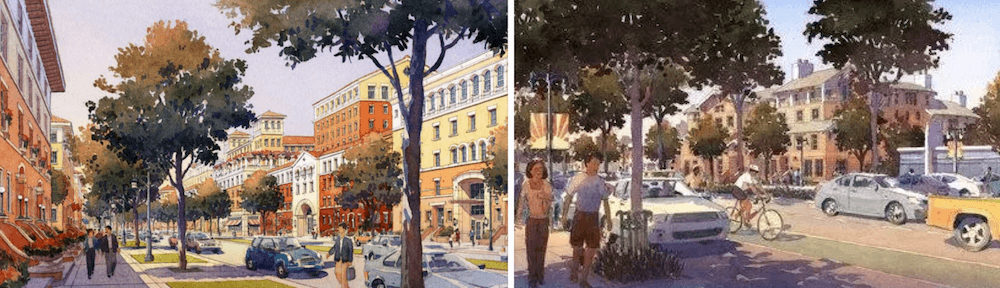
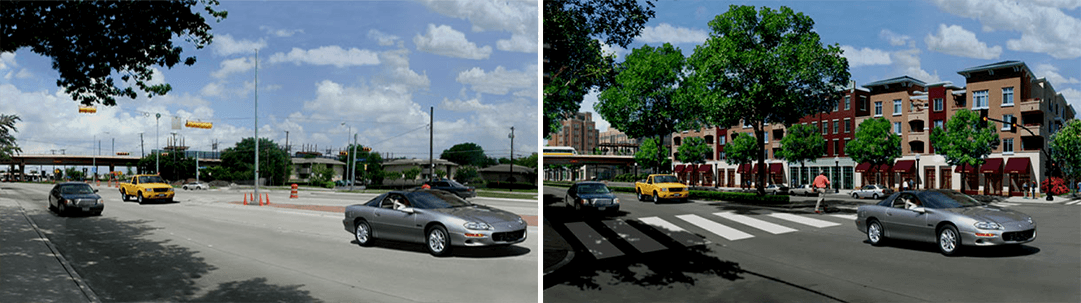
With all of this transportation infrastructure, low intensity commercial development, and the country’s highest home prices as the backdrop, we set out to explore how more housing could be accommodated on the El Camino corridor. What if single-use commercial strip development was replaced with mixed-use buildings and housing? How much housing could fit on the corridor in four story buildings? Five story buildings? What if we focused more intense development around rail stations? With UrbanFootprint, we built a range of scenarios to test such options.
We leveraged UrbanFootprint’s nationwide parcel and transit data to select parcels based on specific characteristics and find development opportunities within walking distance of major rail transit services like BART and Caltrain. We stayed away from redeveloping or upzoning major office developments on the corridor, instead focusing on how much more housing could be accommodated in existing low intensity commercial uses.
Three Proposed Scenarios
We settled on the following range of scenarios, with one taking on SB 827’s residential upzone focus and three others concentrating new housing and mixed-use development on commercial parcels:
#1 Transit-Focused Commercial Redevelopment with Low Rise: All low-intensity commercial parcels that are both within a half mile of a rail stop and within a half mile of El Camino Real converted to low-rise (about three to five story) mixed use (residential and retail) development.
#2 Transit-Focused Commercial Redevelopment with Low and Mid Rise: All low-intensity commercial parcels that are both within a quarter mile of a Caltrain stop and within a half mile of El Camino Real converted to mid-rise (about seven to eight story) mixed use development. Those within a half mile of a rail stop and within a half mile of El Camino Real converted to low-rise mixed use development.
#3 Corridor-Wide Commercial Redevelopment: All low-intensity commercial parcels within a half mile of El Camino Real are converted to low-rise mixed use development.
| Parcels Impacted | Acres Impacted | Total Housing Units | Additional Housing Units | |
|---|---|---|---|---|
| Existing Conditions | – | – | 146,000 | – |
| 1: Transit-Focused Commercial Redevelopment with Low Rise | 2,050 | 1,000 | 266,000 | 120,000 |
| 2: Transit-Focused Commercial Redevelopment with Low and Mid Rise | 2,050 | 1,000 | 302,500 | 156,500 |
| 3: Corridor-Wide Commercial Redevelopment | 3,750 | 2,100 | 395,900 | 249,900 |
As the summary chart shows, the scenarios vary in the number of parcels and land area they impact, ranging from 2,050 commercial parcels in the most transit-focused redevelopment, to 3,750 for the commercial redevelopment option that includes the El Camino corridor strip.
All of the scenarios net significant gains in housing. It is important to emphasize that all scenarios represent theoretical maximums and would only be realized if every parcel in each scenario were to be redeveloped. That said, even if just a portion of parcels redevelop over time, the impact on housing supply and, in turn, affordability would be substantial. The varying approaches in each of the scenarios underscore that there are a number of different approaches to accommodating increased housing along the length of El Camino.
Total Housing by Type
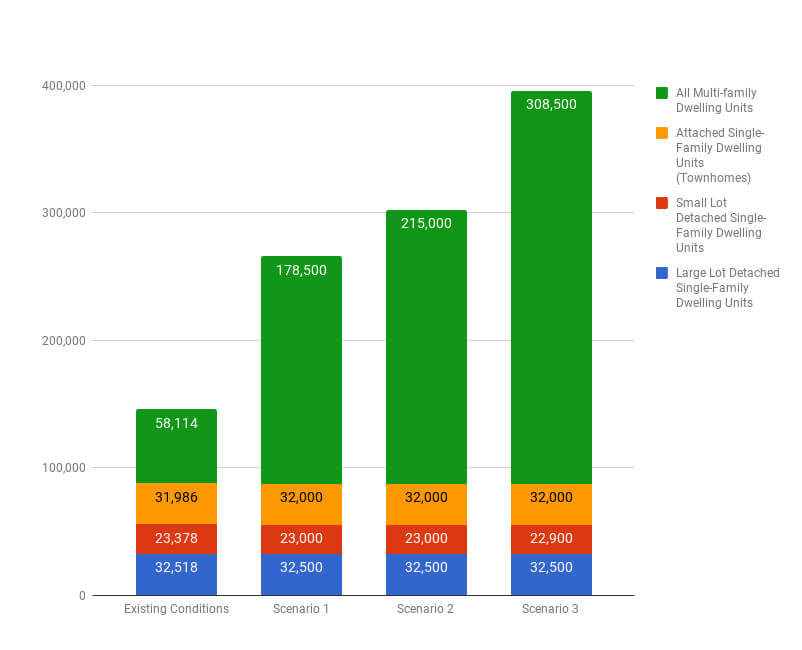
Cities can focus on lower-intensity commercial parcels and leave residential parcels off the table; take on residential upzoning as suggested by SB 827; or combine various approaches where appropriate. Some cities are already taking on some of these tactics, through programs like the the Grand Boulevard Initiative, city General Plan updates, and new developments. Our study looks at the impact of such activities across the entire length of the corridor, highlighting the importance of El Camino and suburban corridors like it in addressing housing and other challenges in the Bay Area, California, and the across the United States.
New Mobility Options to Support Housing Growth
The El Camino housing scenarios outlined here need more and better mobility options than exist on the corridor today. Mobility is undergoing rapid changes, as transportation network companies (TNCs) like Lyft and Uber, and other shared modes, like bikes and scooters, vie to fill gaps in the traditional auto and transit options. The problem with many of these strategies using autonomous technology is that they ultimately will increase the amount of driven miles because of empty travel to and from destinations, longer commutes, and ultimately a dramatic increase in sprawl. Some studies show a 35% increase in Vehicle Miles Traveled (VMT) for private AV and up to a doubling of VMT for single occupant Uber-style service.
Less attention has been paid to how autonomous technology can transform transit service versus personal vehicles. While a variety of options such as Light Rail Transit (LRT) or Bus Rapid Transit (BRT) could serve to enhance transit service on El Camino, Autonomous Rapid Transit (ART) could fit particularly well into a corridor like El Camino and has the potential to provide more effective service at substantially lower cost than traditional options.
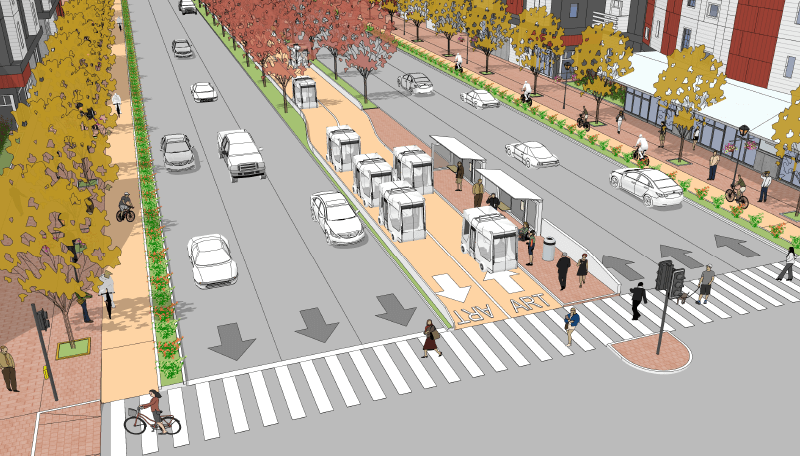
ART is the application of autonomous vehicle (AV) technology in small buses on dedicated transit lanes similar to those used in BRT systems. Such an approach is faster and less expensive than BRT and traditional bus systems. ART uses real time passenger trip requests and small vehicles to cluster origins and destinations so that riders skip most stops, decreasing travel time by up to 27%. It cuts operational costs in half compared to BRT. It reduces bus miles traveled and energy consumption by tailoring capacity by time and place to match demand, and can provide 24/7 service.
ART is easy to build in phases and, because of low construction and operation costs, can expand over time to create ubiquitous transit networks. Its corridors of mixed-use and walkable development have the potential to retrofit suburbs with local destinations and more varied housing opportunities as well as enhanced transit.
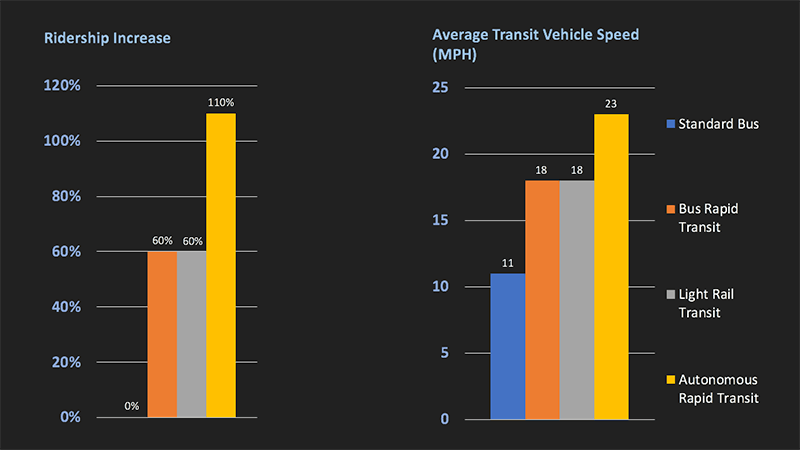
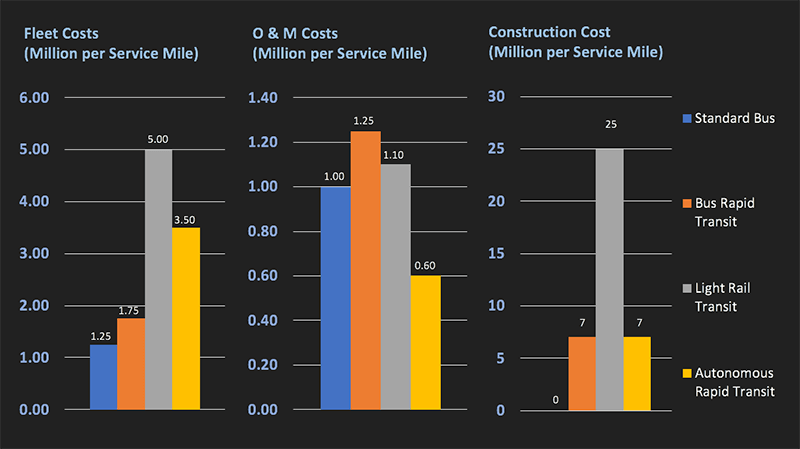
We worked with leading transportation experts Fehr & Peers to evaluate how an ART system would serve El Camino. ART generally outperforms other transit options on the corridor with higher average speeds than standard buses, BRT, and LRT. And in terms of transit value and performance per dollar spent, ART is the far and away winner, with far lower capital and operating costs than standard buses, BRT, or LRT.
| Transit Mode | Vehicle Type | Right of Way Type | Average Transit Vehicle Speed | Speed Increase¹ | Ridership Increase¹ | Construction Cost Per Mile | Fleet Cost Per Service Mile | O&M Cost Per Service Mile² |
|---|---|---|---|---|---|---|---|---|
| Standard Bus | 60-seat diesel-hybrid | mixed flow | 11 MPH | – | – | – | $1.25 million | $1.0 million |
| Bus Rapid Transit | 60-seat electric | dedicated lane | 18 MPH | 60% | 80% | $7 million | $1.75 million | $1.25 million |
| Light Rail Transit | 250-seat electric | dedicated lane | 18 MPH | 60% | 100% | $25 million | $5.0 million | $1.1 million |
| Autonomous Rapid Transit | mix of 4 and 20-seat electric | dedicated lane, skip-stop optimization, contraflow lane passing | 23 MPH | 110% | 130% | $7 million | $3.5 million | $600k |
Results of a study completed with Fehr & Peers to evaluate potential performance of a dedicated lane for an autonomous rapid transit system on El Camino. Sources: Grand Boulevard Multimodal Transportation Corridor Plan, 2010. El Camino Real Bus Rapid Transit Phasing Study, 2014. Fehr & Peers, 2018. ¹Compared to Standard Bus service. ²Operations and Maintenance costs.
Why Focus Development Along Strip Commercial Corridors Like El Camino?
El Camino and corridors like it have the potential to take a substantial dent out of the housing supply crisis in California. But what are the other impacts of placing more housing on such corridors, closer to job centers and transit networks? What if housing were built in other Bay Area locations, perhaps across the Bay in Alameda County where so many Silicon Valley workers commute from every day? We compared the impacts of an average Alameda County household with those in the El Camino housing scenarios and the differences are substantial.
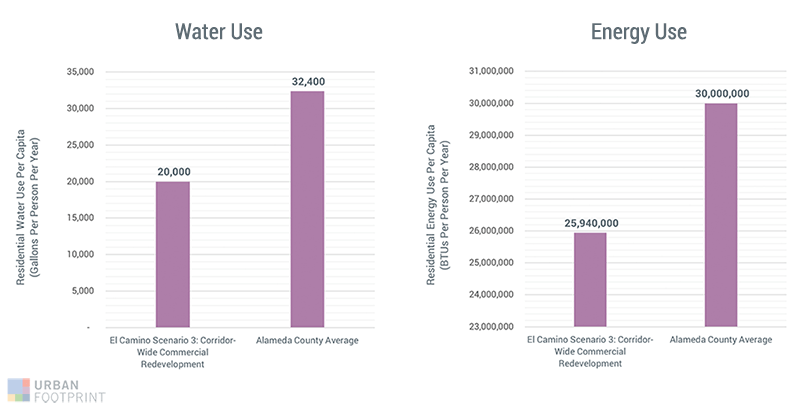
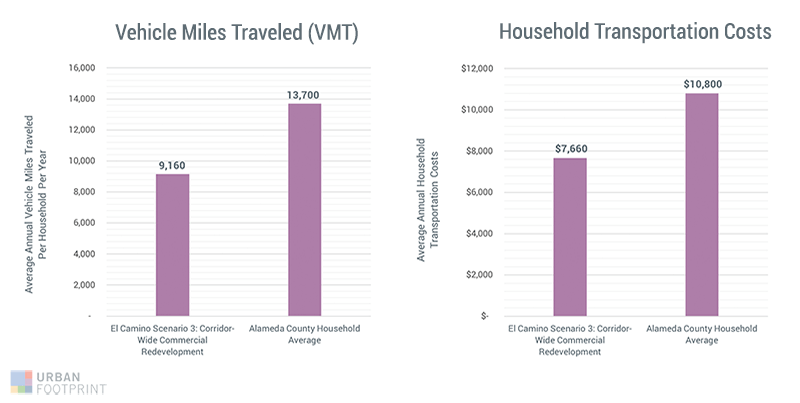
Compared to the average Alameda County household, households in El Camino Scenario 3 (Corridor-Wide Scenario Redevelopment):
- Consume nearly 40 percent less water per year, which adds up to 5.2 billion gallons, the water used by 70,000 Bay Area home per year.
- Use 13 percent less energy in their homes, adding up to the energy used by more than 25,000 homes in a year.
- Drive 33 percent fewer miles per year, equivalent to taking 93,000 cars off the road each year.
- Produce 45 percent less greenhouse gas emissions, which adds up to the equivalent of the emissions produced by 108,000 Bay Area households.
- Save $3,100 per year in transportation costs, which adds up to more than $730 million per year for all the households in Scenario 3.
Note that the vehicle miles traveled (VMT) reduction described here only considers current transit along El Camino, which includes local bus service, some CalTrain service, and one VTA Light Rail station. It does not incorporate future improvements to transit along the corridor, such as corridor-wide bus, rail, or even autonomous rapid transit options.
How Did We Build and Model the El Camino Scenarios?
Analyzing scenarios like the above serves to bracket possibilities and adds context and depth, which is all-too-often missing from community conversations and policy development. A study like this typically takes weeks or months, with most of the time spent collecting, cleaning, and preparing land use and transportation data across multiple jurisdictions. With UrbanFootprint, we were able to get the study going in just a few minutes.
First, we created a project by designating the work area. UrbanFootprint loads the corresponding, built-in parcel data and a host of other layers for all jurisdictions along the El Camino corridor.
Next, we used filters to understand what’s on the ground today, select parcels by type and location, and update them to another land use. We used UrbanFootprint’s many built-in building types and created a few of our own custom types for this study.
We created new scenarios to explore a range of options over the course of just a few hours.
We ran energy, water, transport, land consumption, and other analyses using UrbanFootprint’s built-in analysis modules.
Finally, UrbanFootprint’s dynamic reporting capabilities allowed us to track progress as we worked, comparing scenarios for their impact on energy use, water use, transit accessibility, emissions and other key indicators.
Have a question about this study or interested in exploring another initiative in your area? We’re looking to perform similar studies for more places in California and across the country. Tweet or email to let us know what you’d like to see next, or go ahead and dive into the data yourself: Check out a free trial of UrbanFootprint or sign up for a custom demo with our team to learn more.
Note: UrbanFootprint map images are supported by © Mapbox and © OpenStreetMap.
