


We’re excited to unveil a powerful upgrade to our web-based analysis toolkit for urban planning scenarios: the Analysis Assumptions Editor. UrbanFootprint users can now customize the platform’s built-in analysis modules to ask complex policy questions and enhance future scenario testing.
Read on to explore this brand new feature and more in our Spring 2019 release.
Introducing the Analysis Assumptions Editor
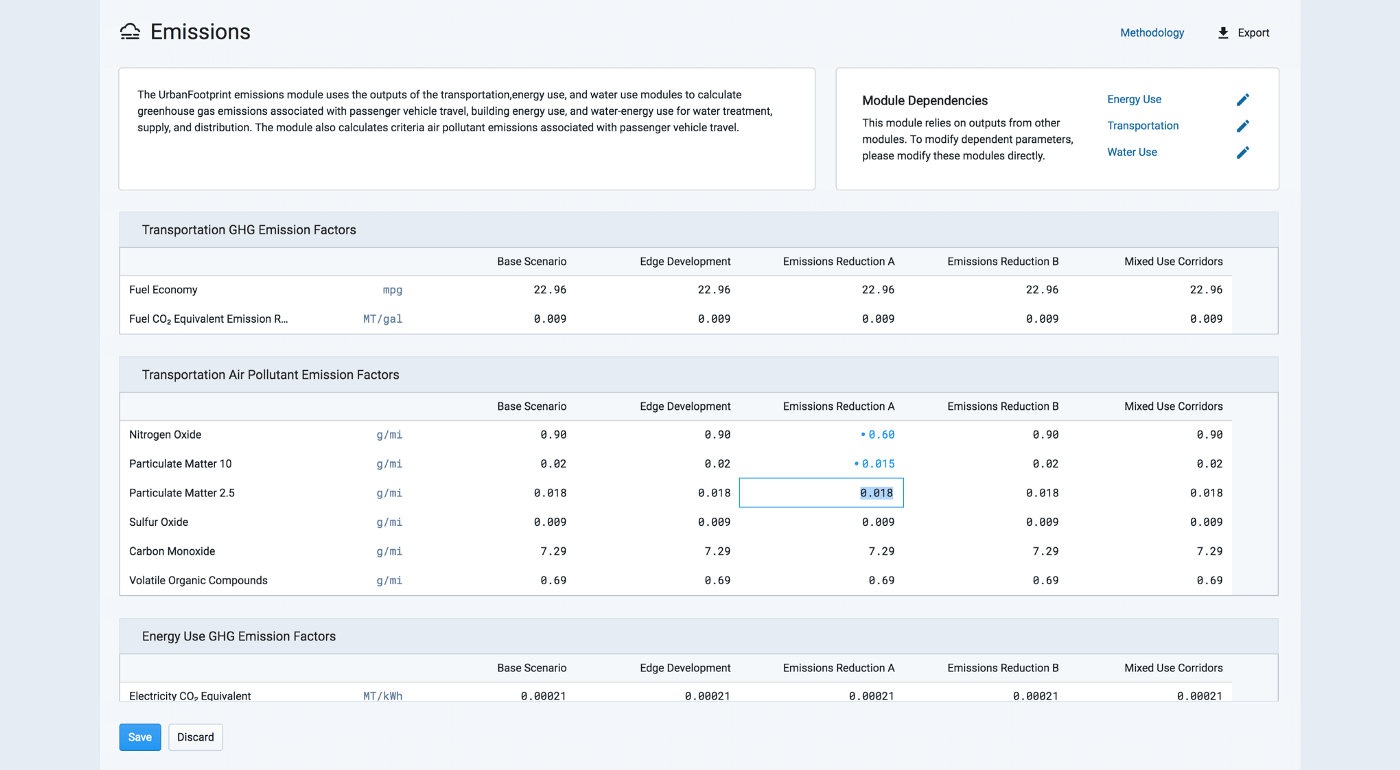
Scenario planning is one of UrbanFootprint’s most powerful features. In minutes, you can create a new land use scenario and run any of UrbanFootprint’s Analysis Modules to measure the effects of land use changes.
The Spring 2019 release includes an upgrade to UrbanFootprint’s scenario modeling capability: the ability to change the input assumptions in UrbanFootprint’s Analysis Modules. Now users may not only compare the impacts of their land use changes between scenarios, but they can also edit the assumptions used to analyze future land use scenarios.
For example, let’s say you’re working on a climate action plan and need to estimate emissions reductions based on several different energy consumption scenarios. Now you can quickly test alternative climate action scenarios by changing analysis details, like the residential and/or commercial building electricity use rates in UrbanFootprint’s Energy Use Module. Users may also update assumptions for factors like vehicle fuel economy to account for future changes to a community’s vehicle fleet.
Take advantage of this game-changing feature to customize assumptions in the following Analysis Modules: Land Consumption, Energy Use, Water Use, Walk Accessibility, Transit Accessibility, Transportation, Emissions, Household Cost, and Conservation.
Improved Process Notifications
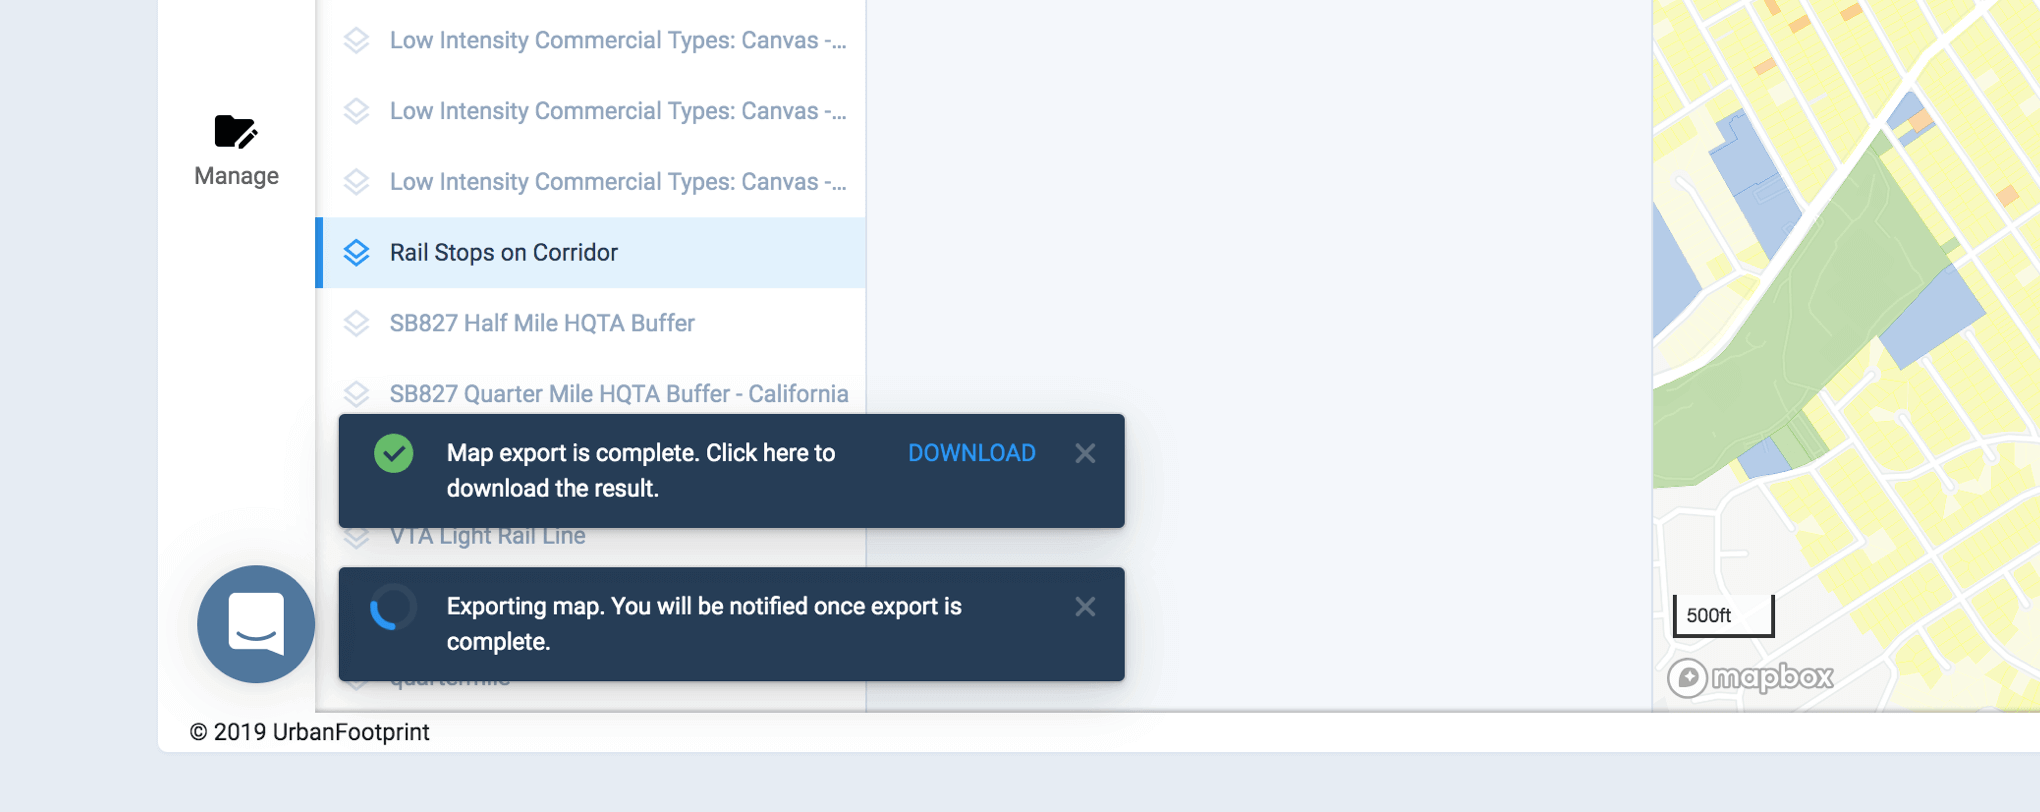
We’ve improved UrbanFootprint’s system messages to clarify what processes are running in the application. You’ll notice new and improved notifications that show UrbanFootprint creating a new project and rendering the new project’s base scenario. All system notifications, such as uploading and downloading layers, exporting maps, downloading the data table, etc. are more readable and include key actions when applicable (for example, an in-message link to download a layer you’ve just exported).
Enhanced Layer Manager UI
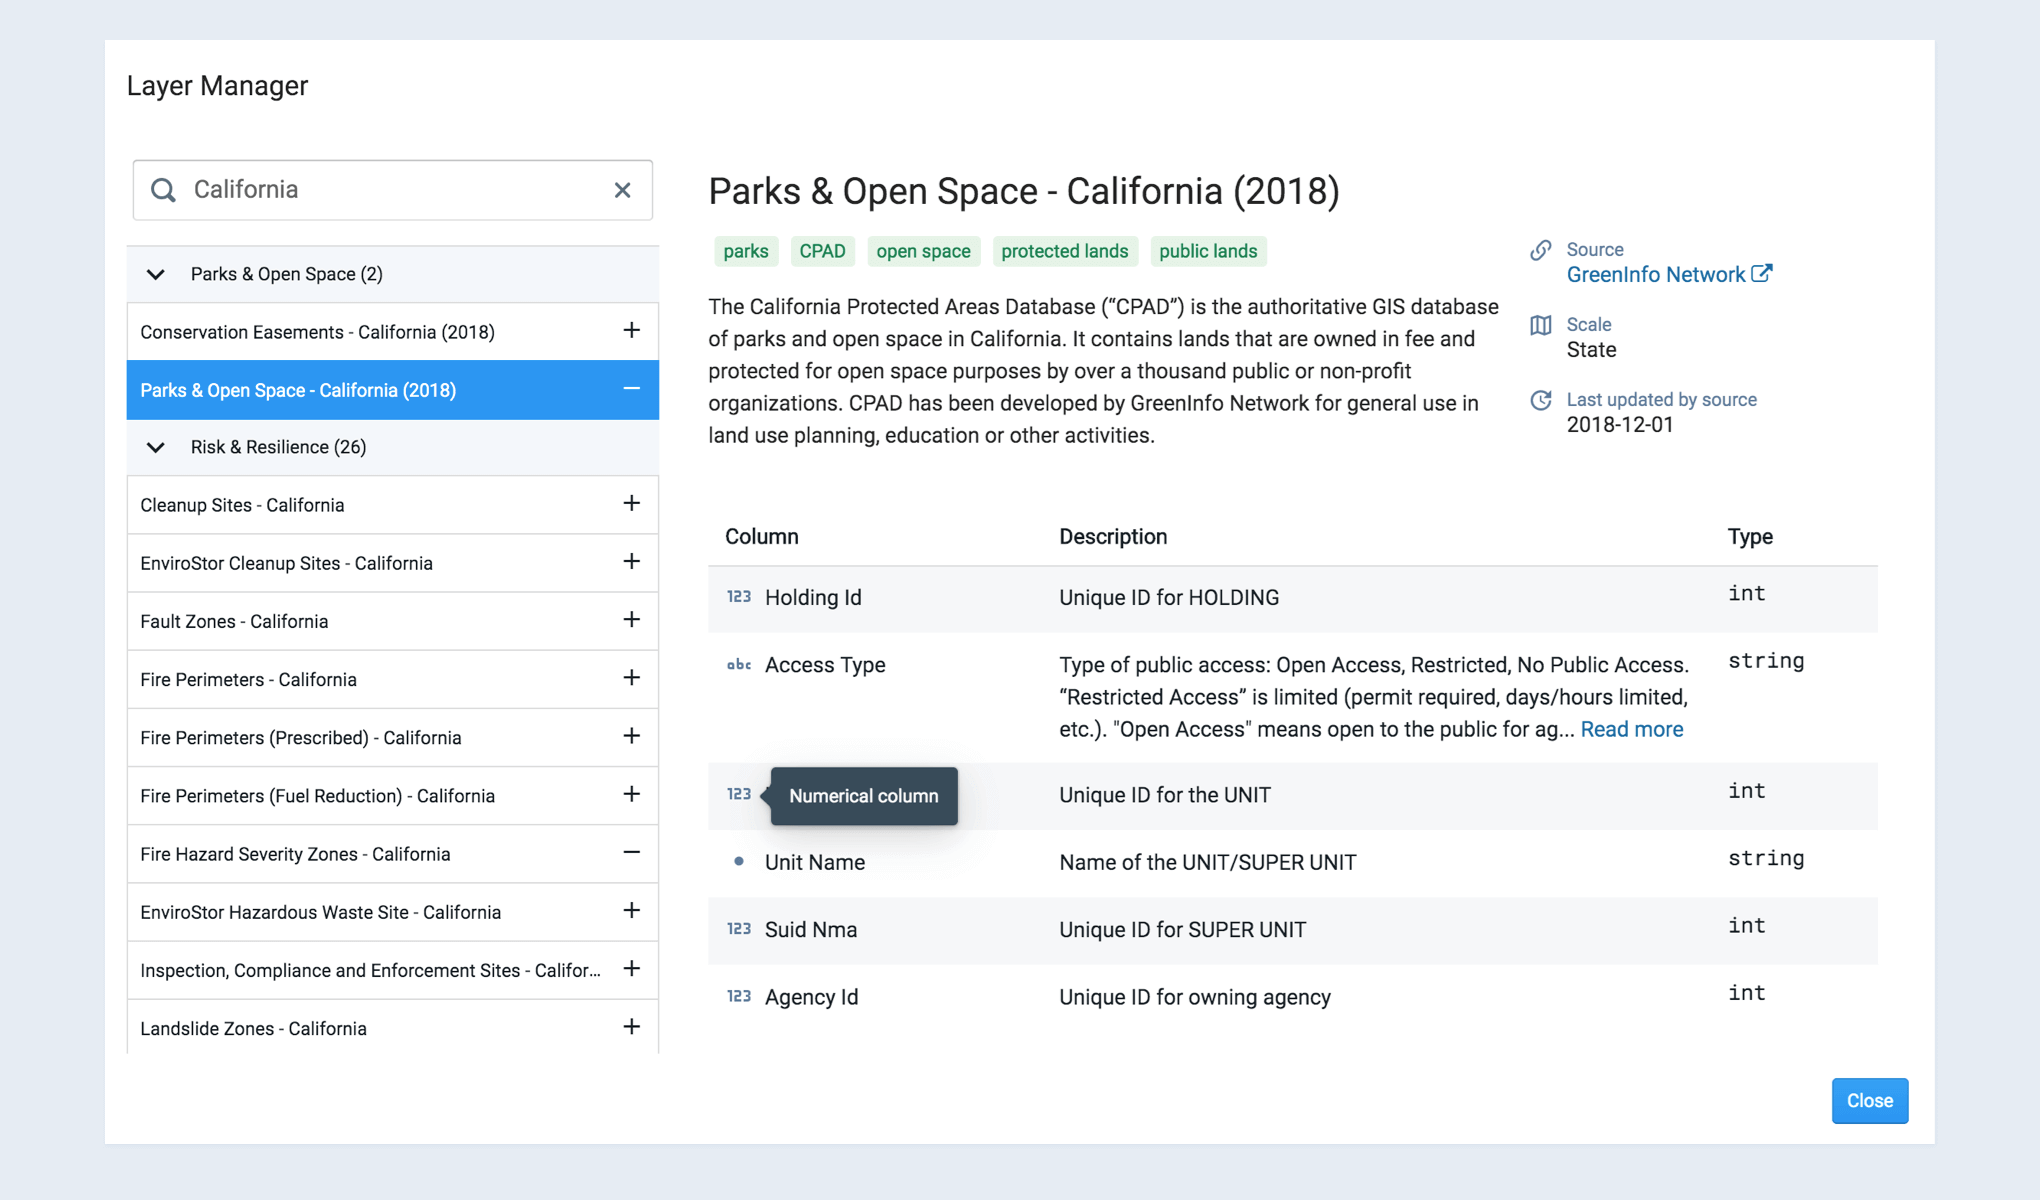
Adding layers to your maps is one of the most common activities in UrbanFootprint. We’ve improved the layer manager user interface to make it easier to view available information and add layers to your map. Updates include a larger dialog box, more readable summary information, a neatly organized table describing data columns, and more comprehensive documentation of data sources, geographic coverage, and when the data was last updated.
Updated Layer Details & New Data Table Toggle
This release also includes an easier way to view maps in UrbanFootprint. We added two new buttons that make it easy to toggle layer details in and out of the full map view. To show or hide the ‘Layer Details’ pane from your screen, simply click on the ‘Layer Details’ button. You can also show or hide the data table from your screen by clicking on the ‘Data Table’ button.
Expanded Data Library
We are constantly updating our data library. Major additions from last quarter include expanded and/or refreshed data for the following categories:
Socio Demographic
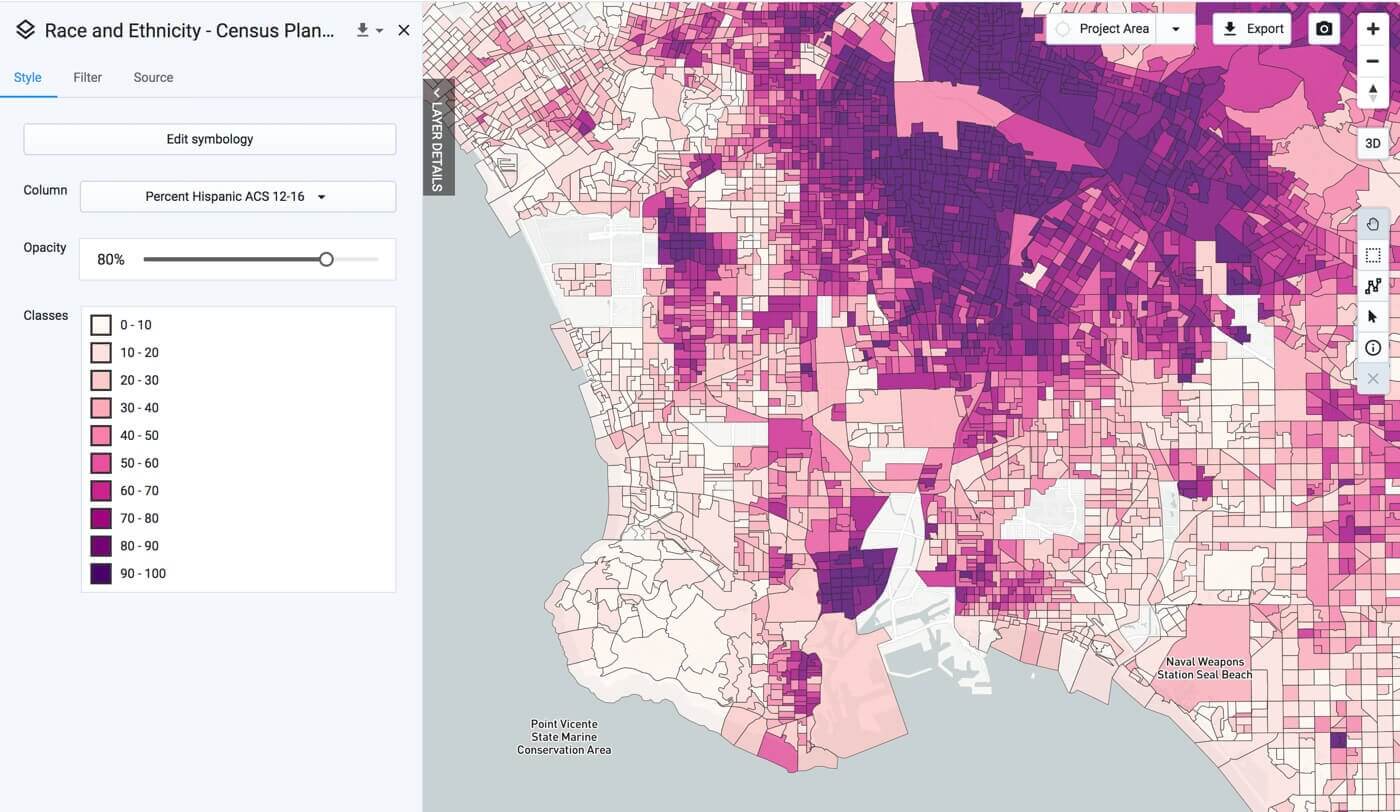
2018 Census Planning Data is now organized by theme for easier use. The updated census data layer themes include age, education, household characteristics, housing units, income, race and ethnicity, and sex.
Health

Access our expanded set of health datasets that include the latest nationwide nursing homes, urgent care facilities and more from Homeland Infrastructure Foundation-Level Data (HIFLD).
Infrastructure
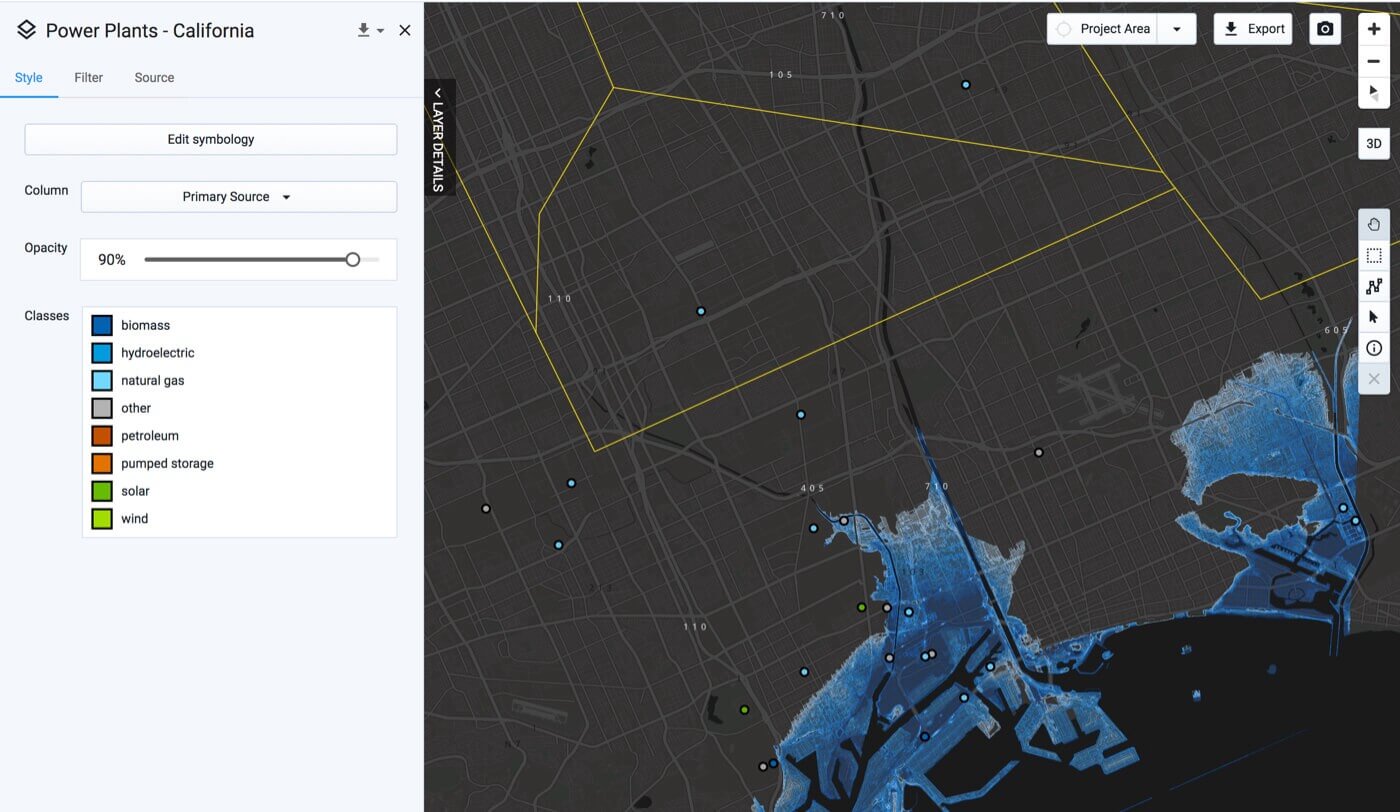
Get quick answers to important infrastructure questions with new power plant location data, updated electricity prices and power supply information, and more.
Education
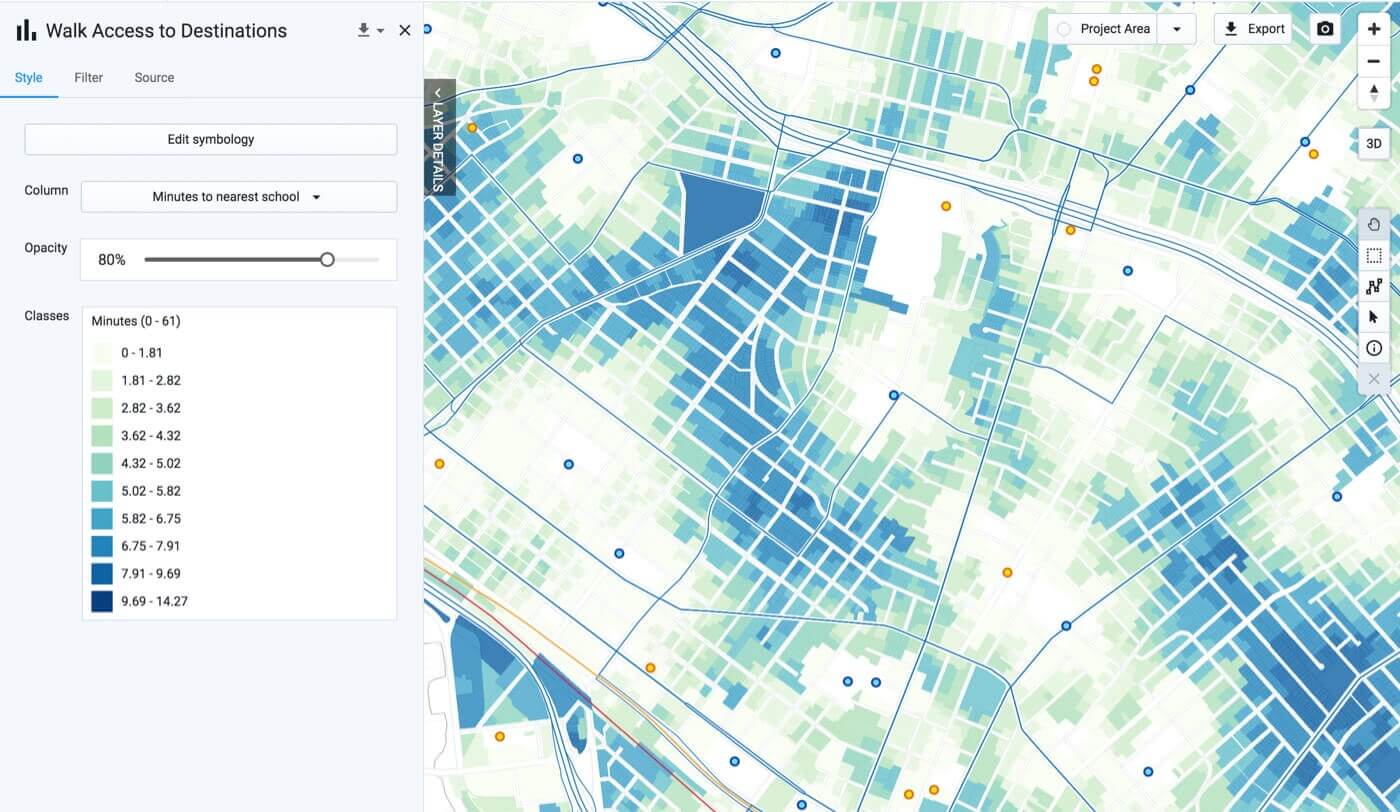
Access more detailed school information to better understand access to a wider variety of educational institutions, including private schools, day care centers, and supplemental colleges.
Parks & Open Spaces
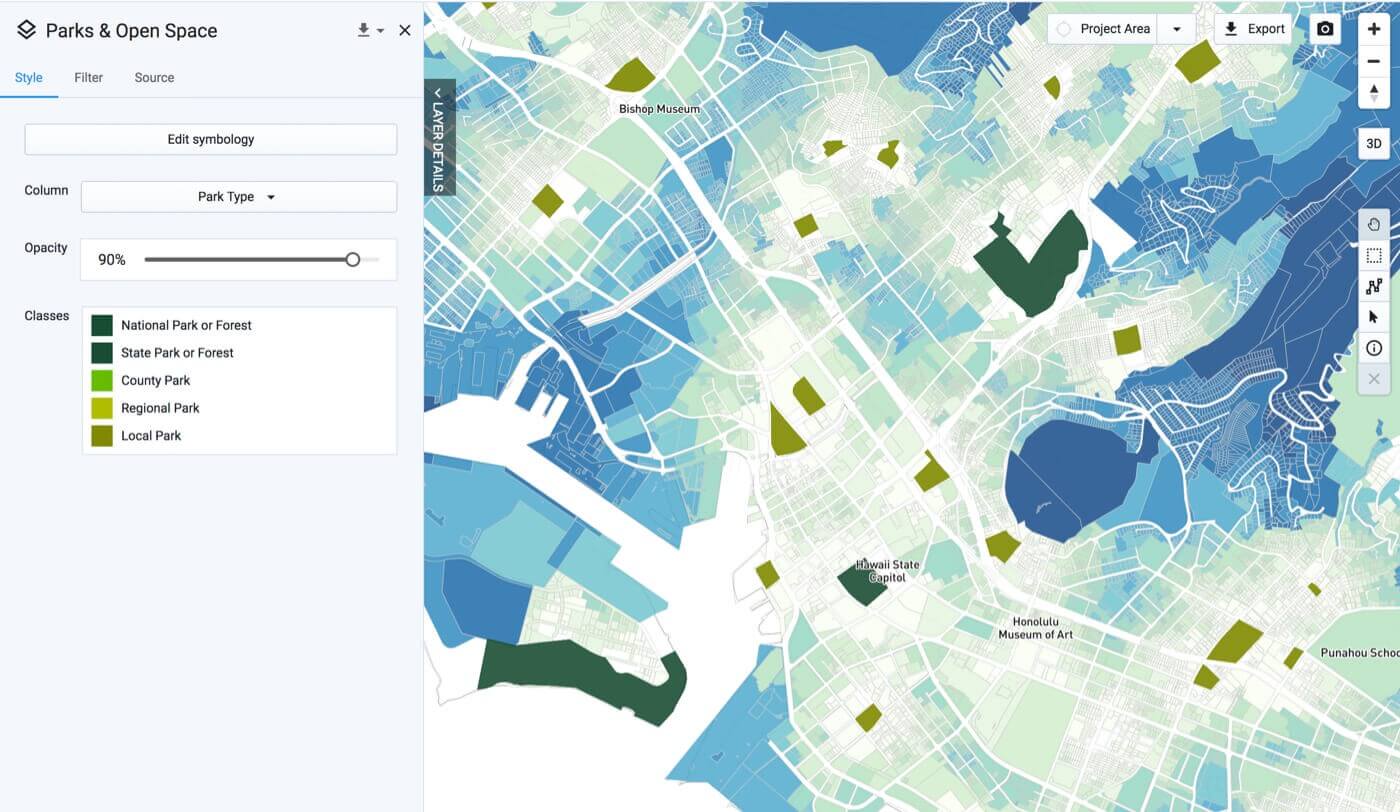
Explore updated parks and open space data for nearly any U.S. location.
California Risk & Resilience
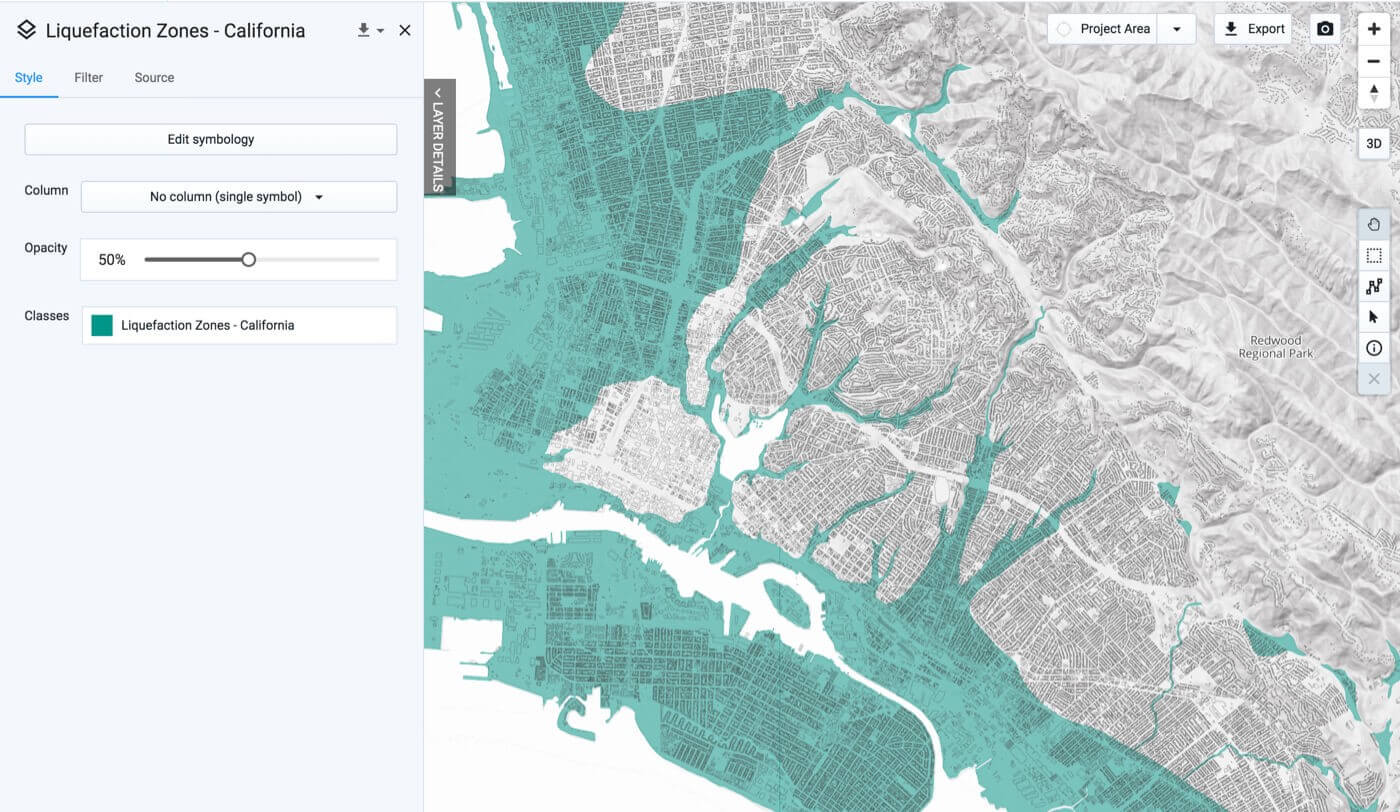
In addition to nationwide sea level rise, flood hazard zones, and fire hazard areas, newly available risk and resilience planning datasets for California include liquefaction, earthquake fault, and landslide zones.
See UrbanFootprint in Action
We hope you’re excited by the powerful new analysis features and usability enhancements in our Spring 2019 release. Ready to learn more? Watch our webinar on-demand or book a demo to see UrbanFootprint in action.
As always, if you have ideas for new features or improvements to UrbanFootprint, please send us an email with your thoughts!
