


If you’re interested in creating a project like this, let us know!
Hurricane season occurs June through November for the U.S. Gulf and East Coasts and the Hawaiian islands. Planners prepare for city resilience year round, but face a myriad of challenges in safeguarding their communities from the potential impacts of a hurricane storm surge. How can we better prepare our coastal communities for anticipated hurricanes? How do our zoning codes, transportation plans, and environmental sustainability goals impact our efforts to bolster city resilience?
In this post, we’ll explore how UrbanFootprint streamlines the risk and resilience data needed to answer these key questions, highlighting our new hurricane storm surge dataset.
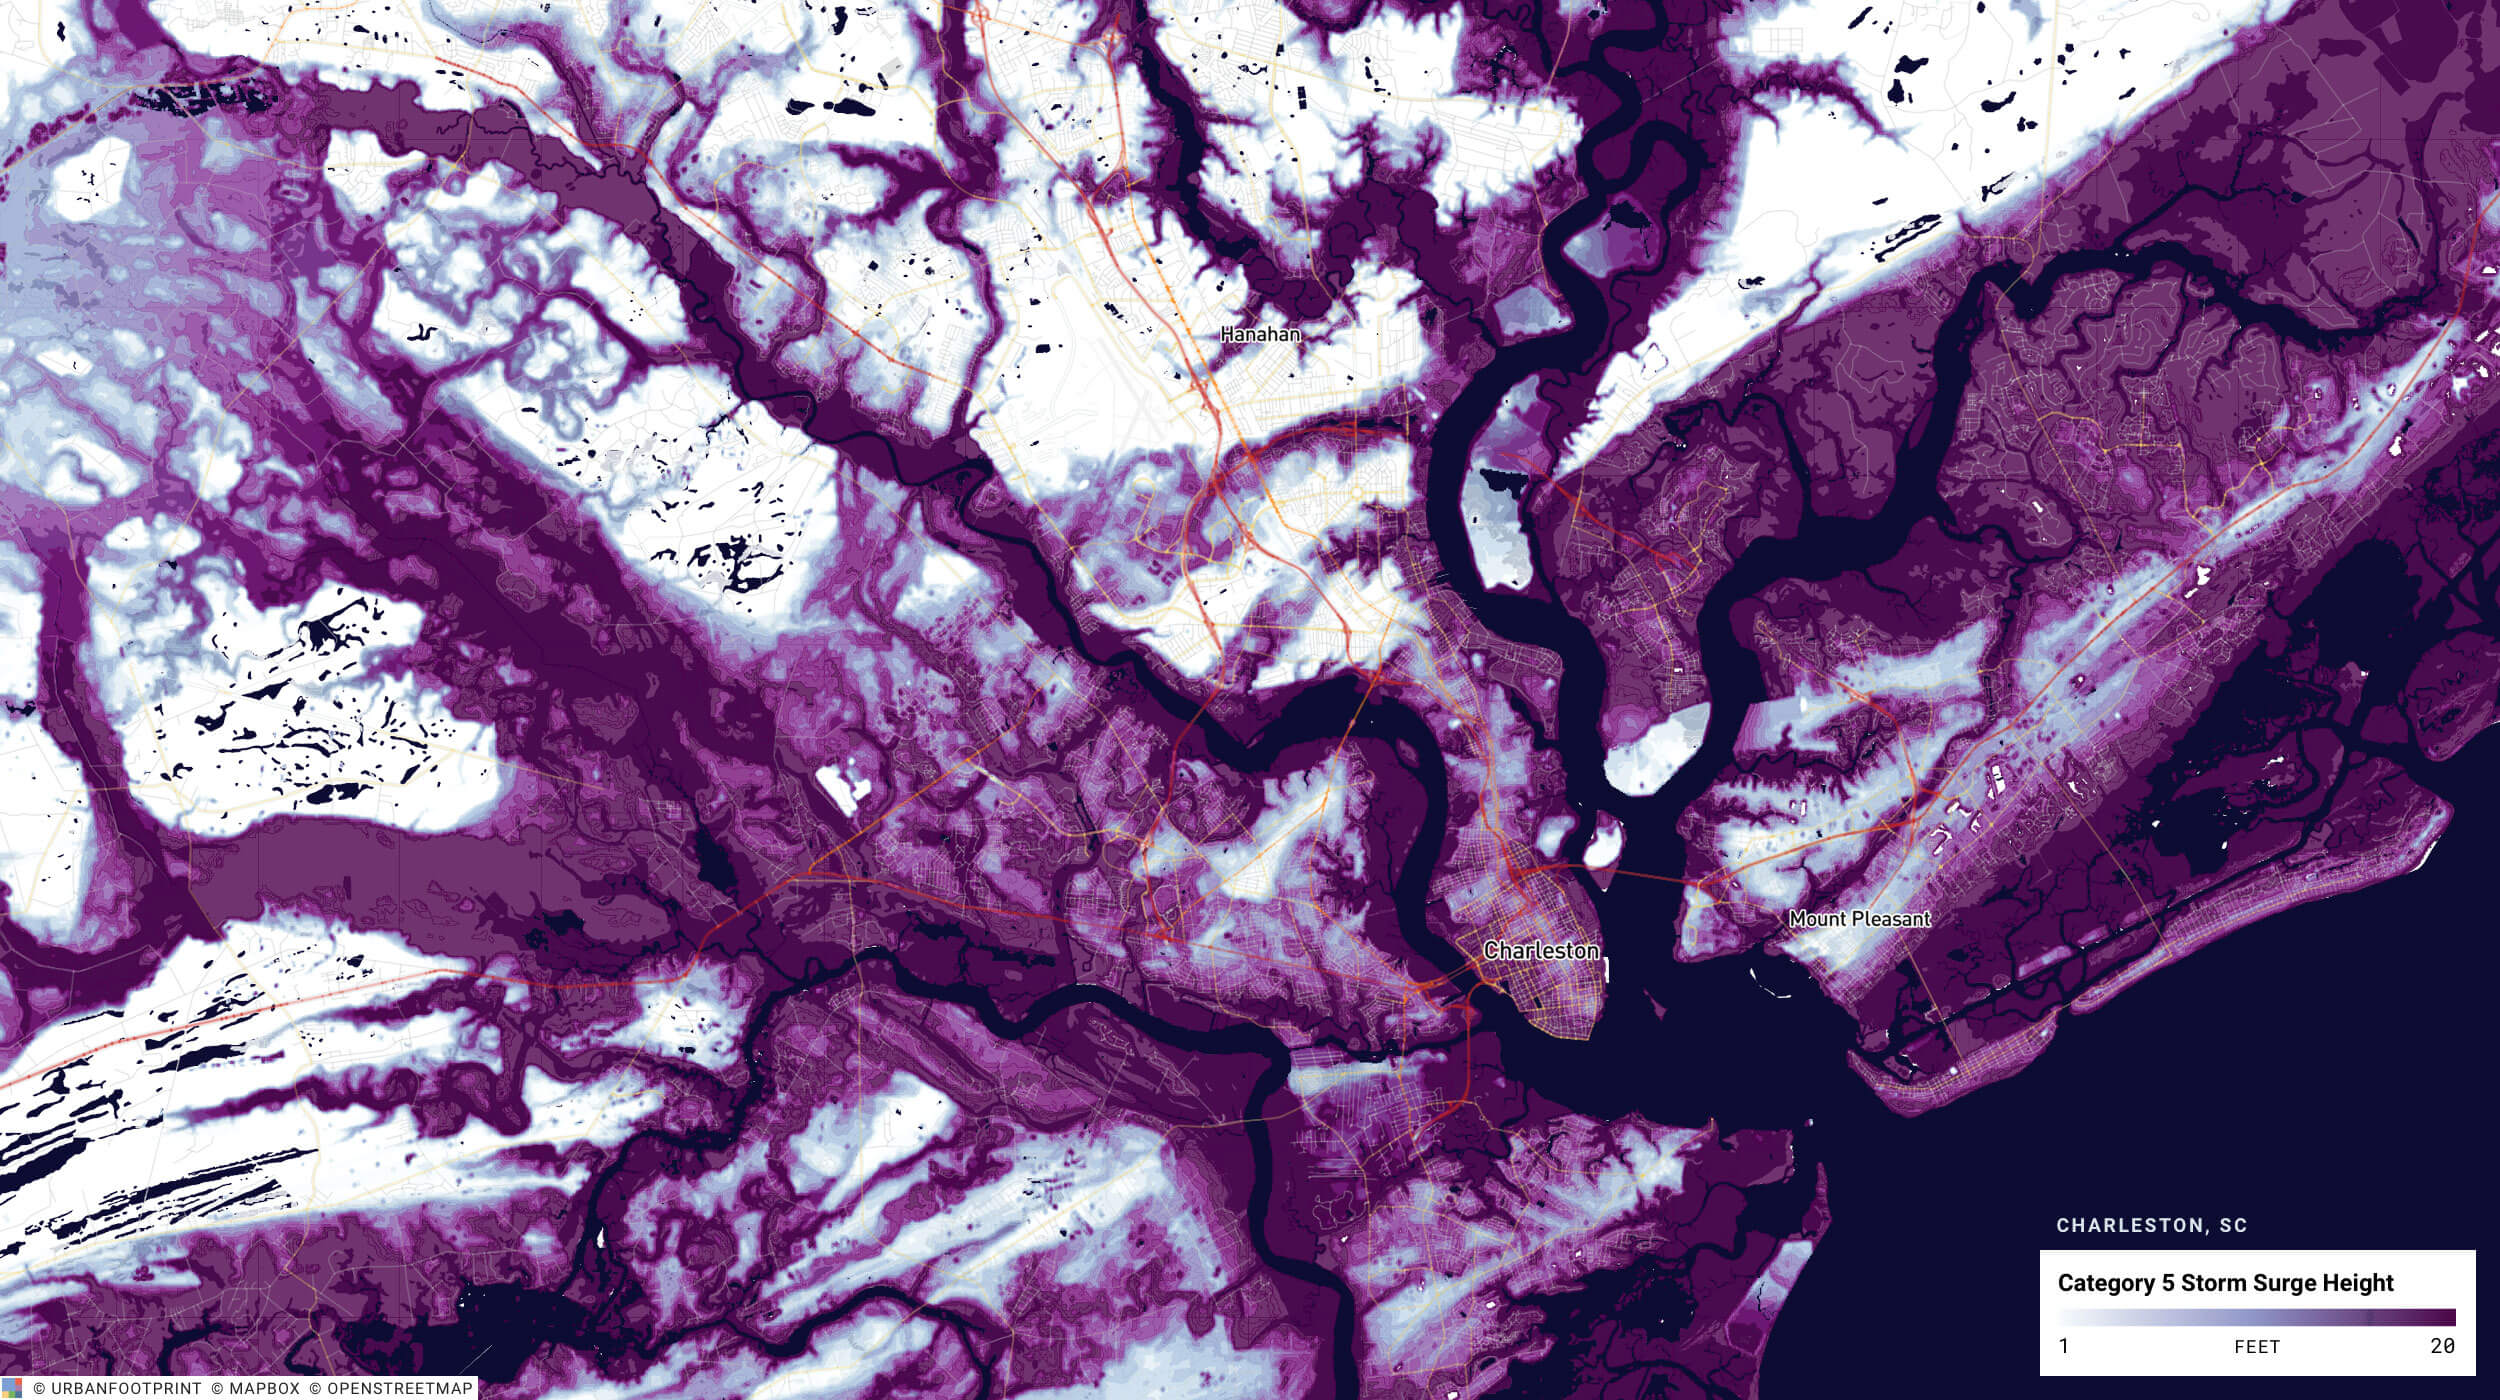
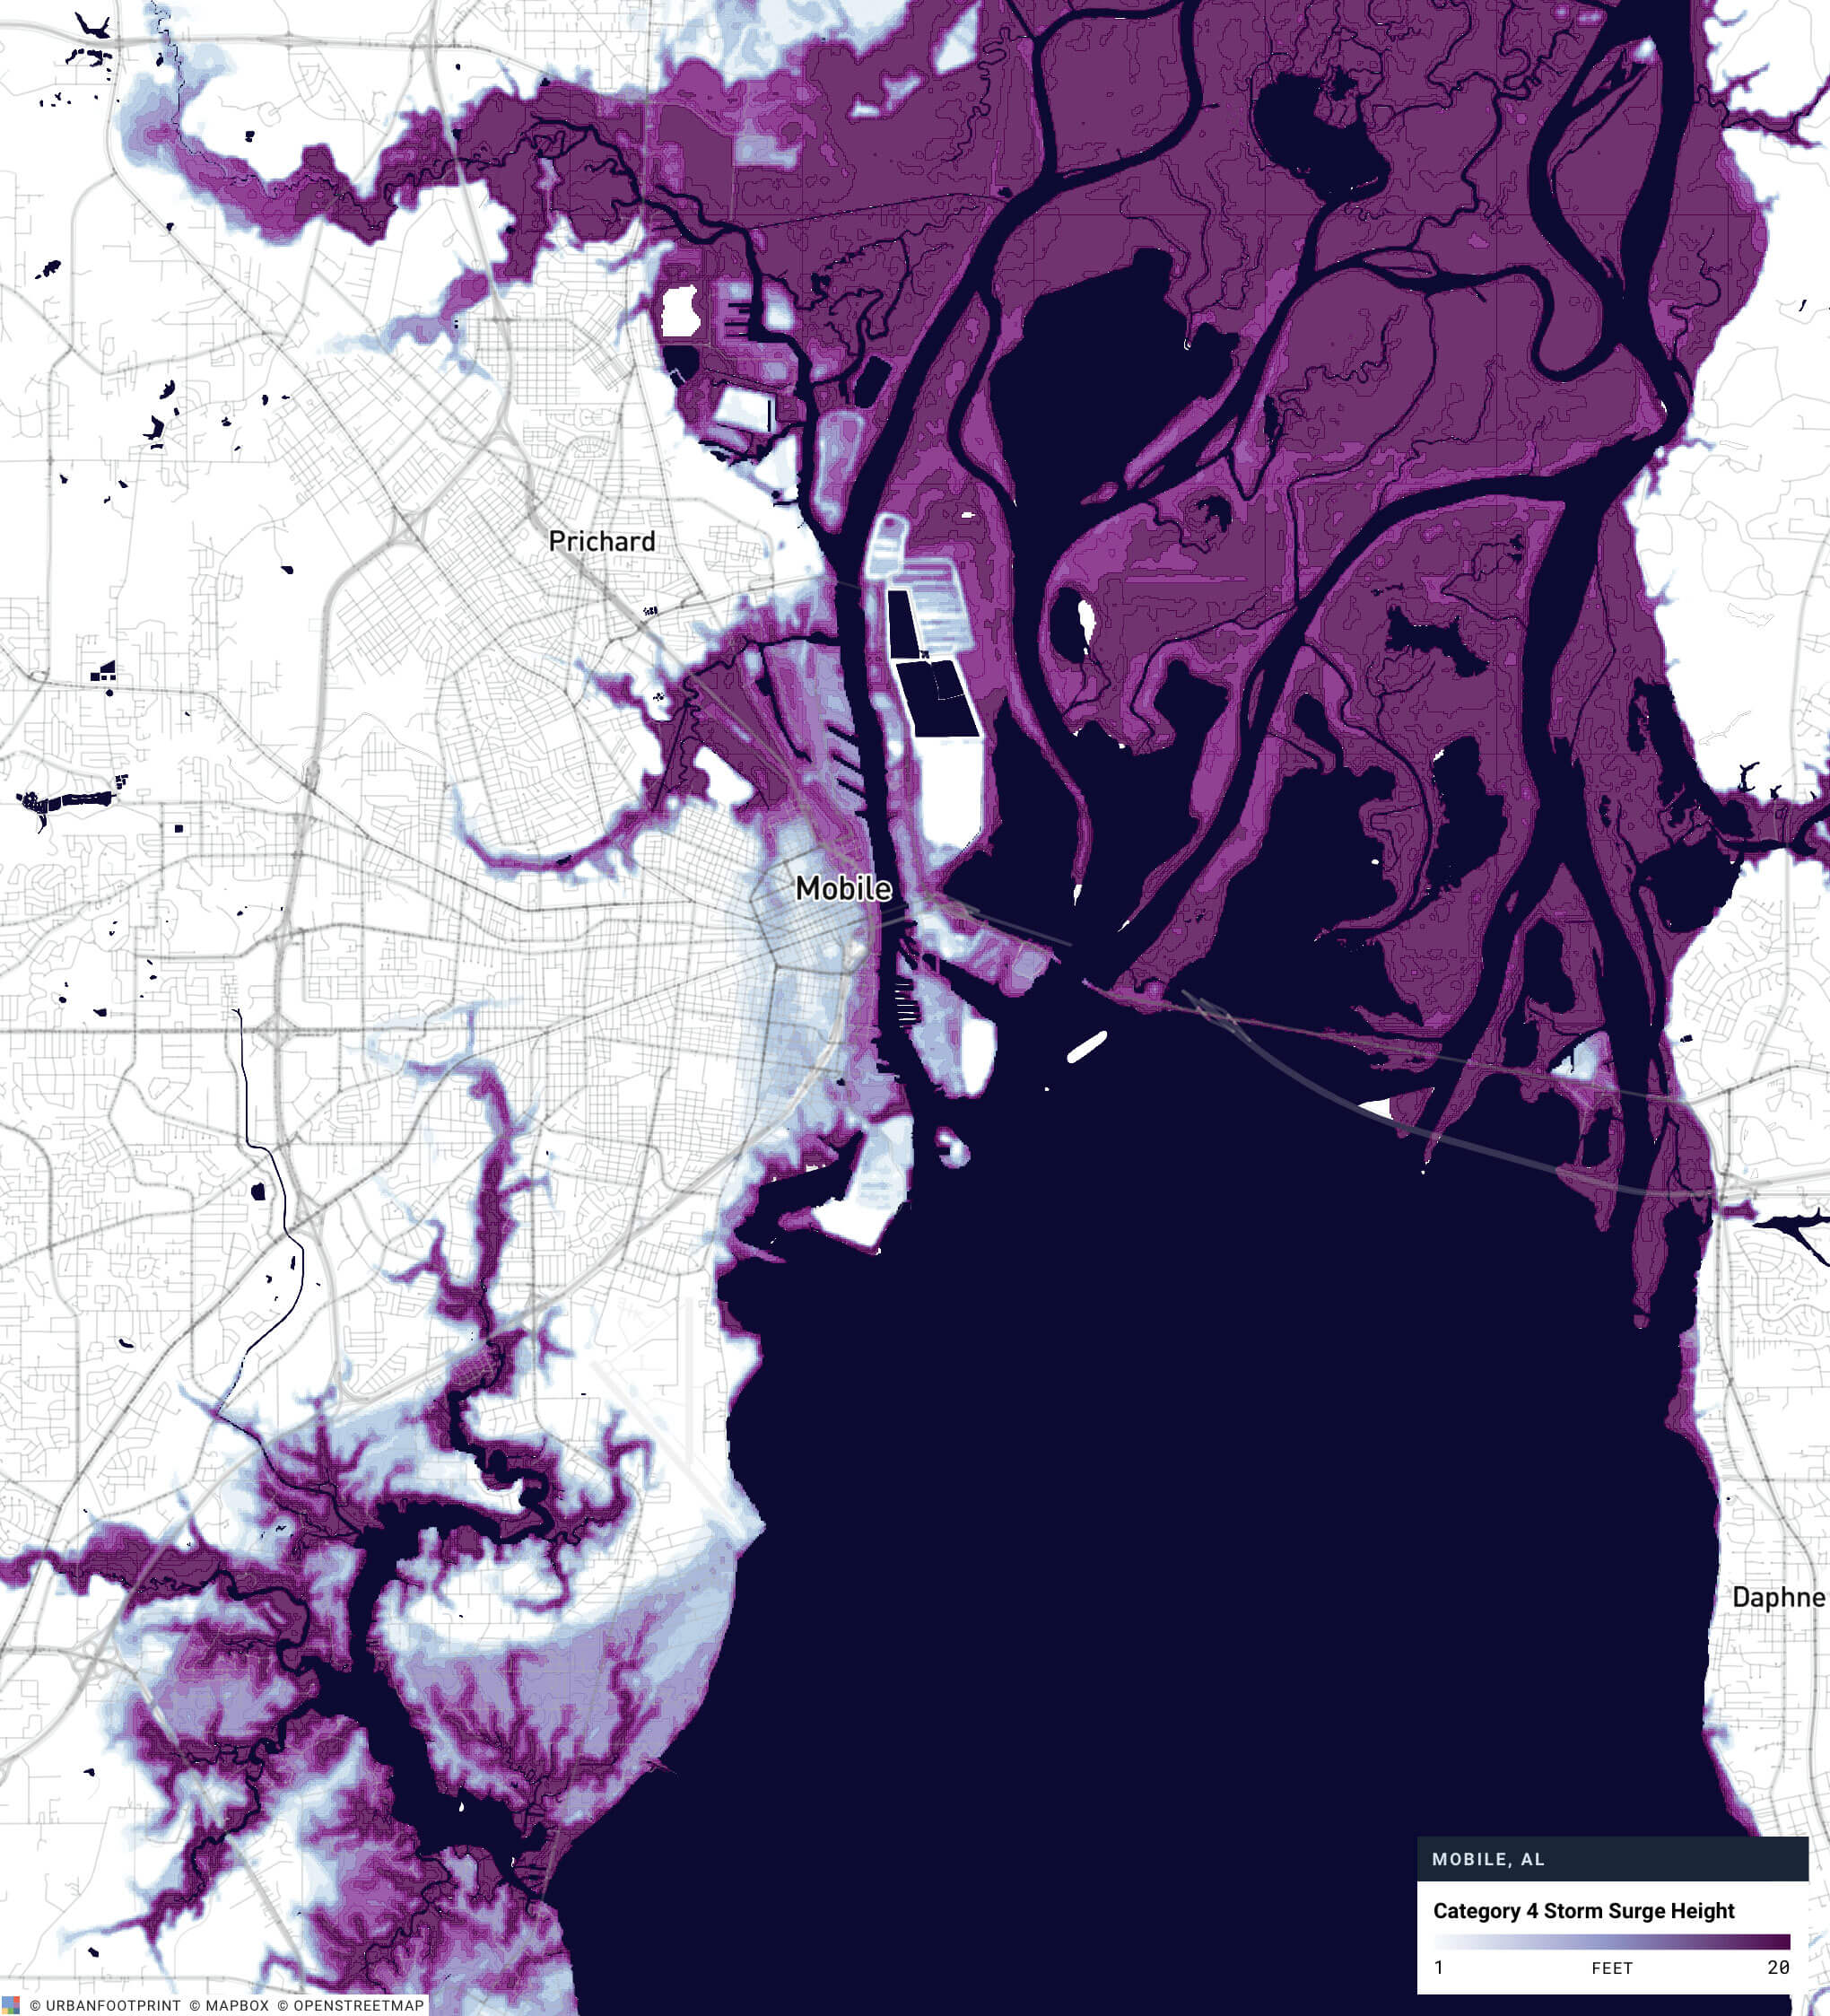
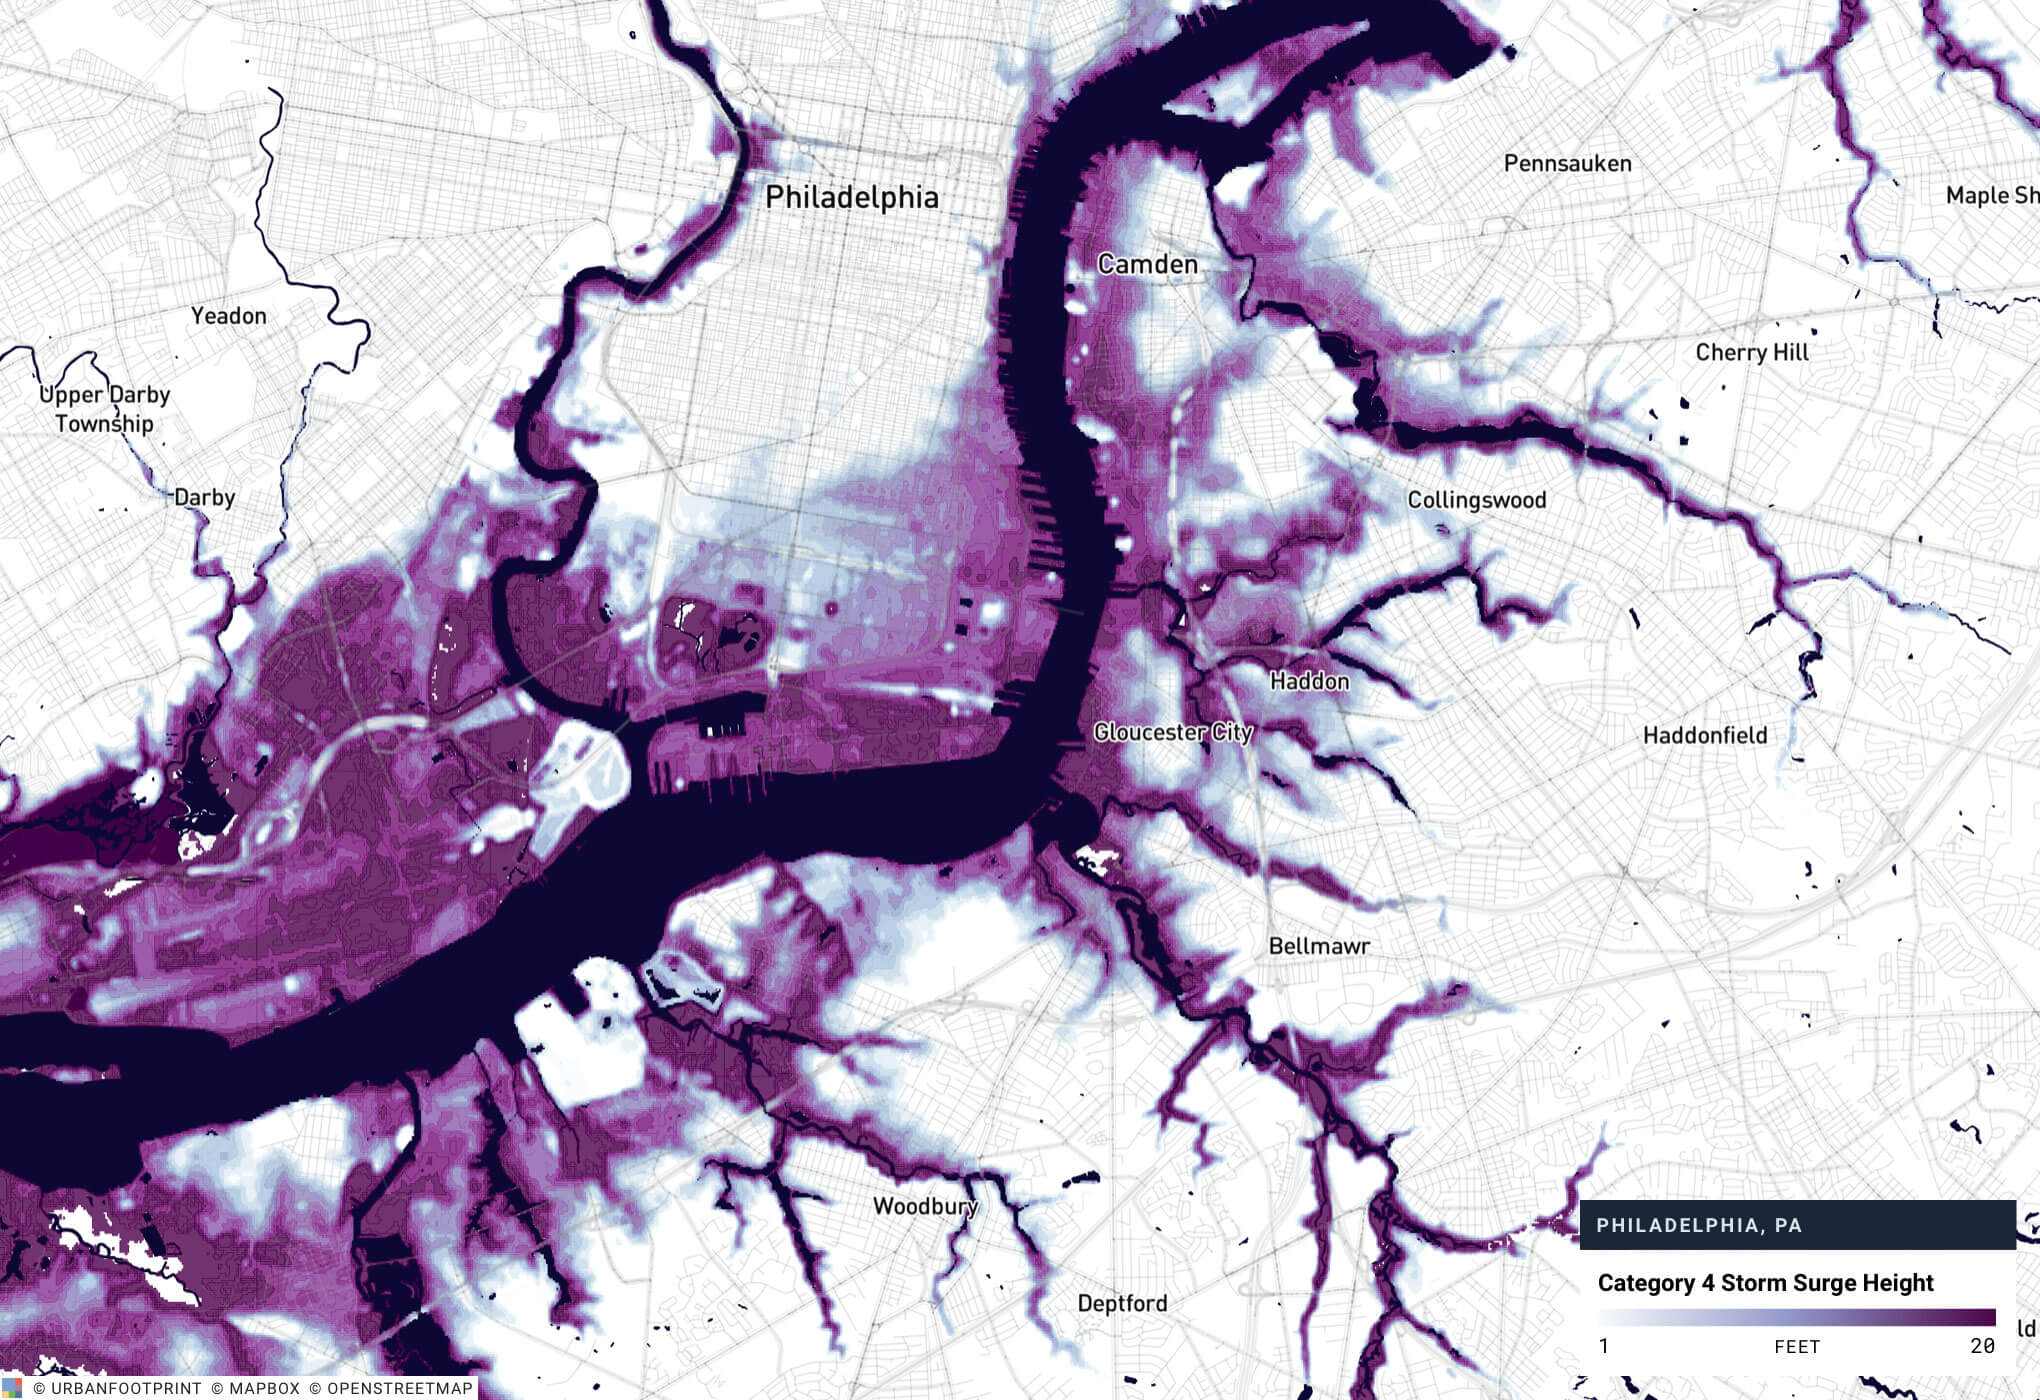
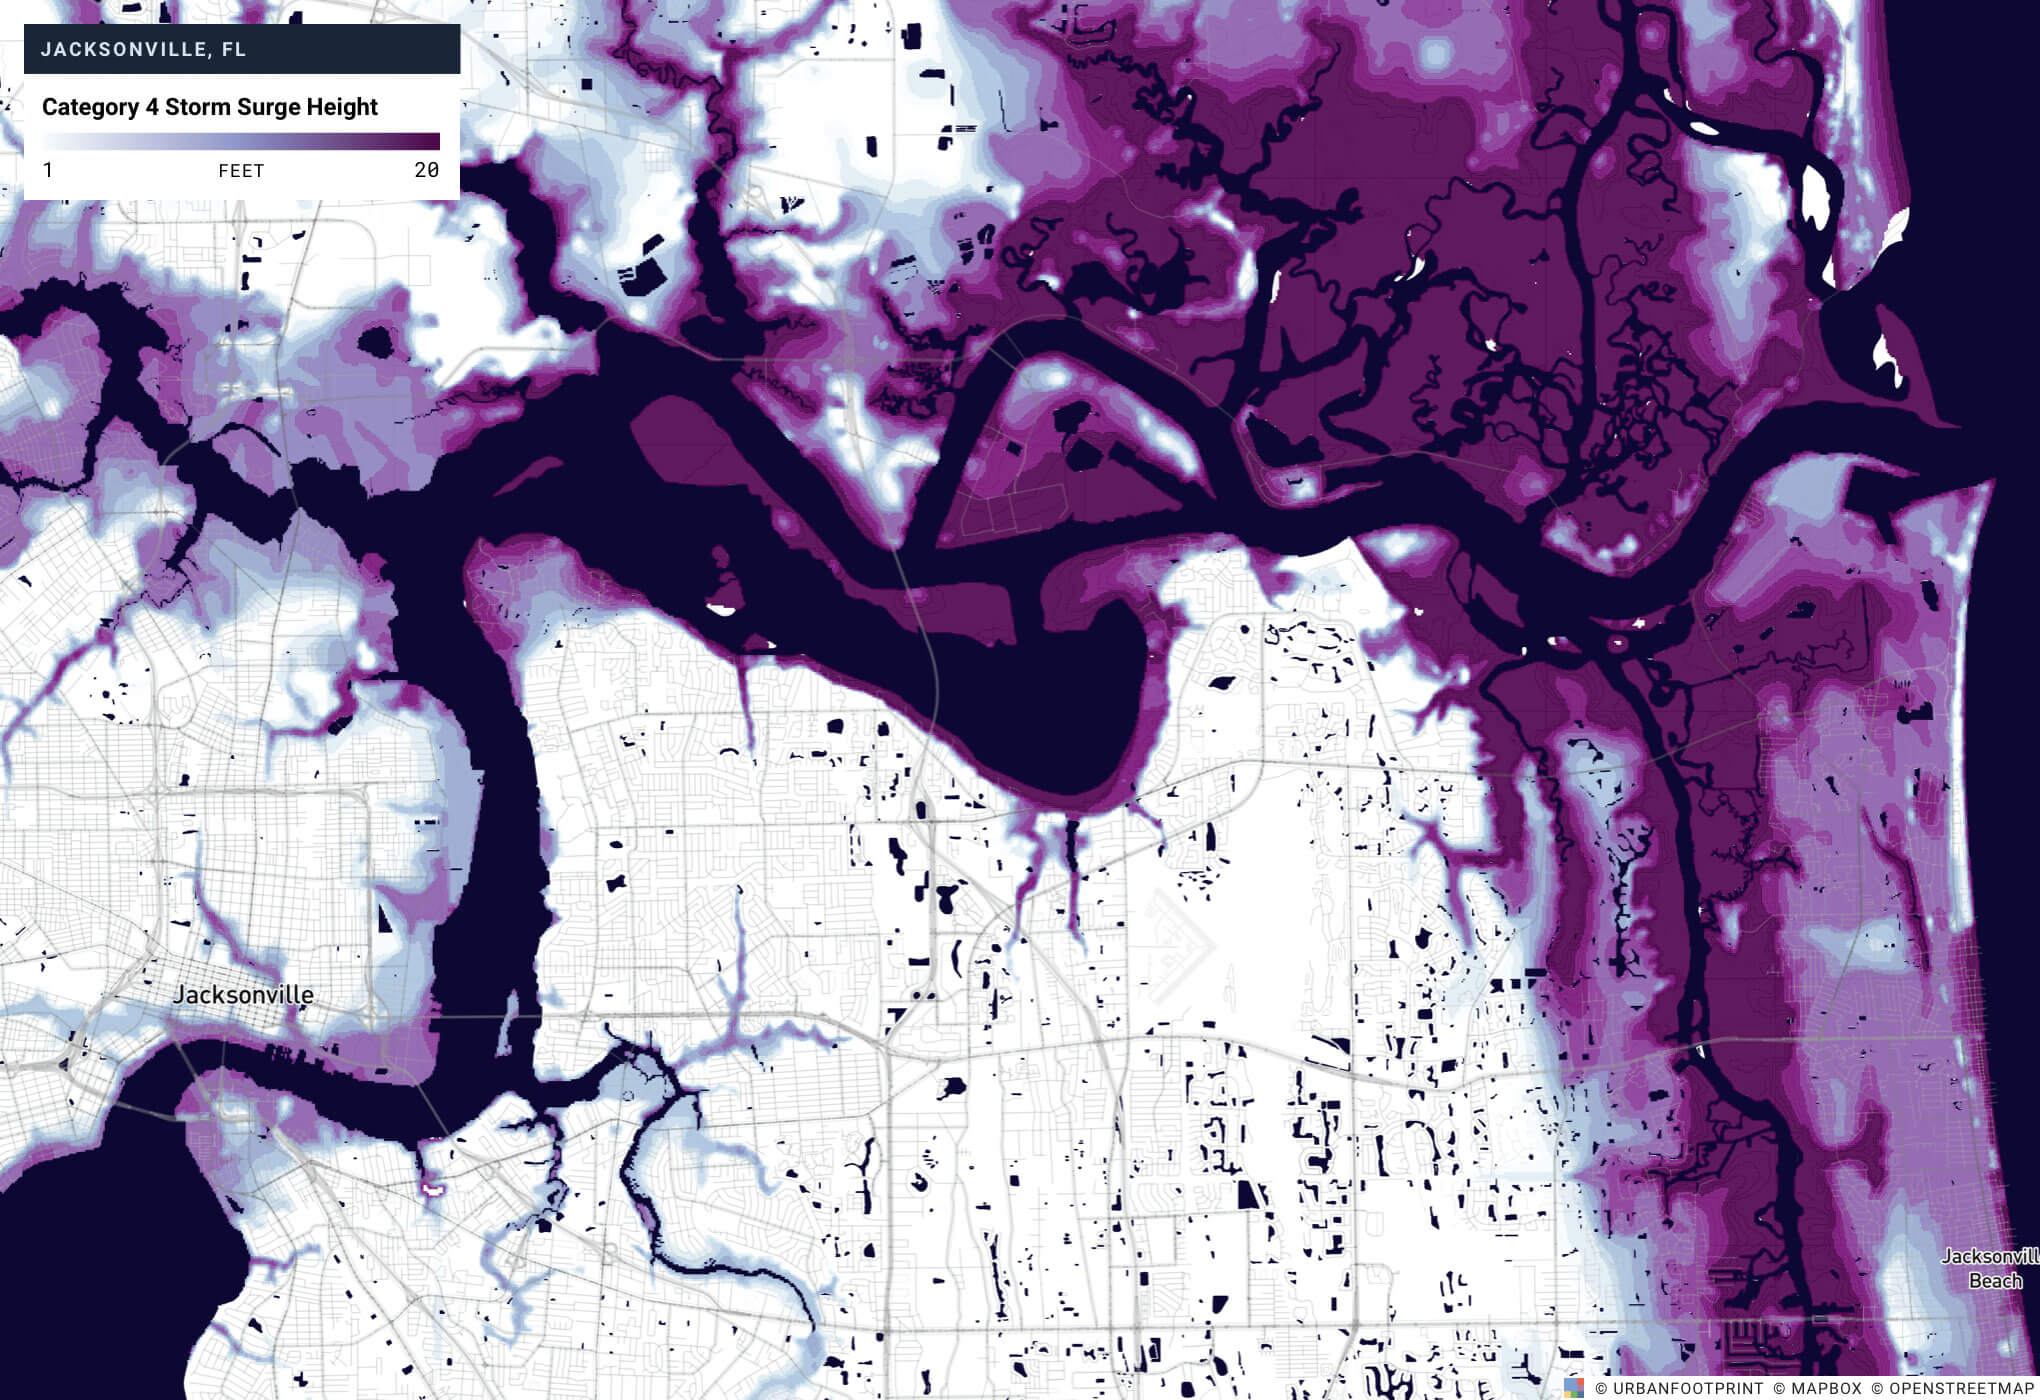
The National Hurricane Center and the Central Pacific Hurricane Center (NHC & CPHC), a subset of the National Oceanic and Atmospheric Administration (NOAA), simulates the maximum anticipated surge in sea levels in the event of a hurricane. While sea level rise datasets indicate the amount of land that would be inundated due to anthropogenic climate change, Storm Surge Hazard data from NHC and CPHC indicate land that is likely to be inundated by a storm surge, one of the main hazards associated with hurricanes, alongside high winds and torrential rain. Areas vulnerable to storm surge could see even higher levels of flooding if they also sit a flood hazard zone.
At UrbanFootprint, we make this data available to all projects along the coast from Texas to Maine, as well as Hawaii, with storm surge heights modeled up to 20 feet. The NHC and CPHC SLOSH Model (Sea, Lake, and Overland Surges from Hurricanes) marks regions protected by levees with a storm surge of zero feet.
As the NHC and CPHC explain, this dataset does not show outcomes for one particular scenario but instead maps the maximum possible surge height in all simulations conducted for the region. Building sound policy is contingent on unraveling these uncertainties, and cities can take iterative steps to assess their success with every hurricane season.
By piecing critical storm surge data together with parcel-level land use information in UrbanFootprint, cities can quickly start to identify strategies for improved resilience. This may include measures like pinpointing parks or unused public lots as potential locations for rain gardens or afforestation drives or even making the case to fund larger ventures in green infrastructure that would need buy-in from the community.
Intersecting storm surge information with other key datasets can shed light on various aspects of community preparedness. How would critical services be affected by hurricanes? How safe are arterial transportation corridors? Which residents need the most support not just during a hazard, but also before and after as they build their communities to be more resilient to the forces of nature?
Interested in exploring storm surge data in your community or planning project?
Talk with our team and learn how to set up your own analysis in minutes. We’ll share how UrbanFootprint delivers critical resilience planning insights with thousands of preloaded datasets and advanced scenario planning.
Have a question or comment? Let us know! We’d love to hear from you. Tweet us your thoughts or send us a note.
