


If you’re interested in creating a project like this, let us know!
Developed by the EPA, the Emissions & Generation Resource Integrated Database (eGRID) details in-depth information for nearly all of the electric power generated in the U.S. The dataset includes insights on power generation capacity, fuel used, emission rates for CO2 equivalents (as well as other particulate emissions), and several other attributes for power plants across the country. As part of the UrbanFootprint Data Library, it’s easier than ever to map and understand the source of electricity in your community.

For planners, this is an important step in climate action planning and evaluating risk and resilience for community infrastructure. With the ability to quickly assess the emissions rates of nearby power plants, planners can begin to devise a data-driven climate action plan to reduce emissions produced by electricity. Plus, by combining risk and resilience data, planners can better understand which power plants may be impacted by sea level rise, flooding, storm surge, or wildfires.
In this post we’ll take a look at Phoenix, Arizona as our example and demonstrate how to answer key questions on energy and emissions for nearly any U.S. location with UrbanFootprint.
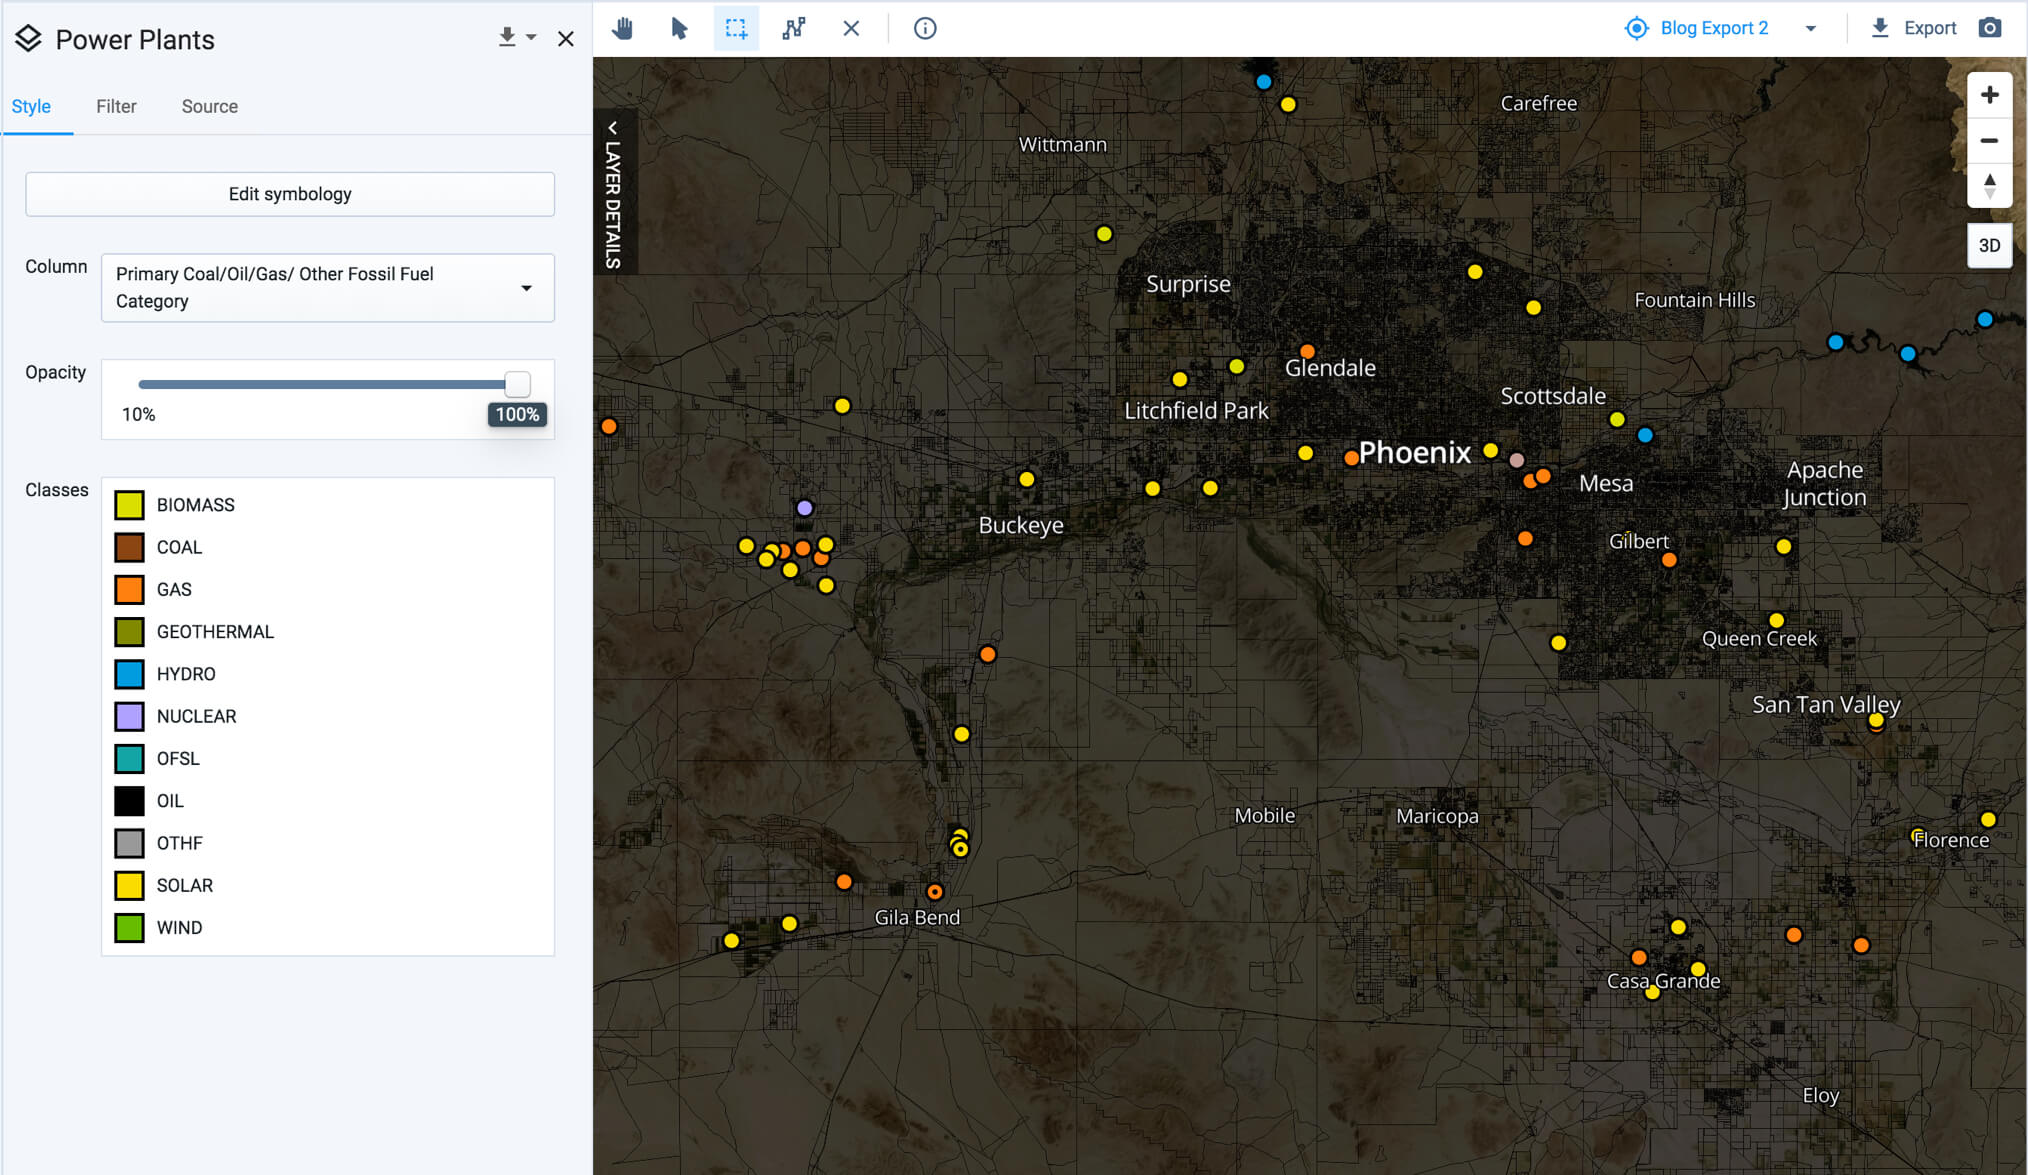
What types of energy sources power our electricity?
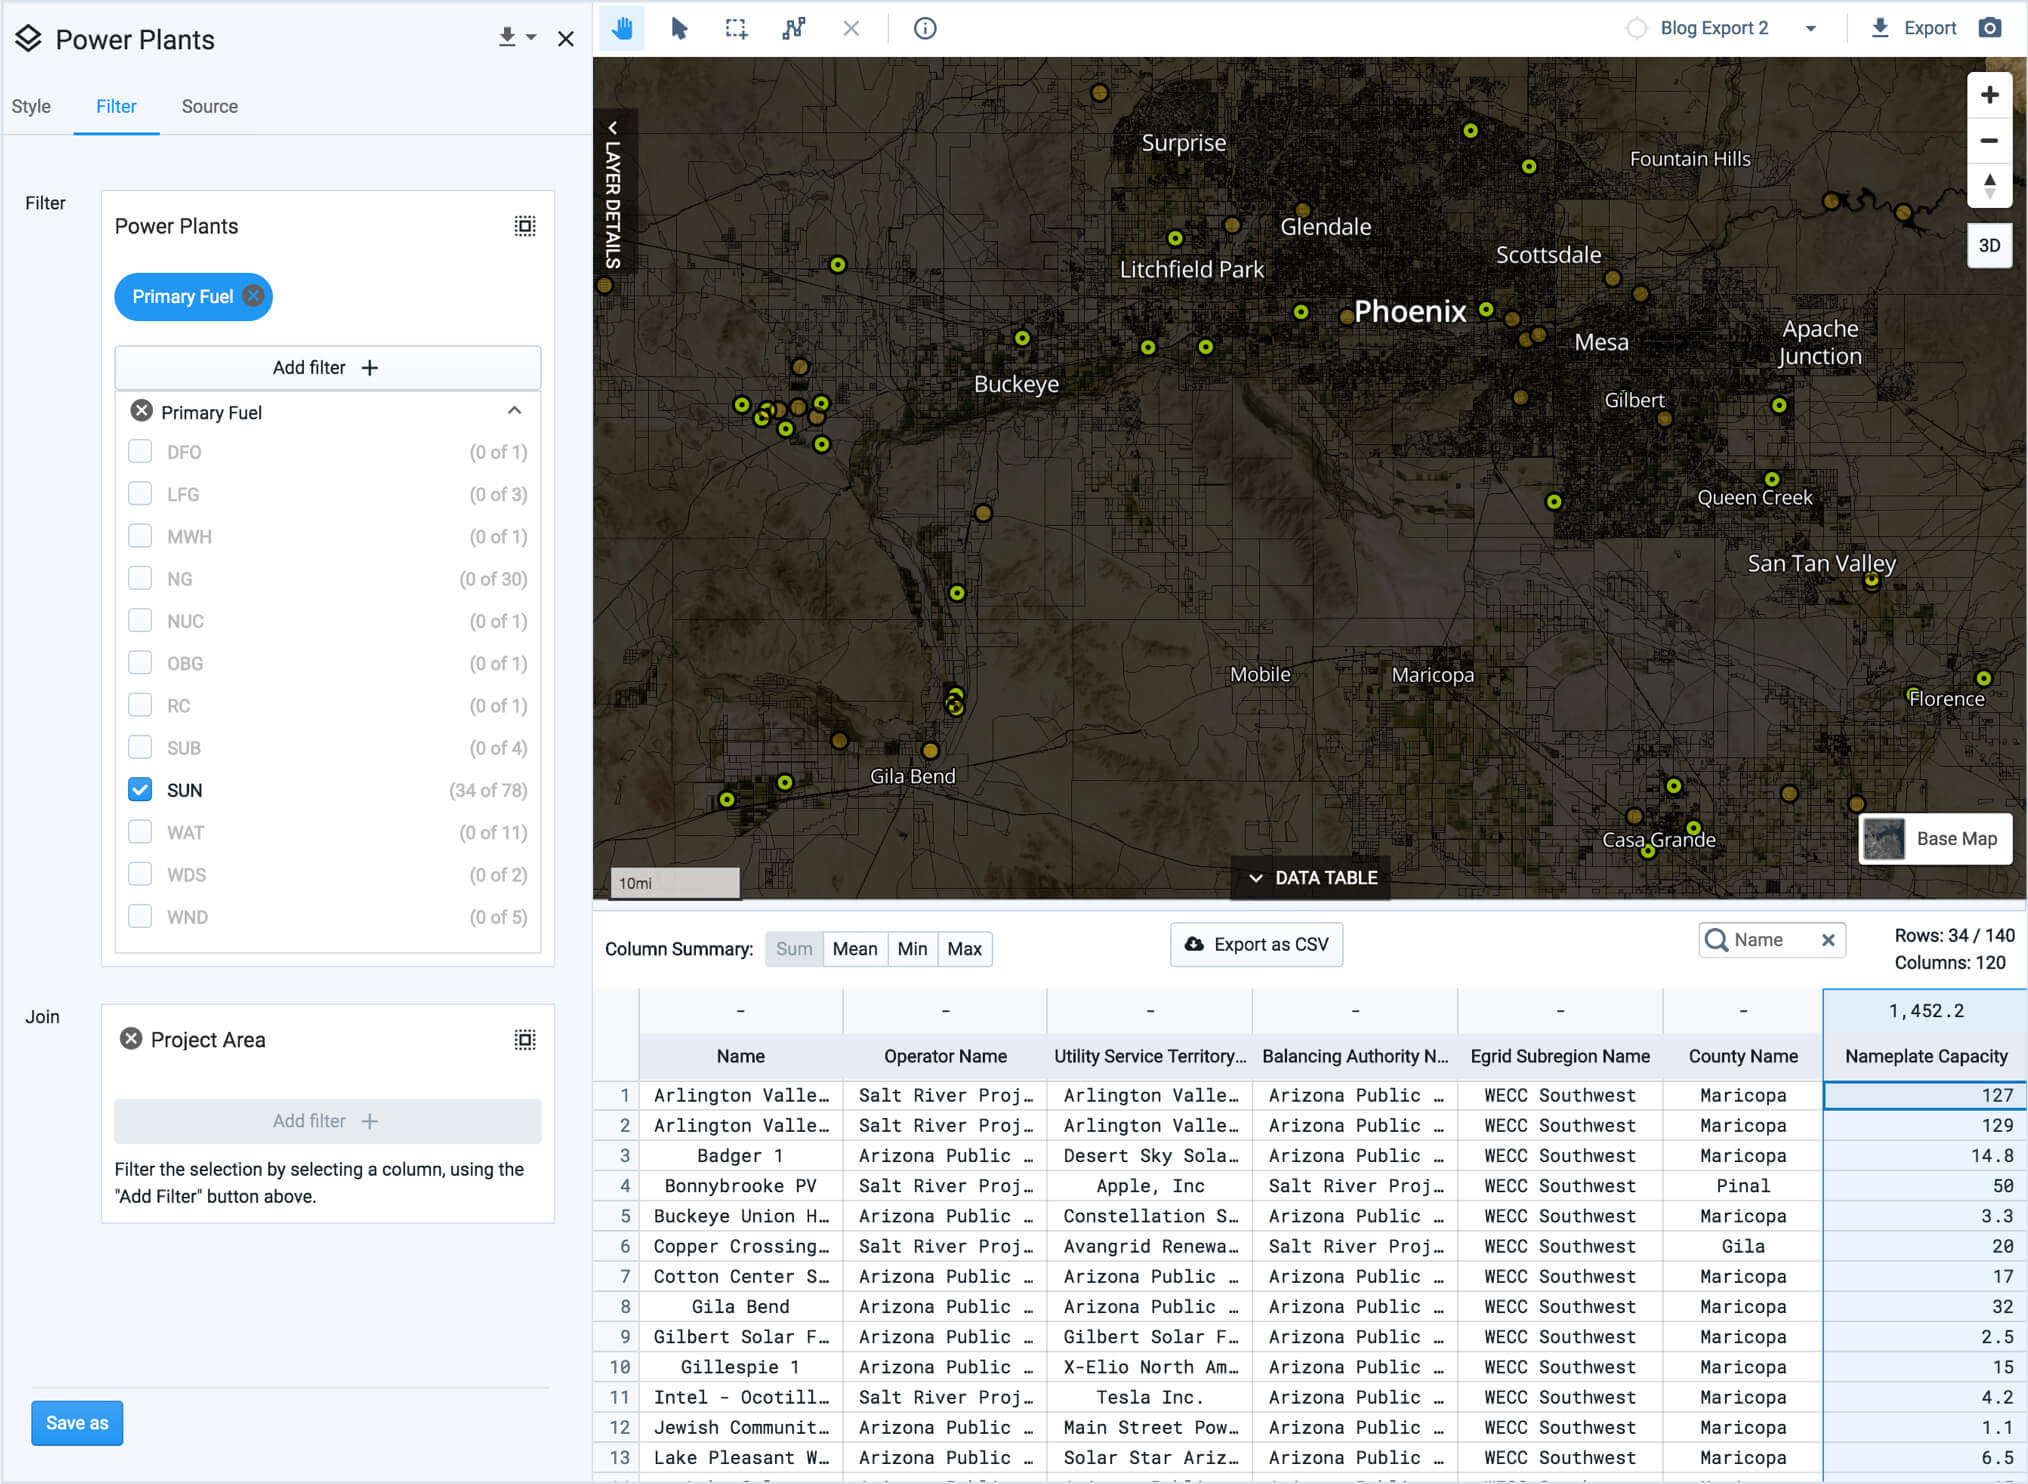
After creating an UrbanFootprint project for Phoenix and adding the Power Plant layer, sourced from eGrid, we can see the metropolitan area is served by a mix of gas, hydro, solar, biomass, and nuclear power.
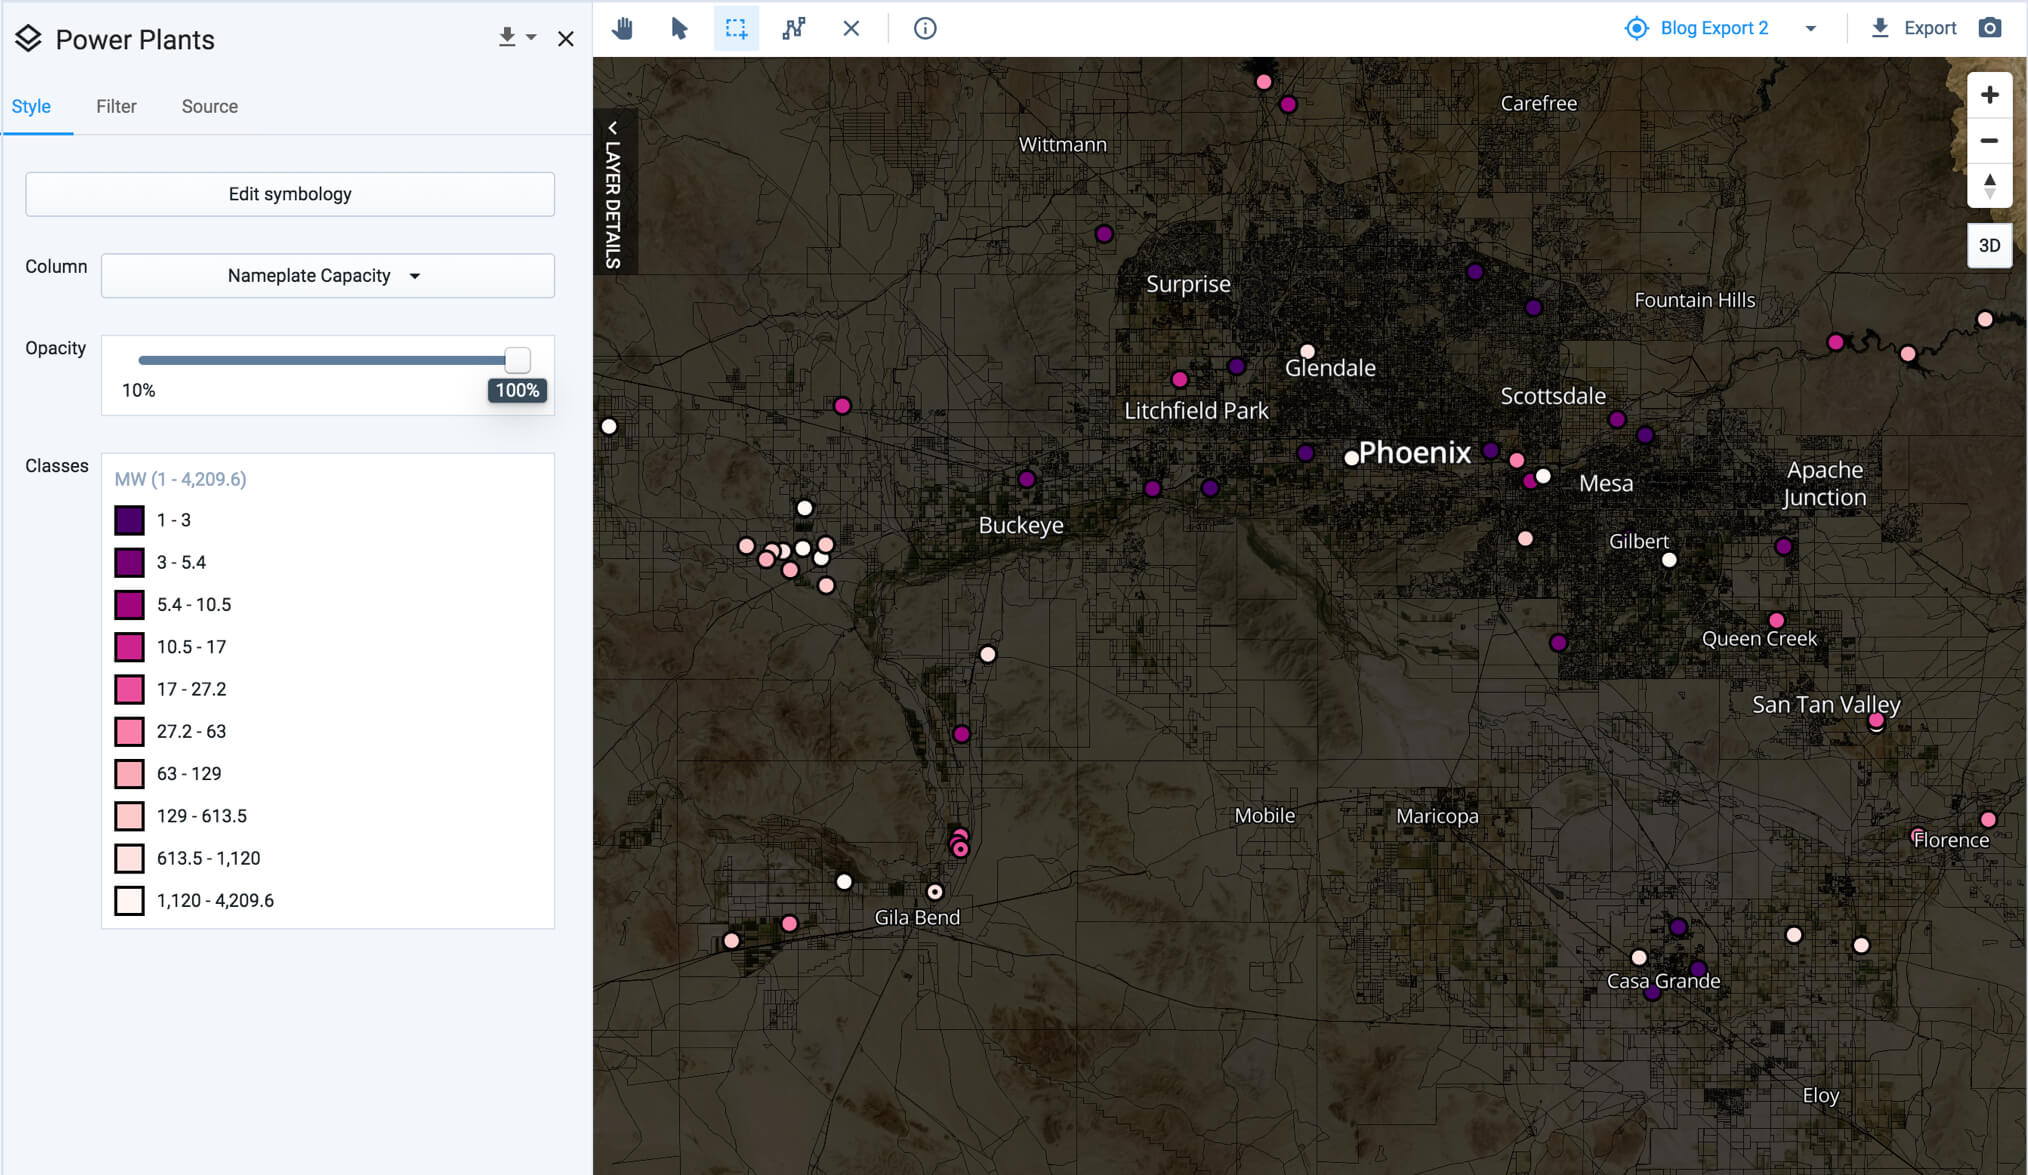
Which power plants generate the most electricity and where are they located?
From this same data layer, we can choose to map the capacity of each power plant to get a sense of where the biggest electricity producers are located.
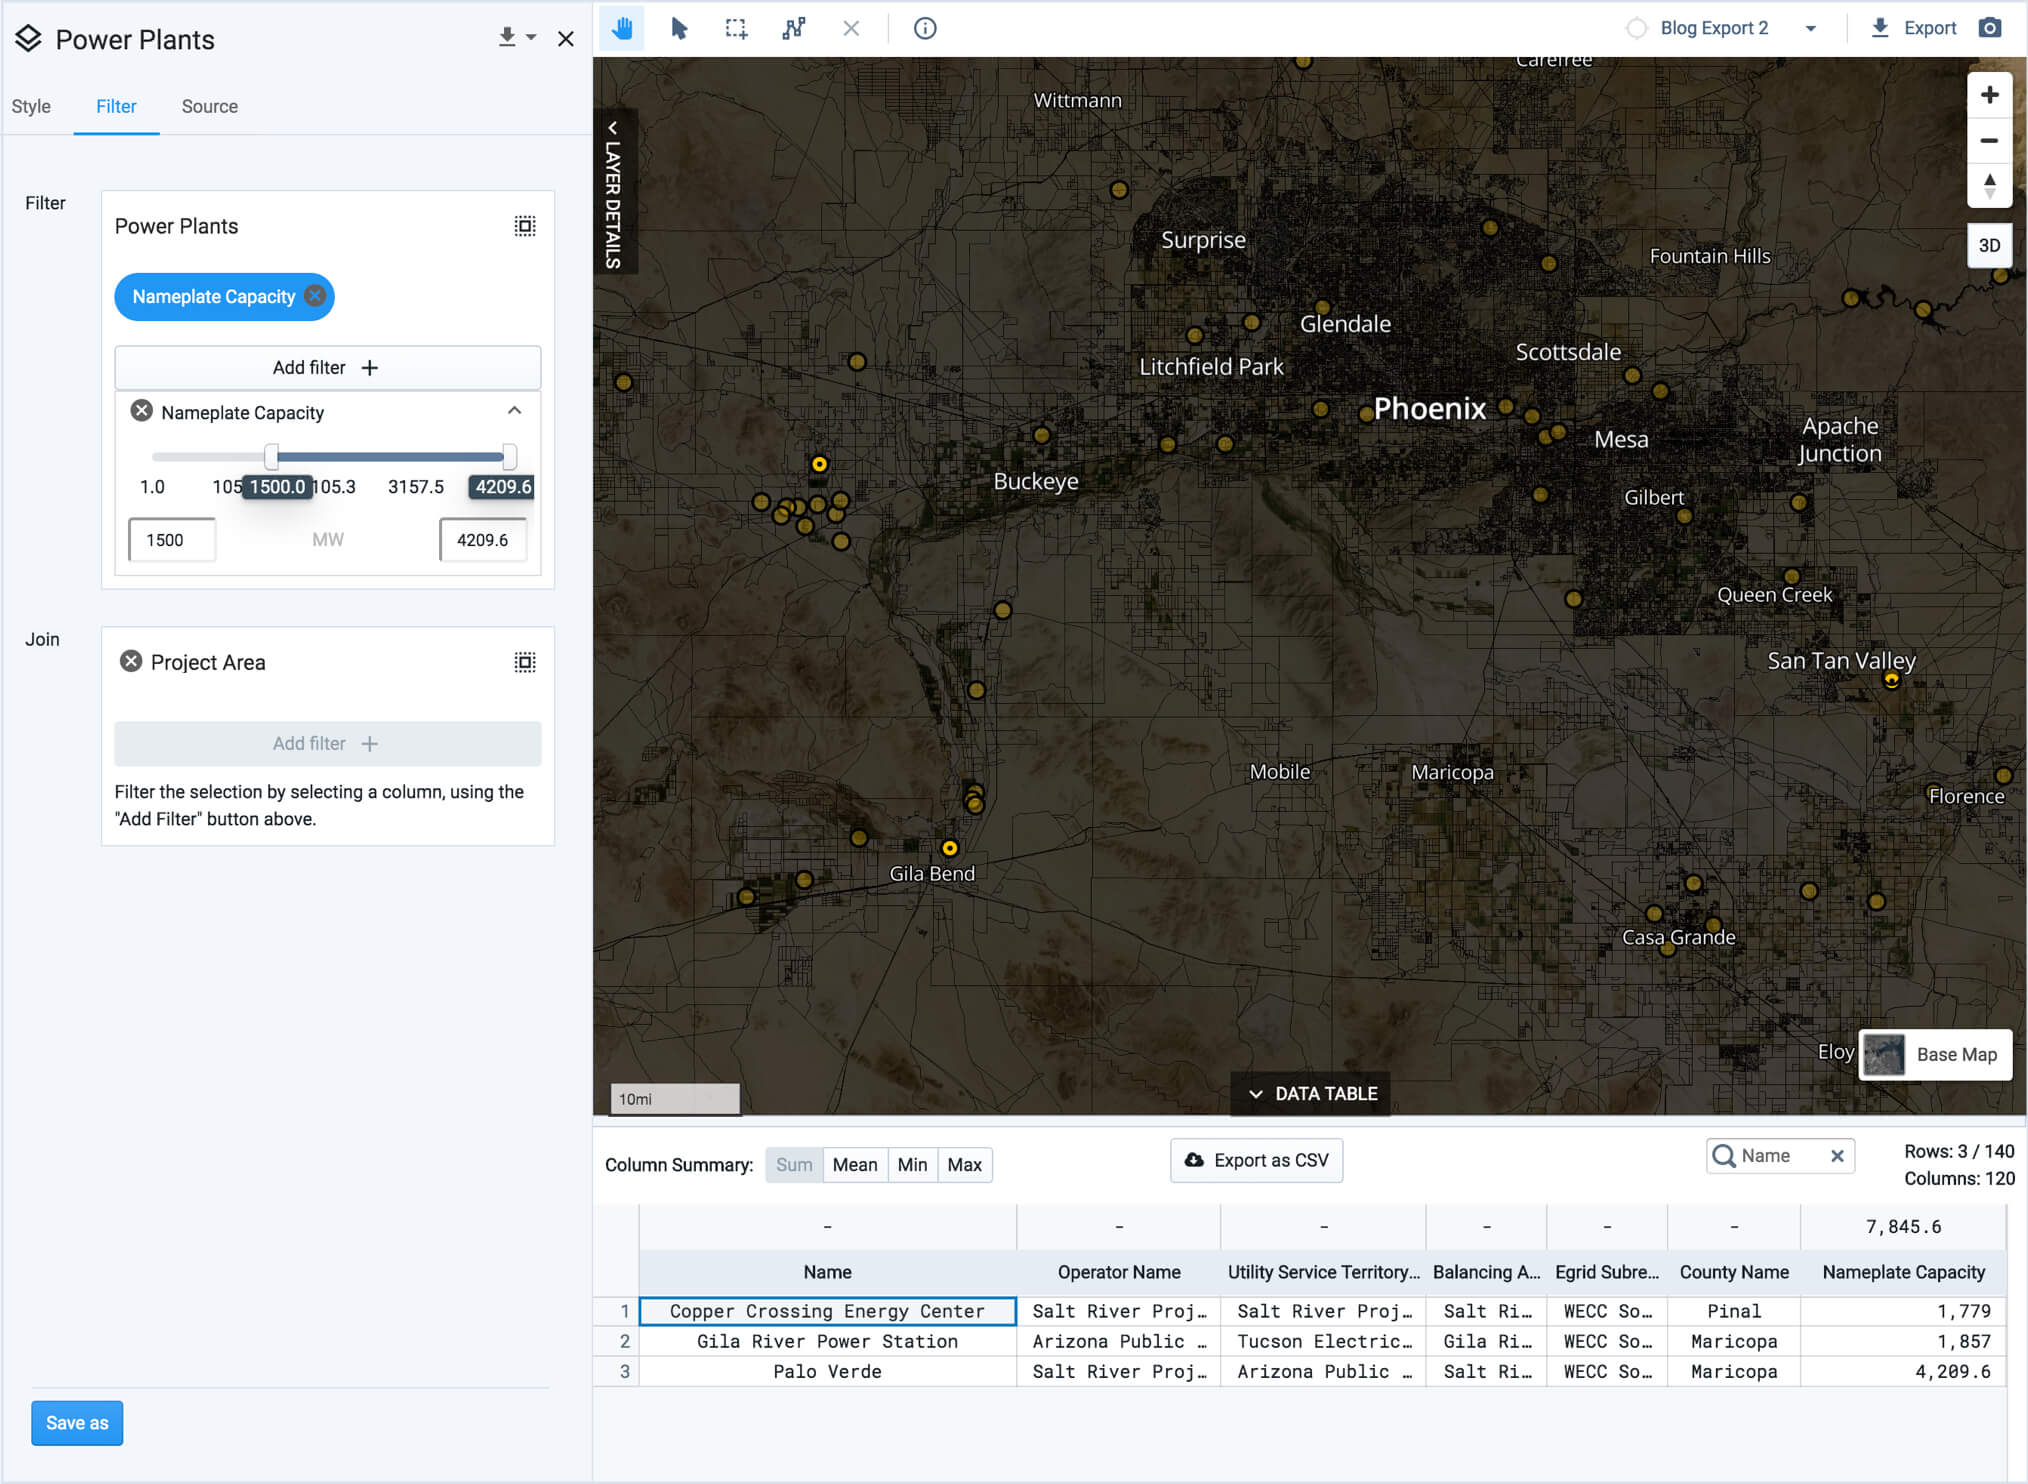
Using UrbanFootprint’s filter capabilities, we can isolate all plants with over 1,500 MW of nameplate capacity. The data table shows those are the Palo Verde Plant (nuclear), Gila River Power Station (natural gas), and Copper Crossing Energy Center (natural gas).
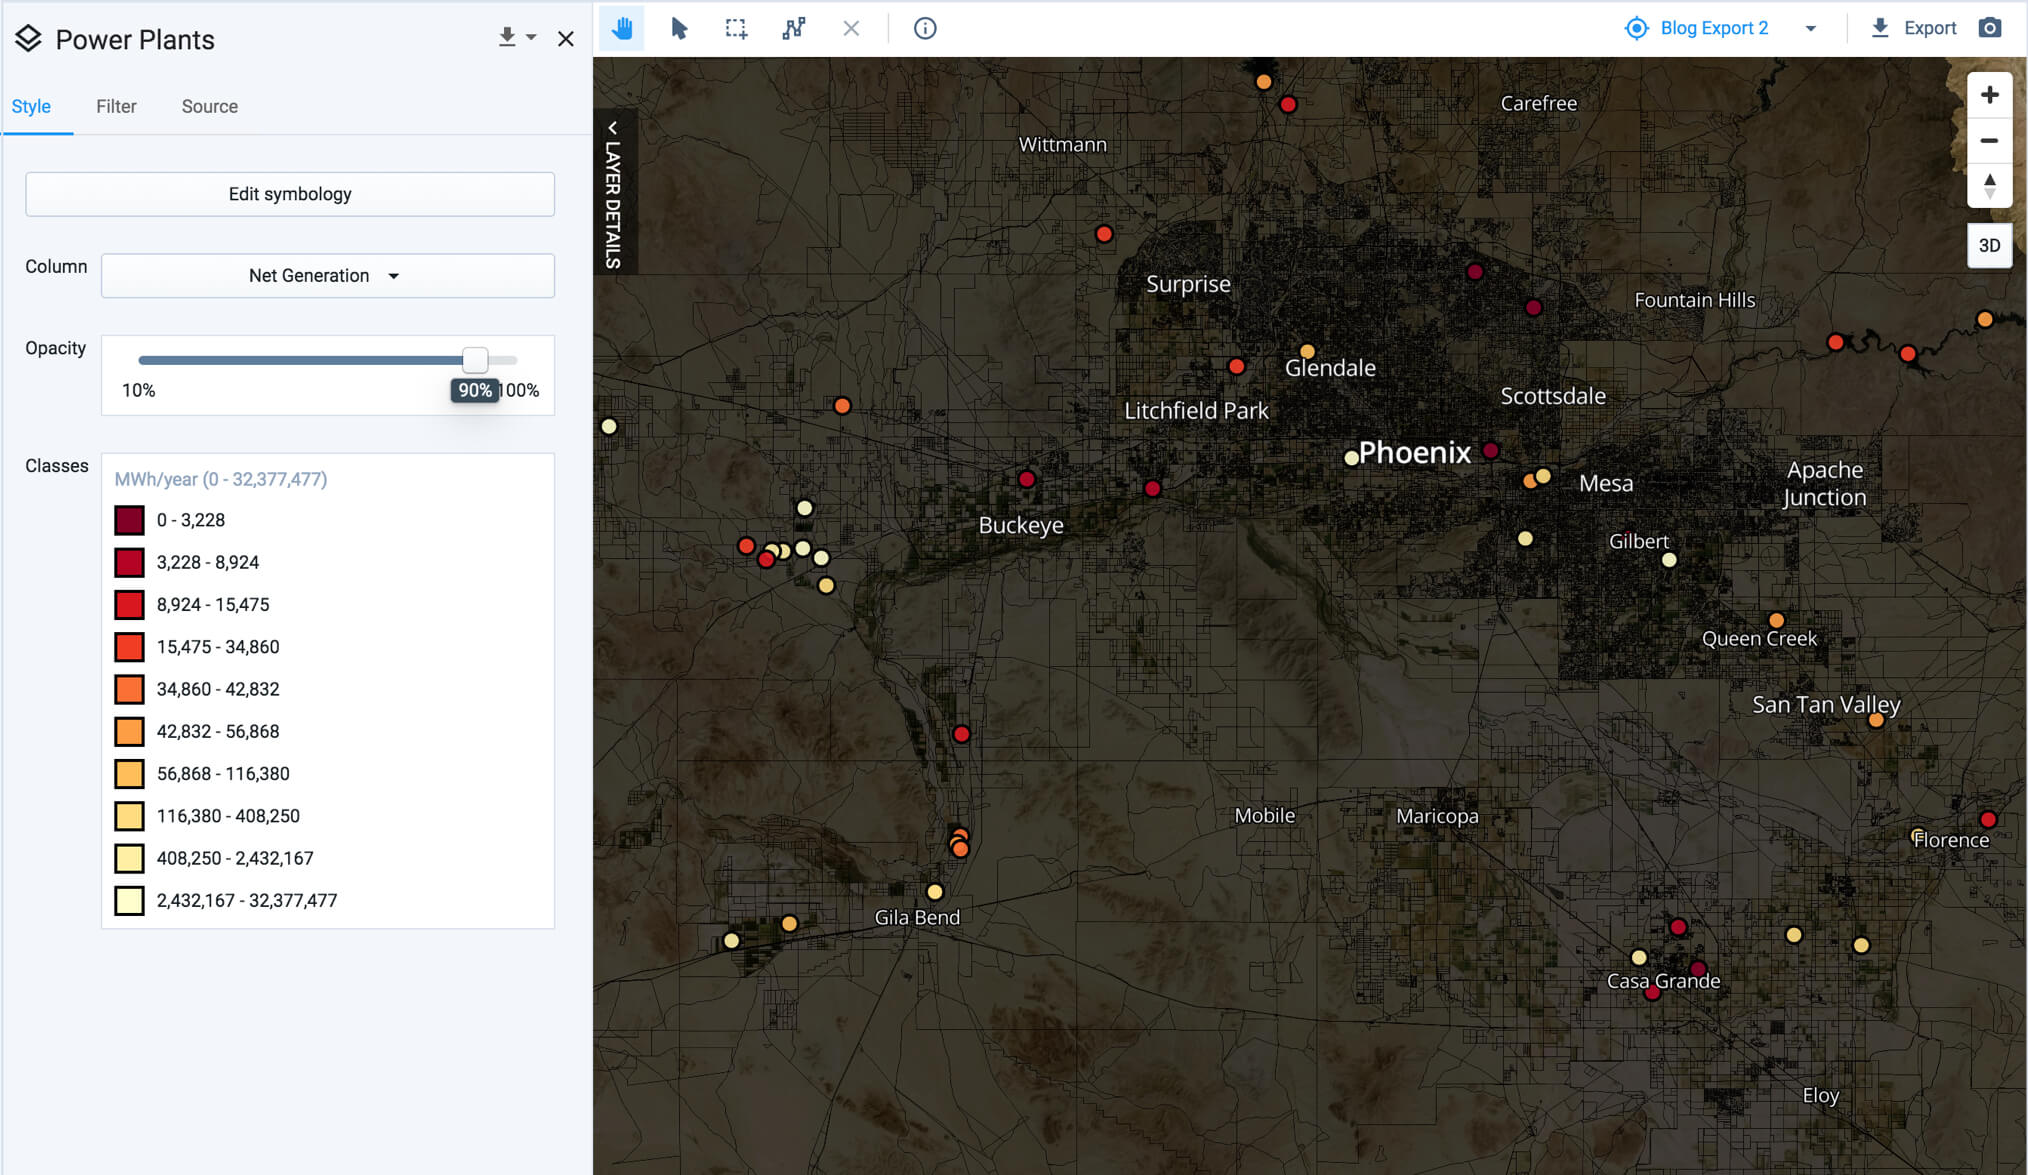
Beyond capacity, we can also look at the total amount of electricity each plant generated per year.
Based on existing infrastructure, how much electricity could we generate with solar today?
What is the capacity of existing solar facilities in the Phoenix metro area? We can quickly get this information by filtering to just solar facilities and then viewing the generation capacity in the data table. It shows that there are over 1,400 MW of solar capacity across the 34 solar plants in the metro area included in the dataset.
How do local power plants impact emissions?
The dataset includes CO2 Equivalent emissions, allowing us to look at which plants in the area contribute the most emissions. Topping the list is the Gila River Power Station (just north of Gila Bend) with 3.2 million tons of CO2 equivalent produced each year.
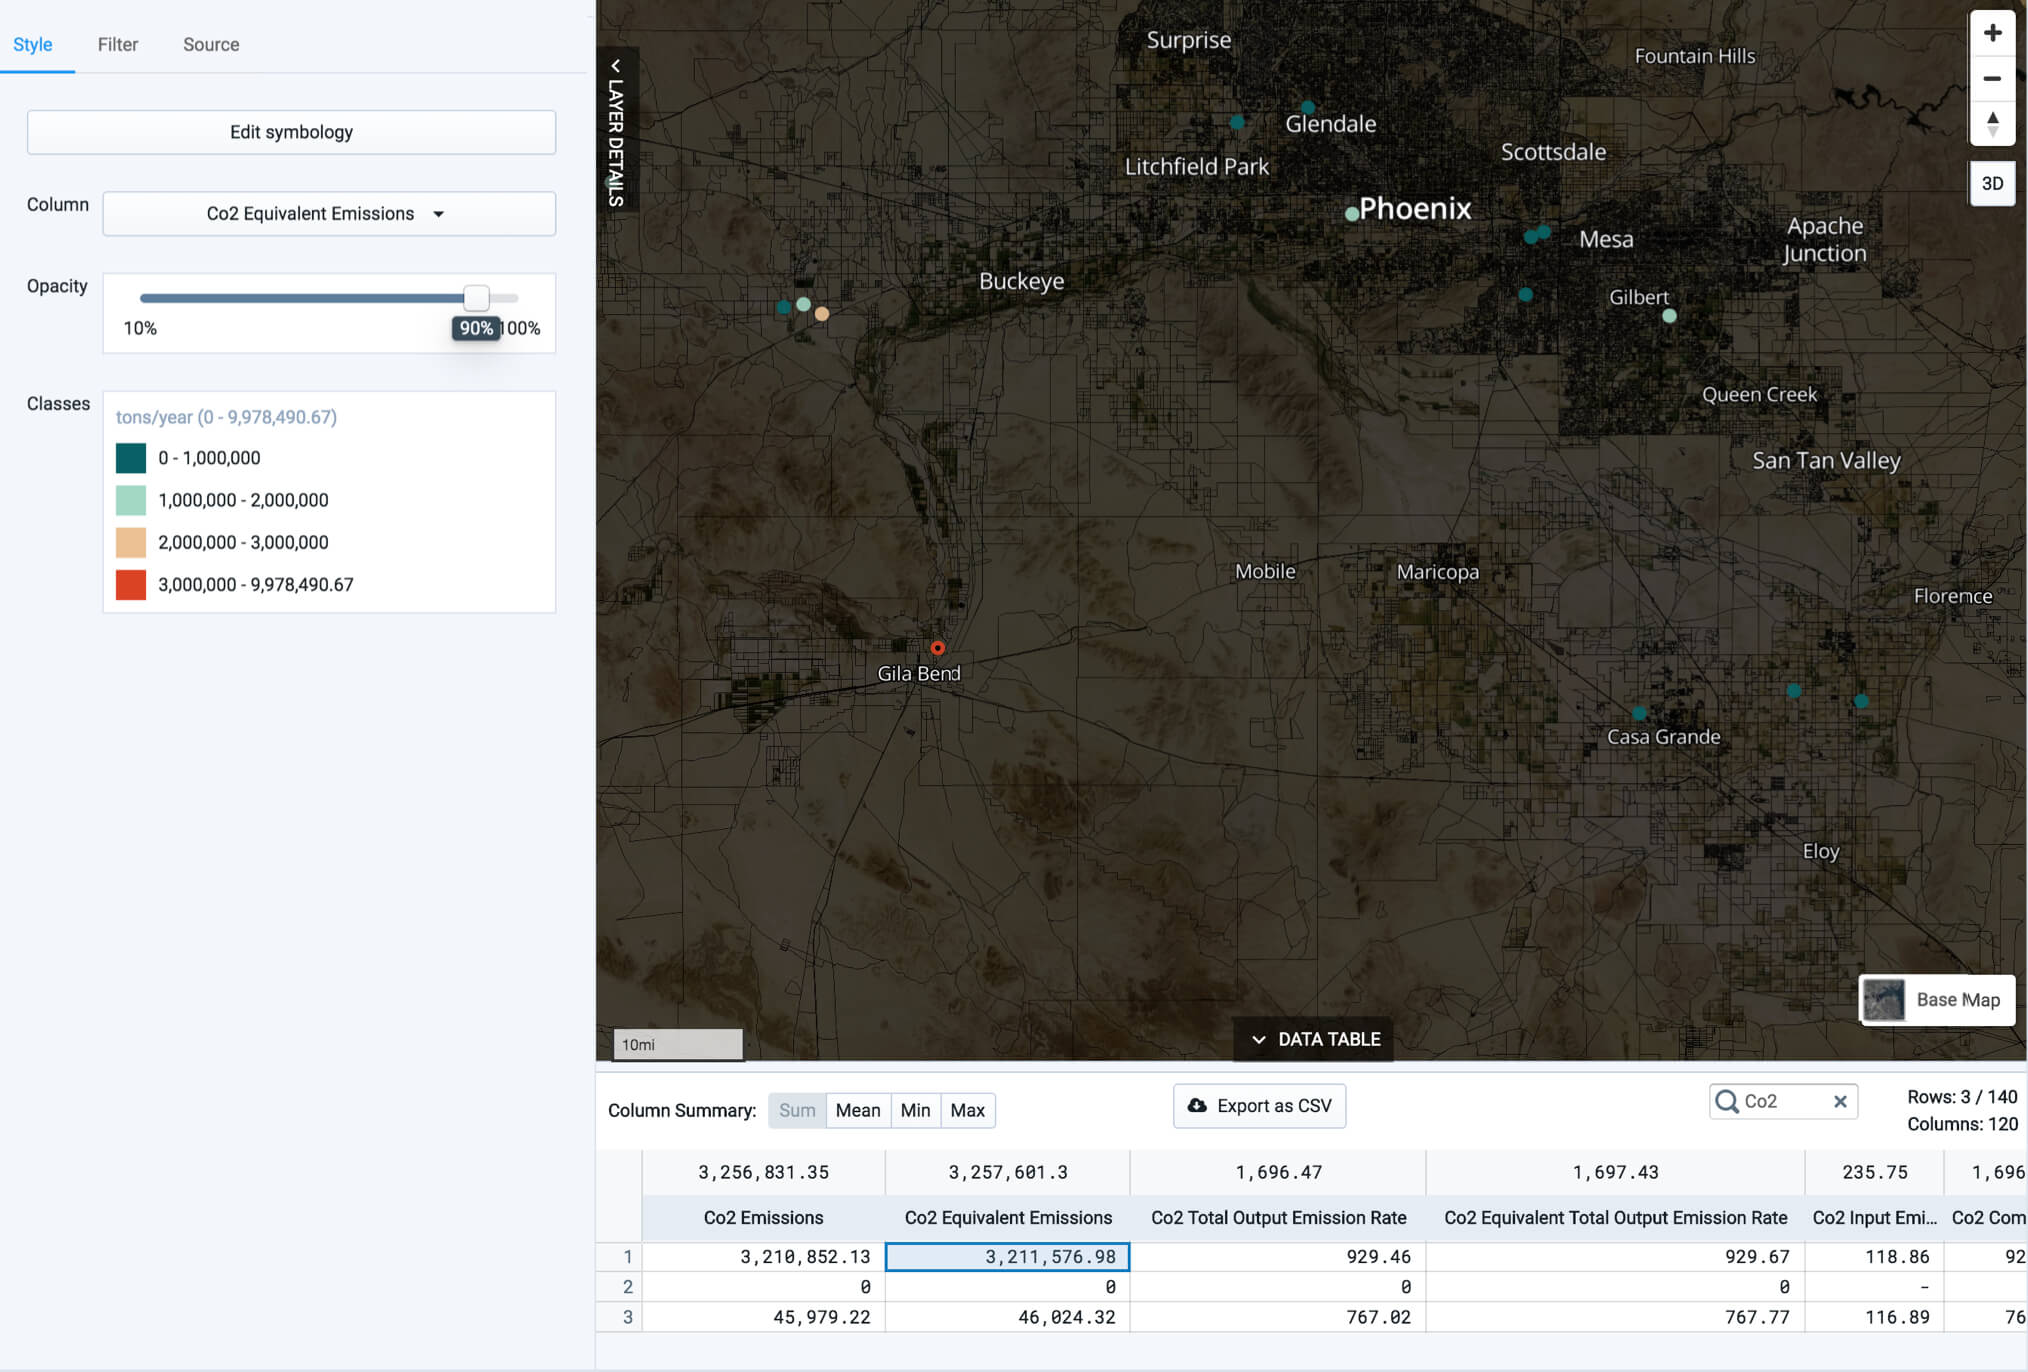
While Gila River produces the most emissions, it is not necessarily the ‘dirtiest’ power plant in the area. Mapping on CO2 Equivalent Rates (lbs/mWh/year) tells a different story with smaller natural gas plants, such as Agua Fria in Glendale, emitting 1,500 lbs/mWh/year compared to Gila River’s figure of 929 lbs/mWh/year.
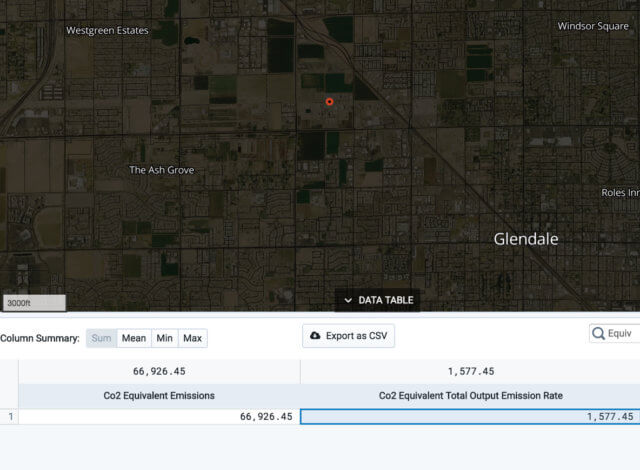
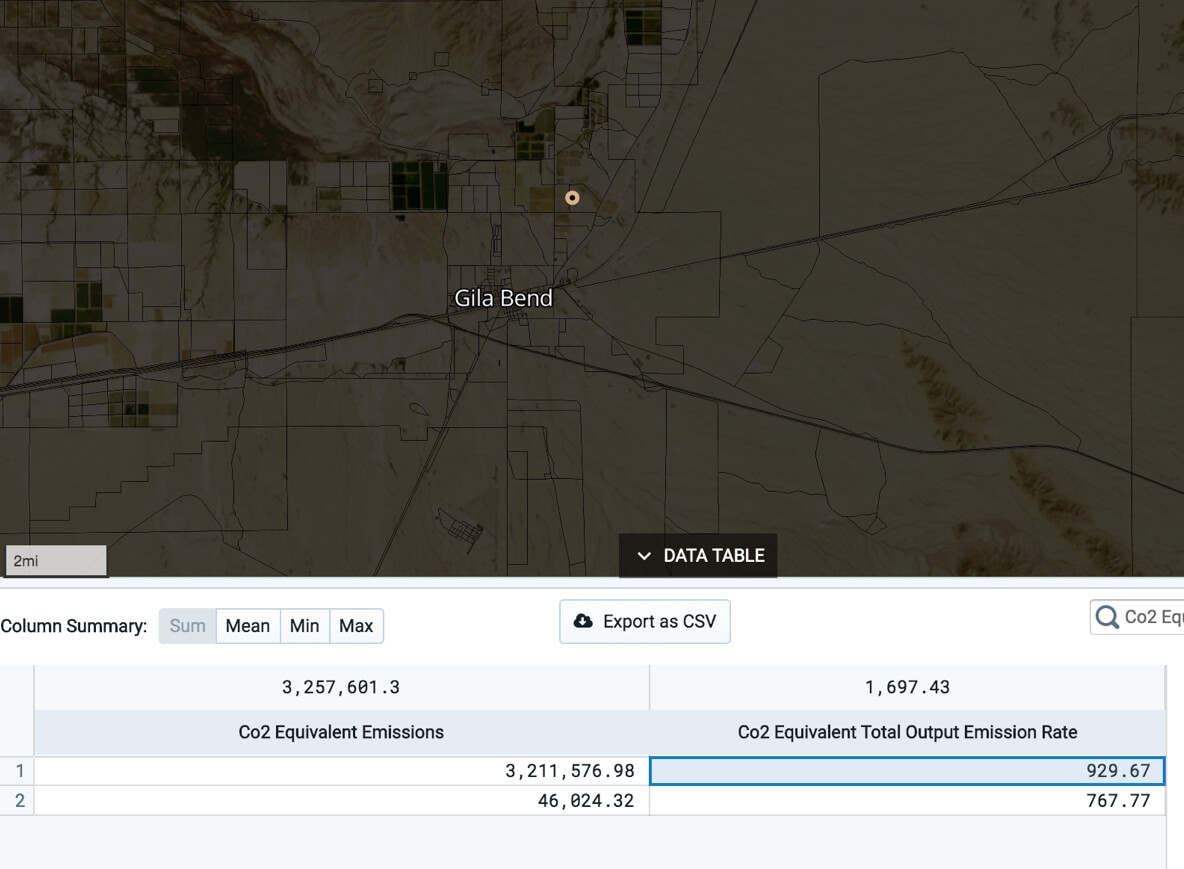
Co2 Equivalent Total Output Emission Rate for Agua Fria natural gas plant (left) and Gila River Power Station (right).
Learn how to map and analyze emissions and the electric grid in your community
Whether you’re looking to analyze risk and resilience for existing utilities or assess the current energy source mix in your community, we invite you to book a demo of UrbanFootprint. We’ll walk through the workflows above and demonstrate how to quickly map existing conditions, build alternative land use scenarios, and measure the impacts.
Have questions? We’d love to hear from you. Send us a note or tweet us @UFPlatform.
