


Mapping accessibility is a hallmark feature of UrbanFootprint. Whether for existing conditions reporting or future scenario planning, UrbanFootprint’s built-in Analysis Modules provide a rapid assessment of walk and transit accessibility to a variety of destination categories: employment sites, schools, hospitals, parks, and transit stops. Today, we’re thrilled to announce a new feature that expands this capability to include any destination of your choice. With Custom POIs, you can now map and measure accessibility to any single point or subset of locations, whether in a preloaded point dataset in UrbanFootprint’s expansive Data Library or in a new dataset you upload yourself.
Custom POIs open up an exciting range of new use cases—from choosing the best location for additional emergency facilities, such as heat-wave cooling centers or community resilience centers, to measuring equitable access to supermarkets and other essential businesses. Let’s take a closer look at a few examples.
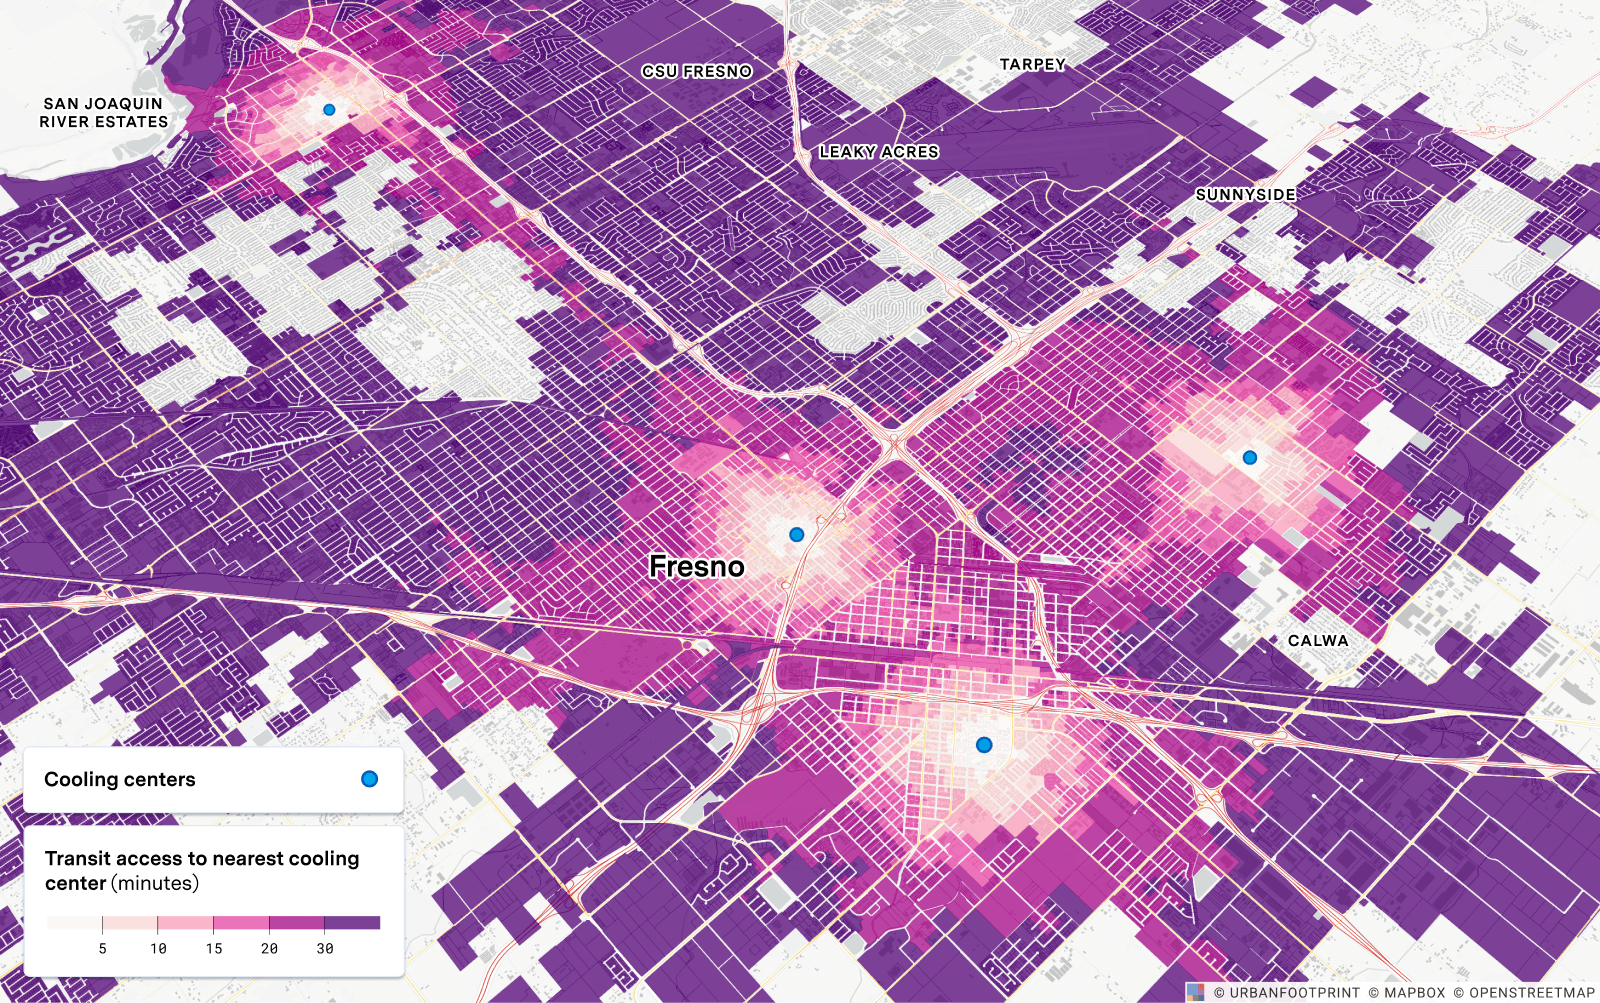
Siting a Critical Emergency Facility
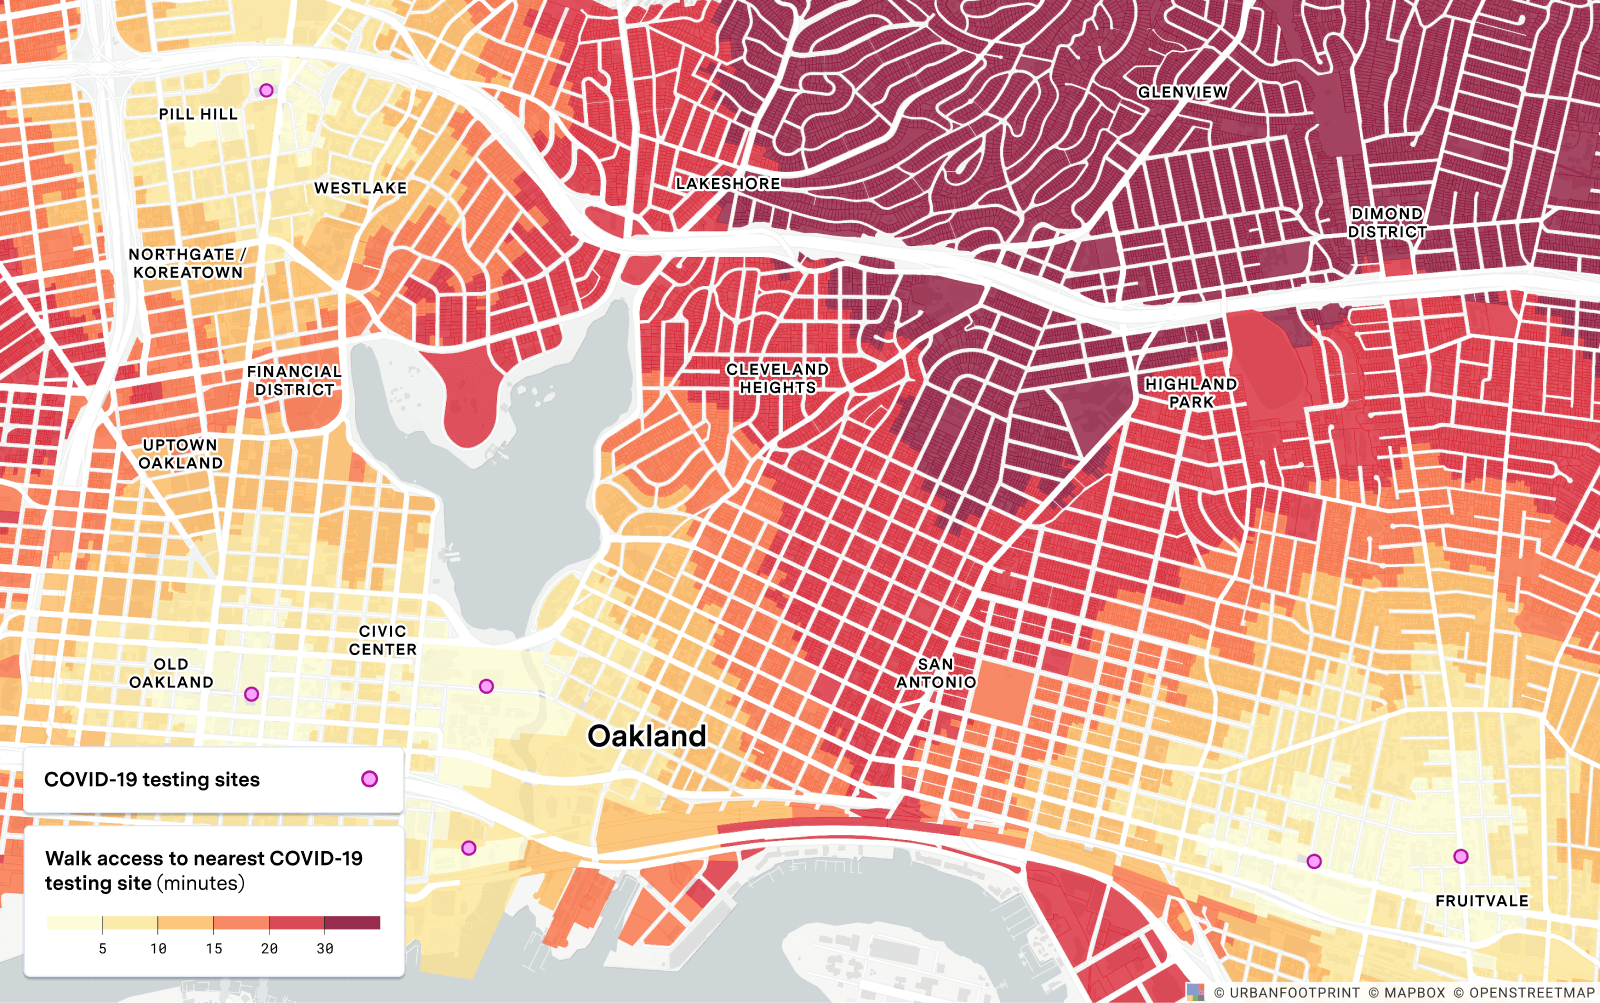
In response to compounding public health crises—COVID-19 and natural disasters exacerbated by climate change (heat waves, wildfires, flooding, etc.)—many state and local agencies are looking to identify gaps in access to aid and emergency facilities (such as cooling centers or community resilience centers). With UrbanFootprint Custom POIs, public agencies can quickly measure access to existing sites and compare results for potential new sites.
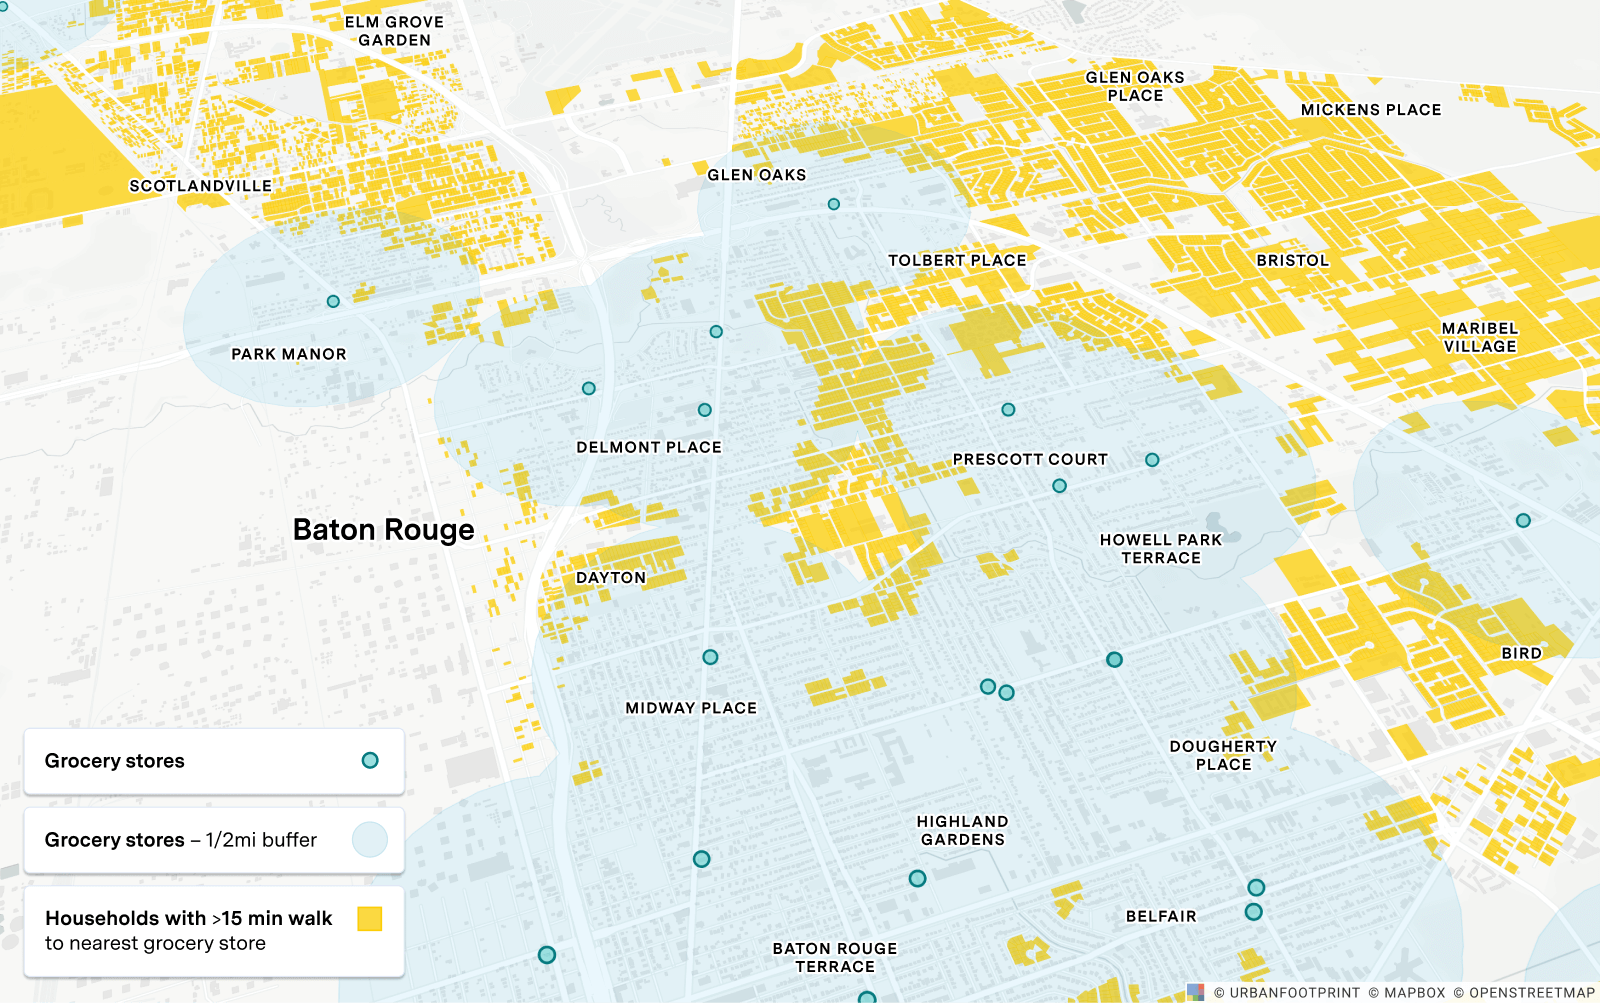
Measuring Access to Grocery Stores
Another use case especially relevant to efforts at relieving food insecurity worsened in many communities by the COVID-19 pandemic is measuring accessibility to grocery stores and food outlets. In this case we can use the locations of supermarkets (now a preloaded data layer in UrbanFootprint) as Custom POIs whose walk and transit accessibility we can measure. If we then intersect those results with key socioeconomic data, we can map where residents face compounded challenges in a particular area.
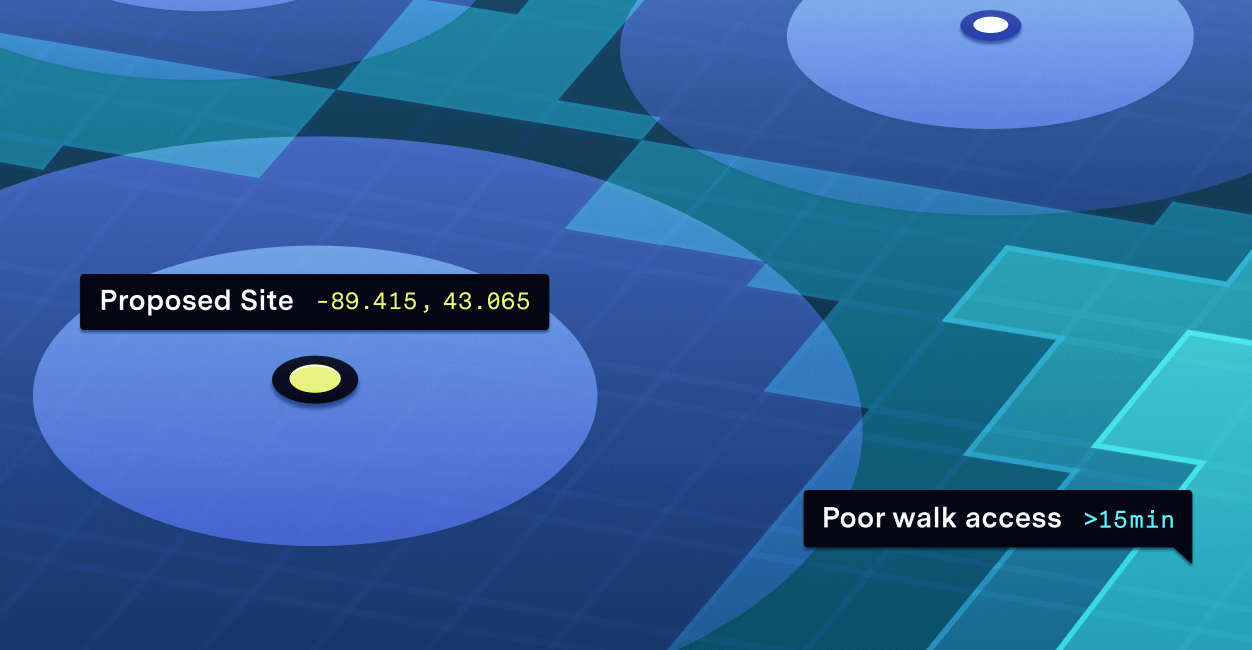
Planning a New Transit Stop or Mobility Hub
Planning a new transit stop or mobility hub is often done to address gaps in accessibility within a particular area. UrbanFootprint can be used first to locate where those gaps exist, by measuring walk access to existing stops or hubs. This enables us to identify all the parcels in the area that are far (more than a 10-minute walk) from those stops. With that information, we can then begin proposing locations for new stops or hubs. By designating the proposed sites as Custom POIs, we can measure and compare their walk accessibility to make a more informed choice of site selection. (Please note that designating a transit stop as a custom POI does not actually register it as an official transit stop in UrbanFootprint’s transit accessibility or transportation modeling. The Custom POI designation is limited only to an assessment of access to stops.)
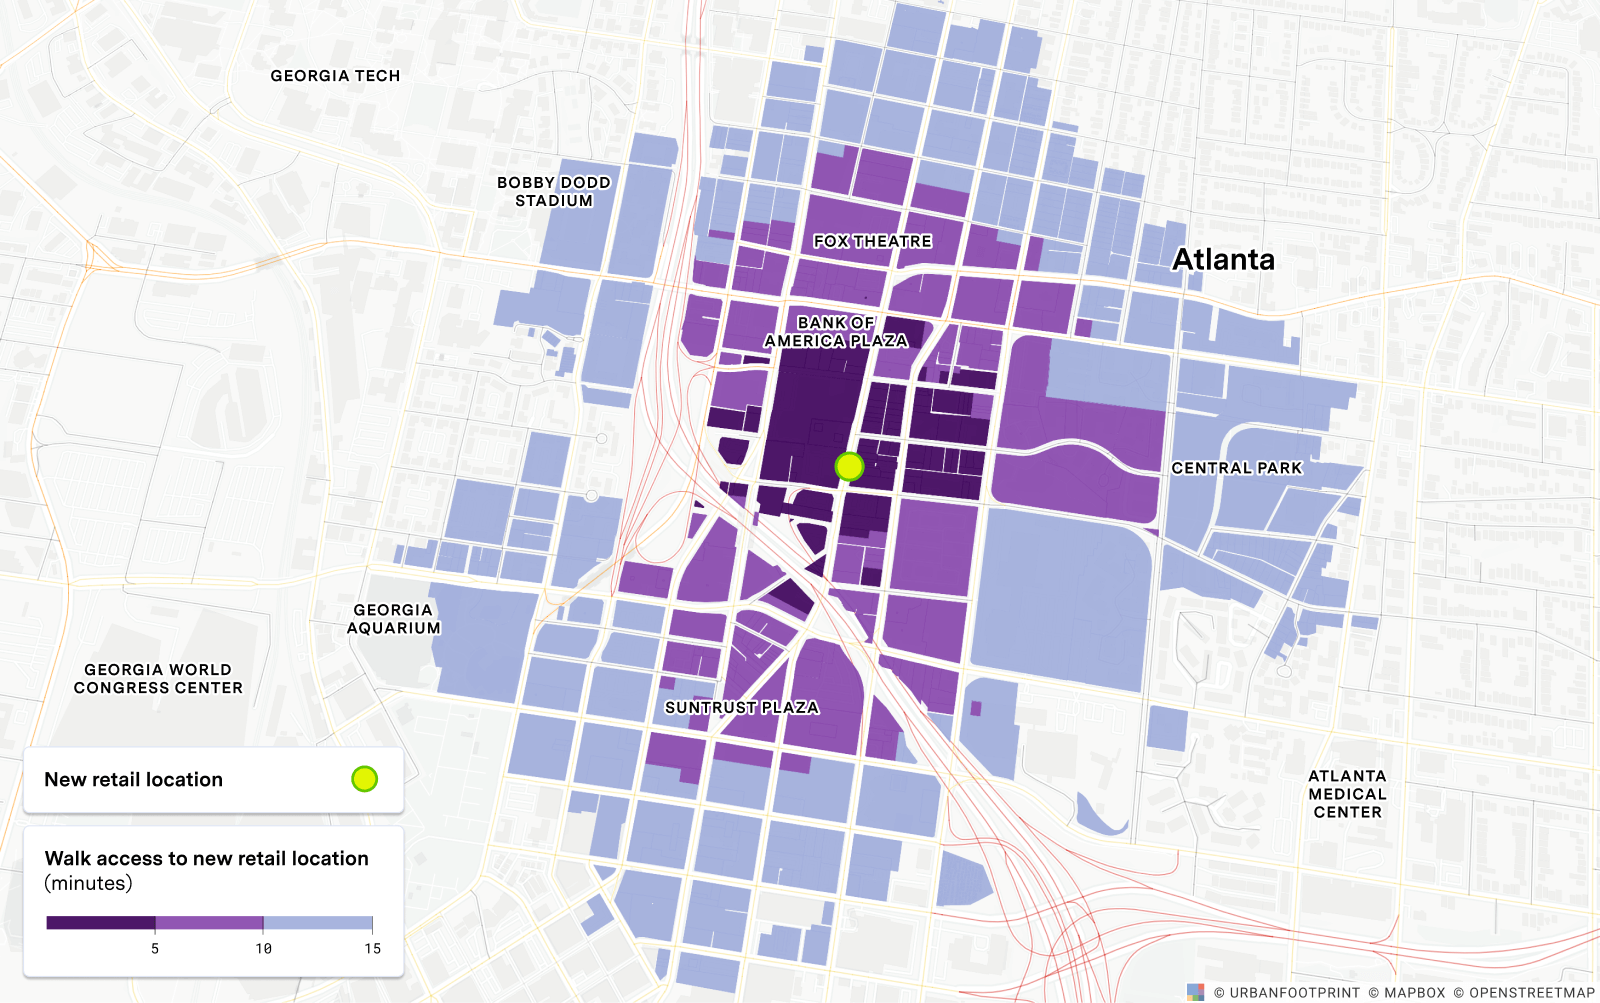
Evaluating a New Retail or Business Location
As increasingly more retail and business operations move online, there’s greater pressure on brands to justify their brick-and-mortar locations. In the current climate, this has taken on even greater significance. Today’s business owners and commercial developers want to ensure their next location or development is cost-effective, attractive, and accessible to customers, and ultimately supportive to long-term business growth. UrbanFootprint can be used to determine the most cost-effective locations by identifying qualifying parcels and examining property values and current zoning. Once a new location is identified, we can then designate it as a Custom POI to analyze for walk, transit, and/or automobile accessibility, and then intersect it with a data layer showing the proximity of the targeted demographic of potential customers.
Now that we’ve covered a few example use cases, here’s a quick overview of the new capabilities and how to get started with Custom POIs in UrbanFootprint.
Measuring Access to Any Preloaded Point Dataset
UrbanFootprint comes preloaded with a comprehensive library of point-of-interest datasets. Before Custom POIs, UrbanFootprint users could measure access to a set of preloaded parks, schools, hospitals, retail destinations, and transit stops. Now, you can quickly run a walk or transit access analysis for any preloaded point dataset. Examples include:
- Landmarks
- Places of employment
- Schools & Universities
- Hospitals & Medical Centers
- Parks & Open Spaces
- Transit stops
- Supermarkets (new)
- Daycare centers (new)
- Historic places (new)
- Airports (new)
- COVID-19 testing sites (new)
- Nursing homes (new)
- And many more!
Measuring Access to/from a Specific Point or Selection of Points
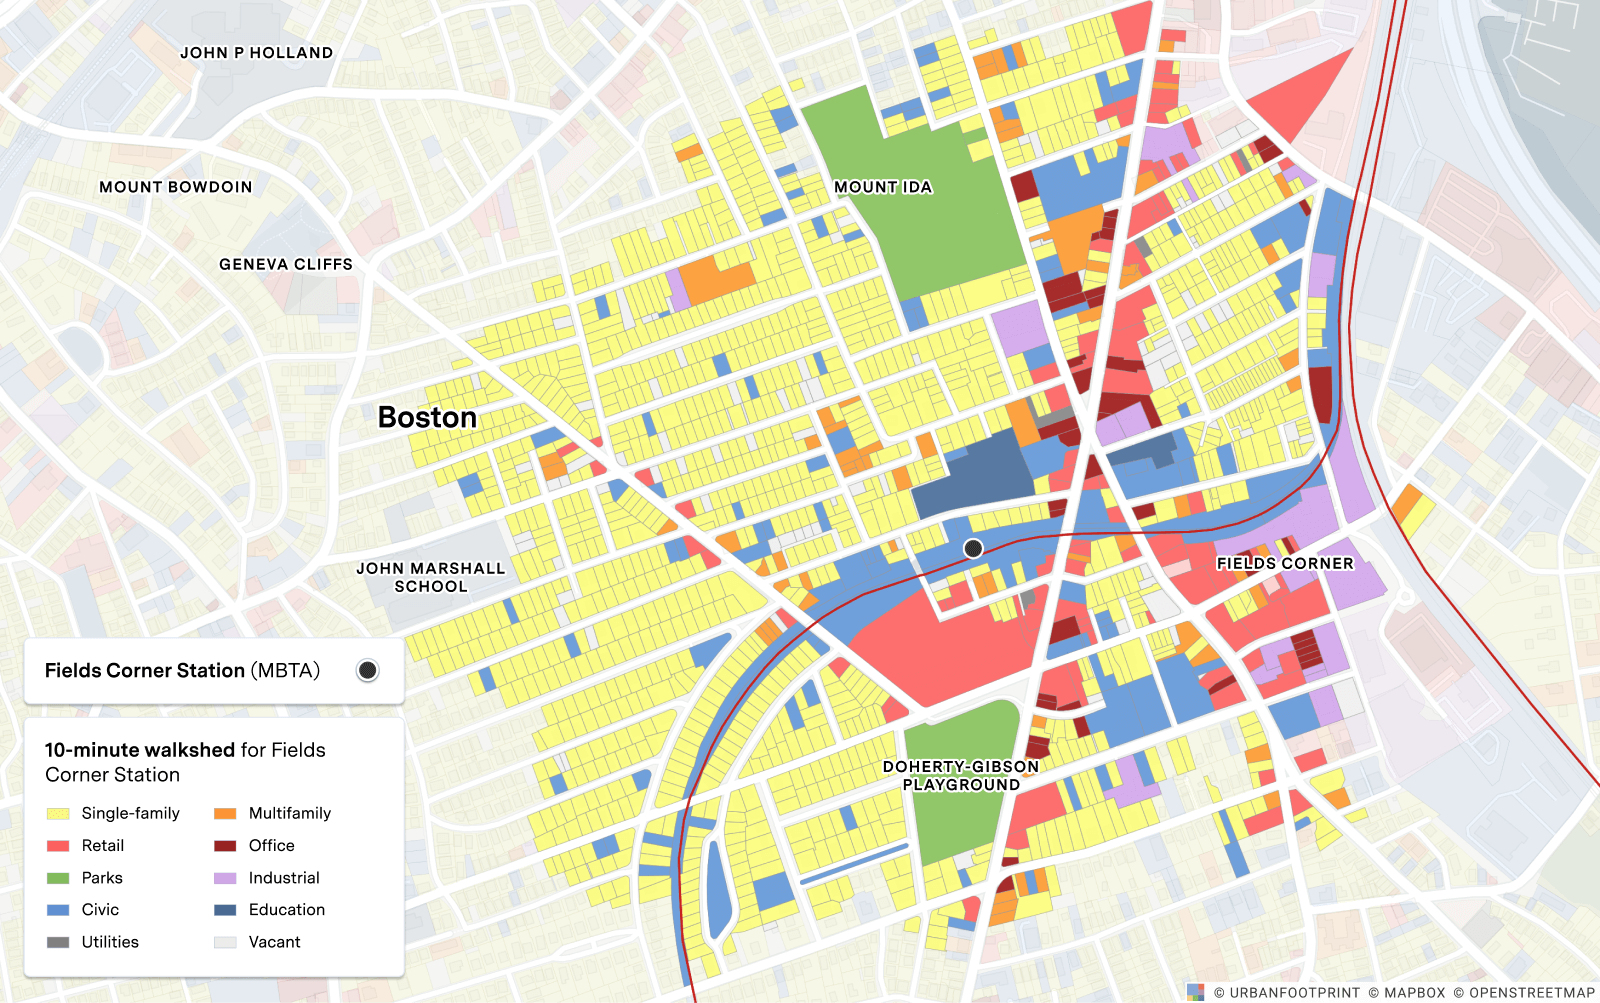
Another capability that Custom POIs offer is to run a walk or transit access analysis on a single point within a data layer. This allows you to measure access to or from a specific location of your choosing. This means that for specific sites, you could produce walkshed (or transit shed) maps along with metrics for population, housing, and employees that fall within specified walk or transit times. For example, from a reference layer of transit stations, you could select a single station from which to map a 10-minute walkshed, clearly highlighting all the parcels that fall within that walkshed.
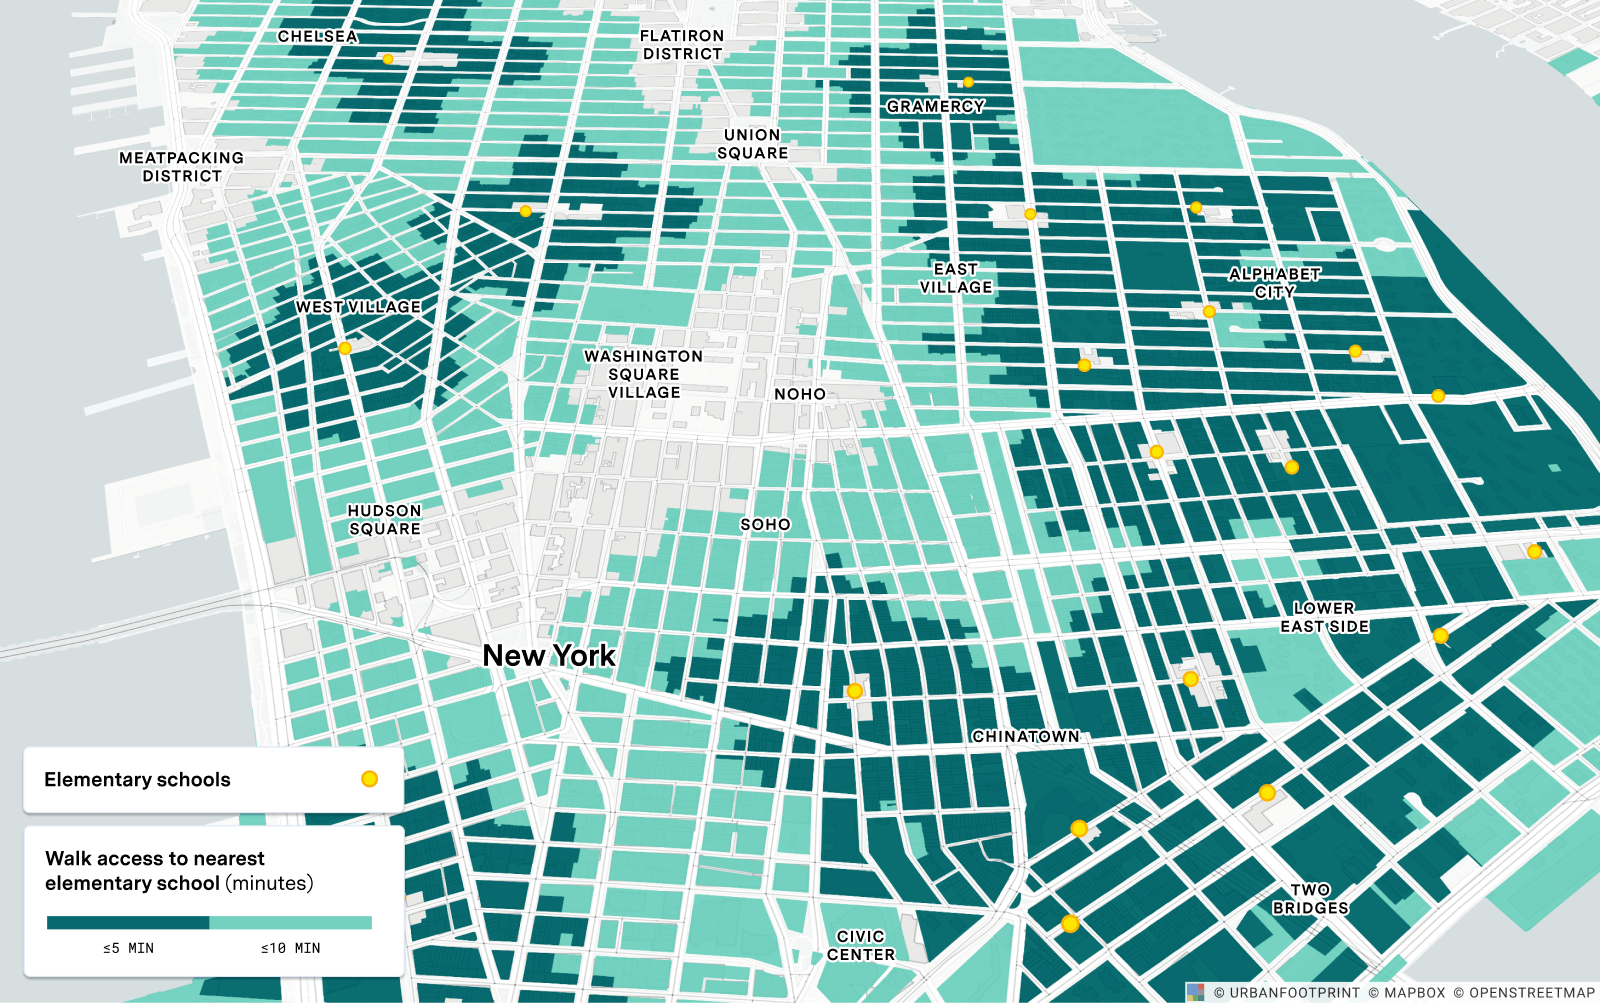
That same capability can be applied to a subset of destinations by running an accessibility analysis on a saved selection of points from a data layer. For example, you could measure walk access specifically to elementary schools rather than to all schools in general. In that case, you’d identify the schools in your chosen subset, create a saved selection from the school reference layer, and then run the analysis on that selection.
Uploading Your Own Point Datasets to Evaluate Accessibility or Site Suitability
Finally, true to its namesake and empowering users even further, the new Custom POI feature offers the ability to upload your own POI data layer into UrbanFootprint as a GeoJSON file. This brings a whole new level of choice and customization to points of interest and expands your accessibility analysis to include entirely new destinations. Any data layer consisting of point features can be used as an input.

Custom POIs: More Versatility for Mapping Accessibility in Your Projects
Whether you’re looking to site a new development, emergency facility, or measure access to a specific location or saved selection of places, Custom POIs serve a wide range of use cases. Ready to get started? Book a demo to see it in action or read our short how-to guide to learn more.
Have questions or feedback? Let us know. We’d love to hear from you.
