


If you’re interested in creating a project like this, let us know!
California’s 2017 wildfire season stands as one of the most destructive on record. Over 9,000 fires burned more than 1.2 million acres, destroying 10,800 structures and tragically taking the lives of at least 46 people.
And sadly, Californians are already experiencing another severe wildfire season in 2018. As of August 26th of this year, CALFIRE has responded to 4,434 fires, roughly 260 more than this time last year. The active Mendocino Complex Fire has also surpassed last year’s Thomas Fire as the largest wildfire in California history.
While no single weather event can be solely attributed to climate change, many scientists contend that climate change has already played a role in shaping longer, more intense fire seasons. In fact, a recent Columbia University study found anthropogenic climate change to be one of the primary factors of increased wildfires, responsible for an estimated additional 4.2 million hectares of forest burned between 1984 and 2015. Although there are still many uncertainties as to exactly how climate change will impact future wildfire seasons, it’s safe to bet rising temperatures, longer droughts, earlier springs, and the resulting abundance of dry vegetation are setting the trend for increased fire risk in the American West.
As cities and towns nationwide brace for the impacts of increasing fire risk, how can planners better prepare and support community resilience?
In the last two installments of our Planning for Resilience blog series, we’ve covered resilience planning for sea level rise and flood risk. In part three of our series, we discuss the challenges of planning for fire risk and recovery, and how UrbanFootprint’s Risk and Resilience Module is designed to help planners build smart climate adaptation and resilience plans, featuring the case study of Sonoma County, California.
Disconnected Data: The Roadblock to Mapping and Measuring Fire Vulnerability
In the State of California, the California Department of Forestry and Fire Protection, CALFIRE, maps Fire Hazard Severity Zones based on fuels, terrain, weather, and other relevant factors. These areas are classified into three zones: Moderate, High, and Very High. While CALFIRE data provide an essential baseline for assessing and mapping fire hazard zones, the real challenge for planners is often aligning this information with current and future land use data to estimate fire risk. Beyond mapping fire hazard levels, planners must be able to evaluate who and what is most vulnerable, including population, housing, employment areas, and more.
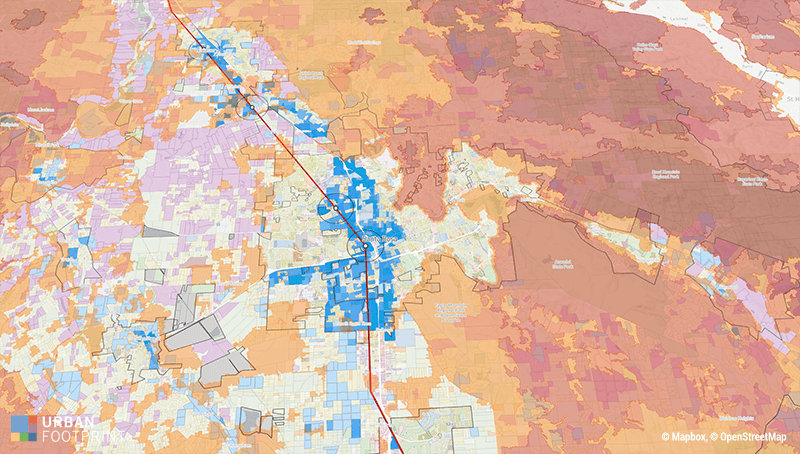
The UrbanFootprint map below displays CALFIRE’s Fire Hazard Severity Zones for Sonoma County, a jurisdiction of nine cities in Northern California and tragically the site of some of the most destructive and deadly wildfires in California history last year. The map also shows the homes destroyed in the wildfires last October in blue.
As Chris Barney, Senior Transportation Planner at the Sonoma County Transportation Authority notes: “As we can see here, a lot of the housing that was lost was already in high fire hazard areas. As we plan for the future, it will be critical to use this information to guide our recovery efforts.”
Using Data to Guide Community Recovery
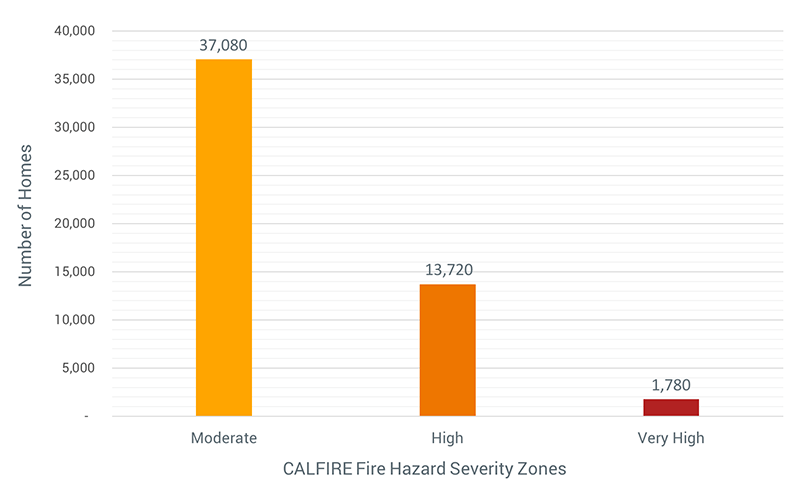
With easily accessible fire hazard data and the ability to align this with key planning datasets we can better understand which communities are most at risk and clearly communicate the potential impacts of land use choices. For example the UrbanFootprint chart below displays the number of Sonoma County homes currently in the moderate, high, or very high fire hazard zones.
Number of Sonoma County Homes Currently in a Fire Hazard Area
Of course, fire risk has long been a factor of living in the American West and modeling fire hazards cannot fully eliminate this risk, yet it can provide planners and community stakeholders with better directional information to more accurately weigh and mitigate the risk as much as possible.
A key part of the Sonoma County resilience planning efforts will include planning for new housing to both support community recovery and to address the ongoing housing shortage in California. Just an hour’s drive north of the San Francisco Bay Area, Sonoma has not been exempt from the impacts of soaring job growth and sluggish housing development. In an effort to tackle the acute housing shortage, further exacerbated by last year’s wildfires, Sonoma County has set a goal to build 30,000 new housing units in the next five years – 25,000 more than the 5,000 homes lost in the fires.
As Barney notes, “This is an ambitious goal and there are a lot of questions surrounding how we will achieve and implement it. As we evaluate different ways to approach this critical issue, we’re using UrbanFootprint to help us dig into the key impacts of our housing development choices, such as household travel costs, accessibility, vehicle miles traveled, emissions, water use, and more. In addition, we are of course considering all of this through the lens of mitigating fire risk and planning for community recovery, as well.”
Choosing the location and development pattern of 30,000 new housing units is no small feat and stands to greatly impact the Sonoma County community. How can Sonoma County best address the housing crisis while working toward its goals of reduced greenhouse gas emissions, increased transit accessibility, and enhanced community resiliency?
Projecting Plan Impacts with Advanced Scenario Planning
UrbanFootprint was first used in Sonoma County in 2015 to analyze the transit and environmental impacts of five development and housing scenarios to accommodate for projected growth by 2040. Scenarios ranged from lower density suburban growth patterns (Scenario One) to higher density housing options with an emphasis on infill development opportunities near new Sonoma-Marin Area Rail Transit (SMART) commuter rail stations (Scenario Five).
The UrbanFootprint graphic below maps and compares fire hazard potential to the aforementioned scenarios, including existing conditions on the ground today. Note that while Sonoma County is currently analyzing housing growth options with a particular focus on mitigating fire risk and alleviating soaring housing costs, the maps below are solely for an illustrative resilience and recovery planning example.
In the exhibit above, UrbanFootprint’s built-in Base Canvas layer first displays a current land use map of Santa Rosa parcels. Additional reference layers highlight the SMART line and a half mile buffer around each SMART station. Next, the Risk and Resilience Module maps CALFIRE Fire Hazard Severity Zones for existing conditions in Santa Rosa, followed by Scenario One’s lower density development pattern, and concluding with Scenario Five’s higher density housing options focused around SMART. Blue indicates the placement of new housing units in Scenarios One and Five.
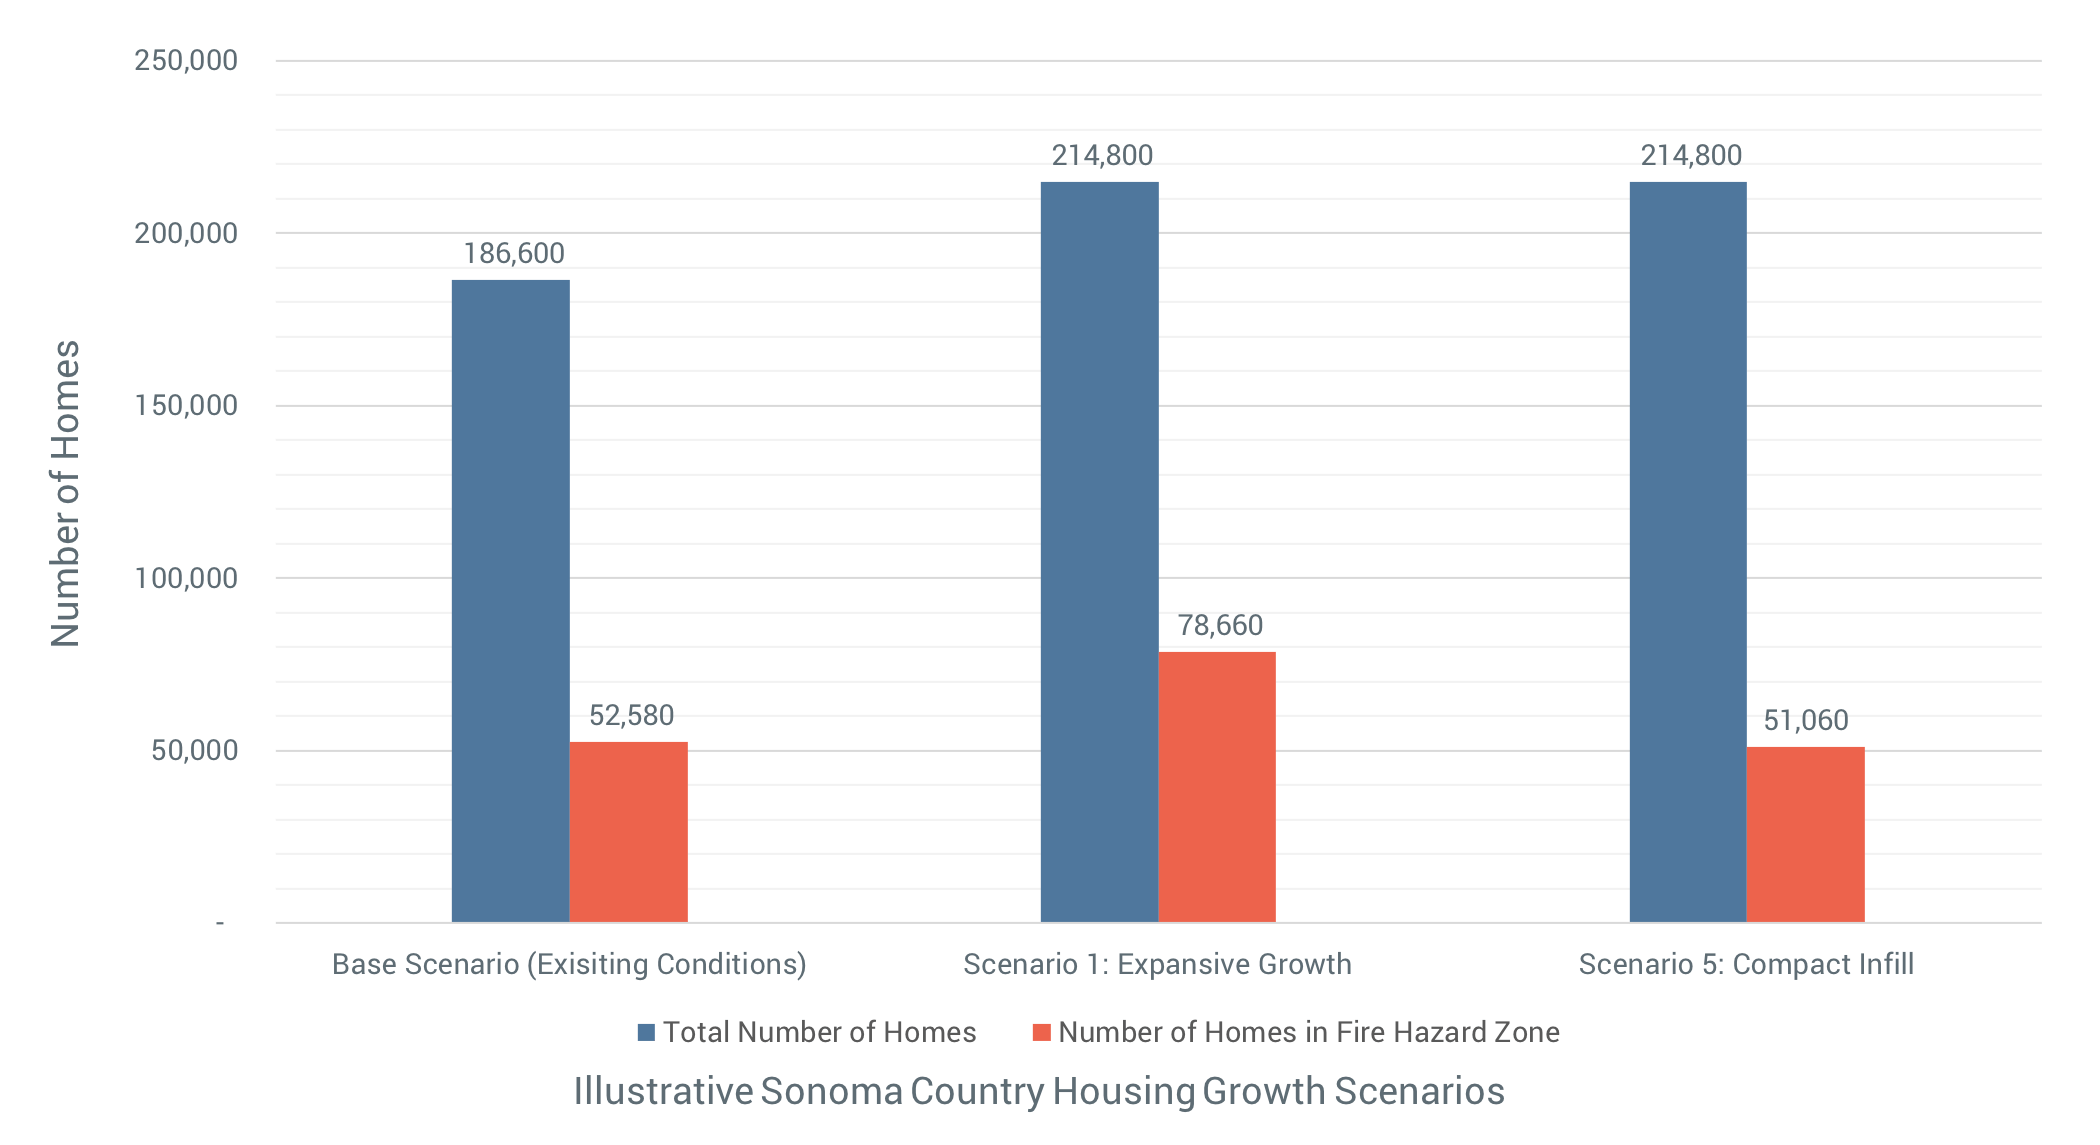
The comparative fire hazard results below speak for themselves. The lower density development pattern of Scenario One places over 26,000 additional housing units in a fire hazard area compared to Scenario Five.
Number of Homes in a Fire Hazard Area for Sonoma County Scenarios
Clearly, how and where new housing is built has the potential to greatly impact the safety and resilience of the community. And beyond fire risk, land use policy and future development patterns influence an array of factors that contribute to the long-term health, sustainability, and equity of our communities, including water use, walk access to parks, transit access to jobs, and beyond.
While this study is solely serving as an example to demonstrate the importance of data-driven resilience planning, Sonoma County is actively examining options to support new housing. As Barney shares, “We’re going to be using UrbanFootprint’s new Risk & Resilience Module, to evaluate fire hazard, flood risk, and sea level rise risk in relation to our current and future housing stock and employment areas. As we look to the future, we can better understand how we best mitigate these natural hazards and support a safe, strong, and resilient community.”
Scenario Planning for a Sustainable, Resilient Future
Scenario planning plays a pivotal role in smart resilience and recovery planning. By drafting alternative land use scenarios and measuring the impacts from all angles, planners and communities can quantify the costs and benefits of each proposed plan and support more informed policy conversations.
As Sonoma County prepares to accommodate 30,000 new housing units, the ability to build safe, resilient communities while supporting sustainable, equitable growth, requires analyzing each new housing scenario for a multitude of factors including fire hazard, transit accessibility to jobs, water use, and beyond. Running analyses like these often requires days, weeks, and even months of curating vast and disparate datasets to understand the combined impacts. UrbanFootprint’s preloaded data library and built-in analytics modules are designed to support thoughtful, informed policies and to greatly reduce the time and costs generally incurred with iterative scenario planning for resilience.
While increasing fire risk currently is a stark reality for much of the American West, planners can take measured steps to mitigate fire risk and ensure a safe, strong, and resilient future for our communities.
UrbanFootprint’s Risk and Resilience Module measures sea level rise, flood risk, and fire hazard across across the U.S. Schedule a demo with our team or start a free trial today to give it a try.
Have questions? Let us know. We’d love to hear from you. Email or tweet us your questions and feedback.
Note: UrbanFootprint map images are supported by © Mapbox and © OpenStreetMap.
