


If you’re interested in creating a project like this, let us know!
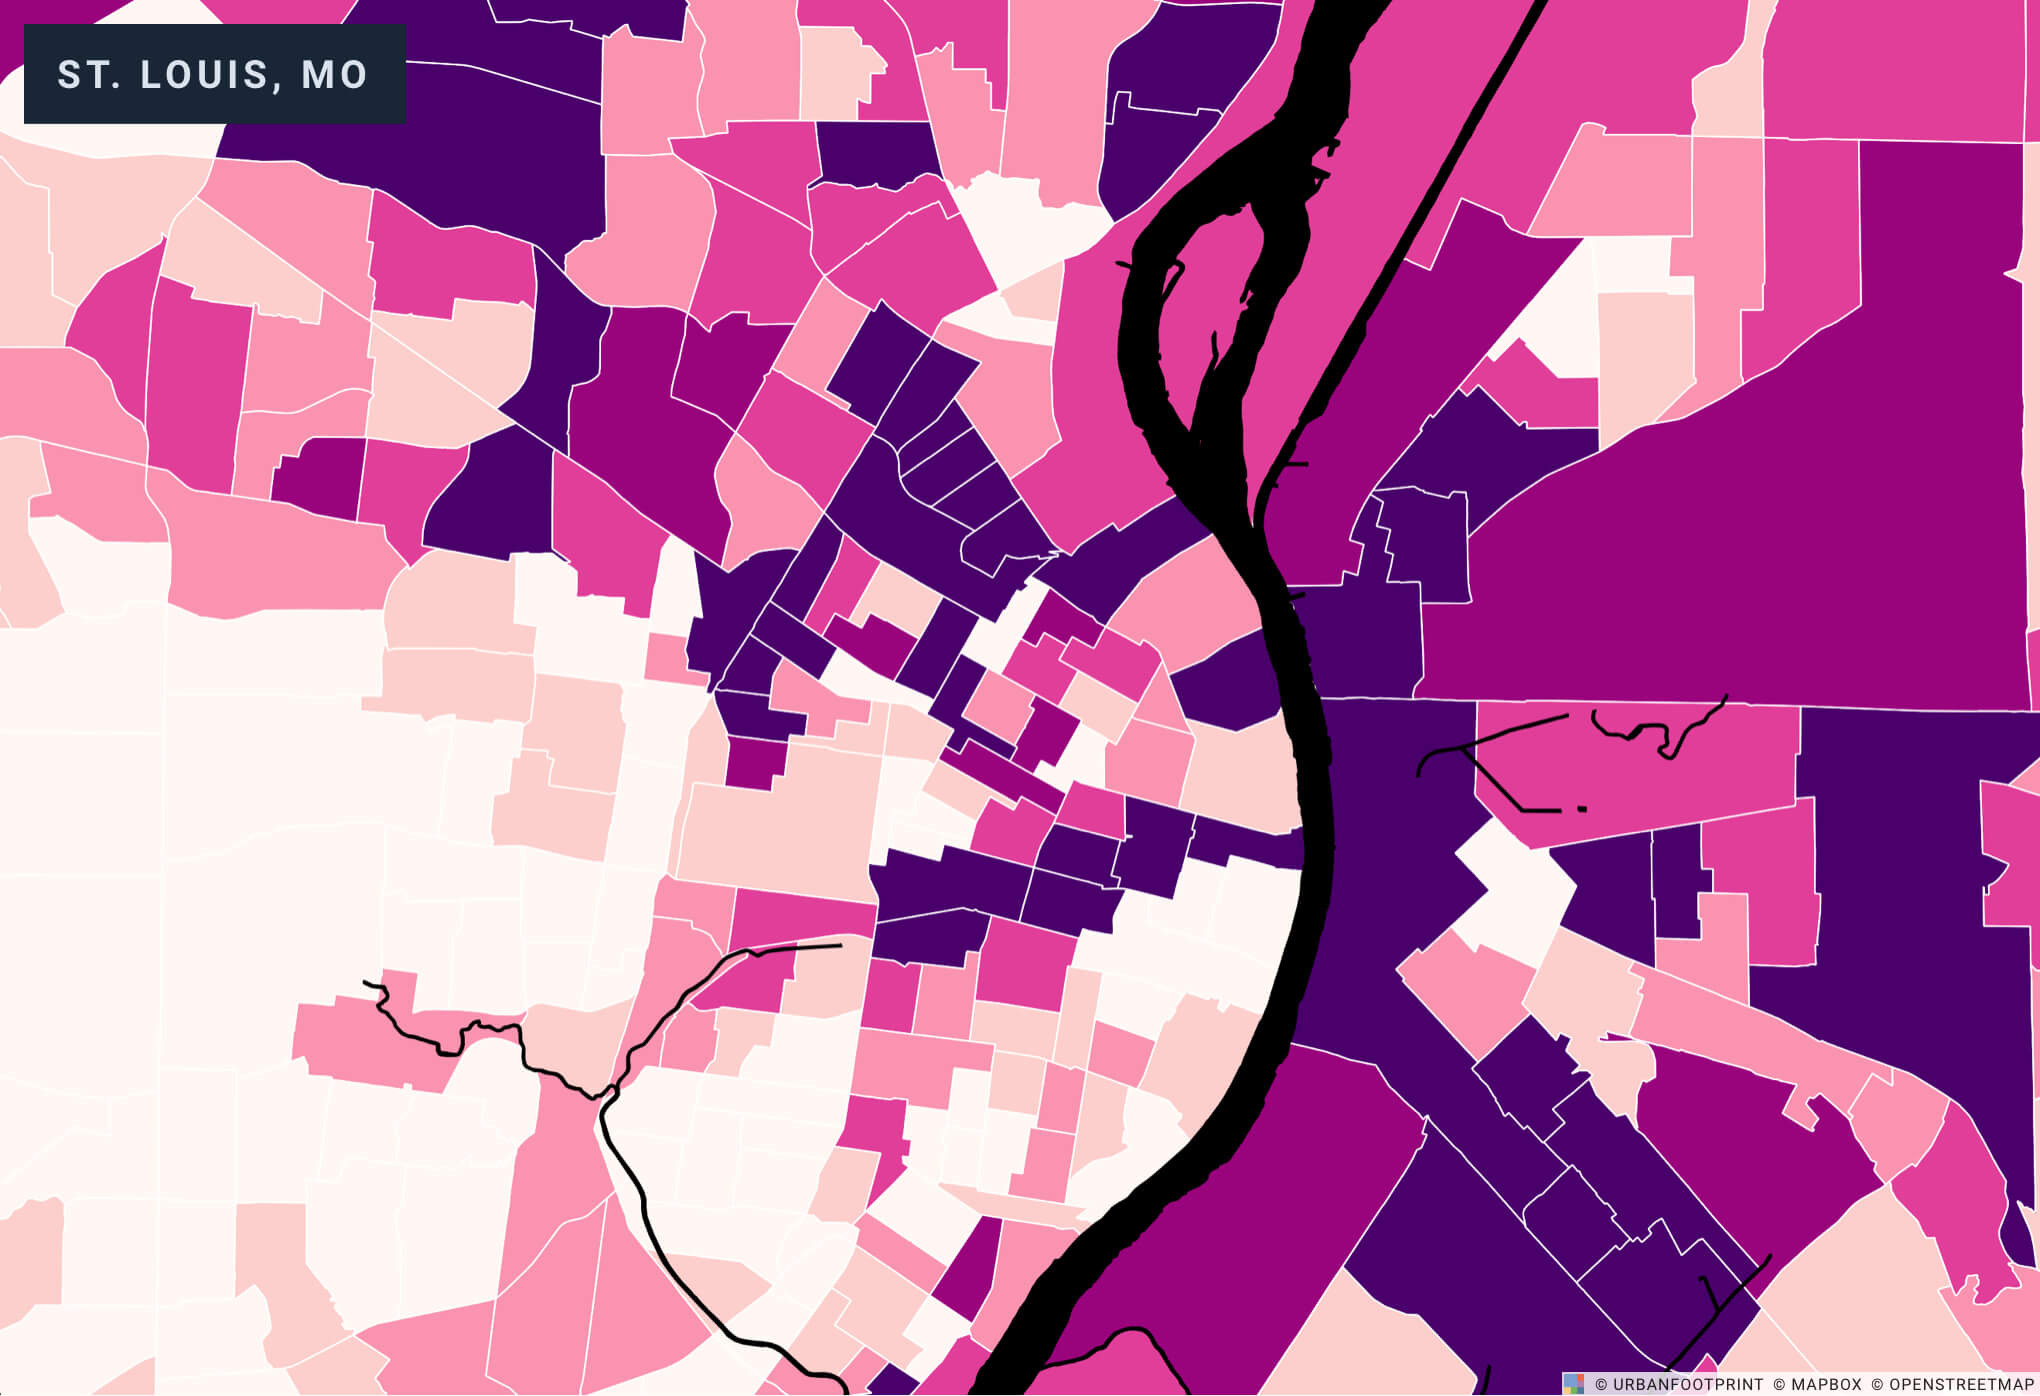
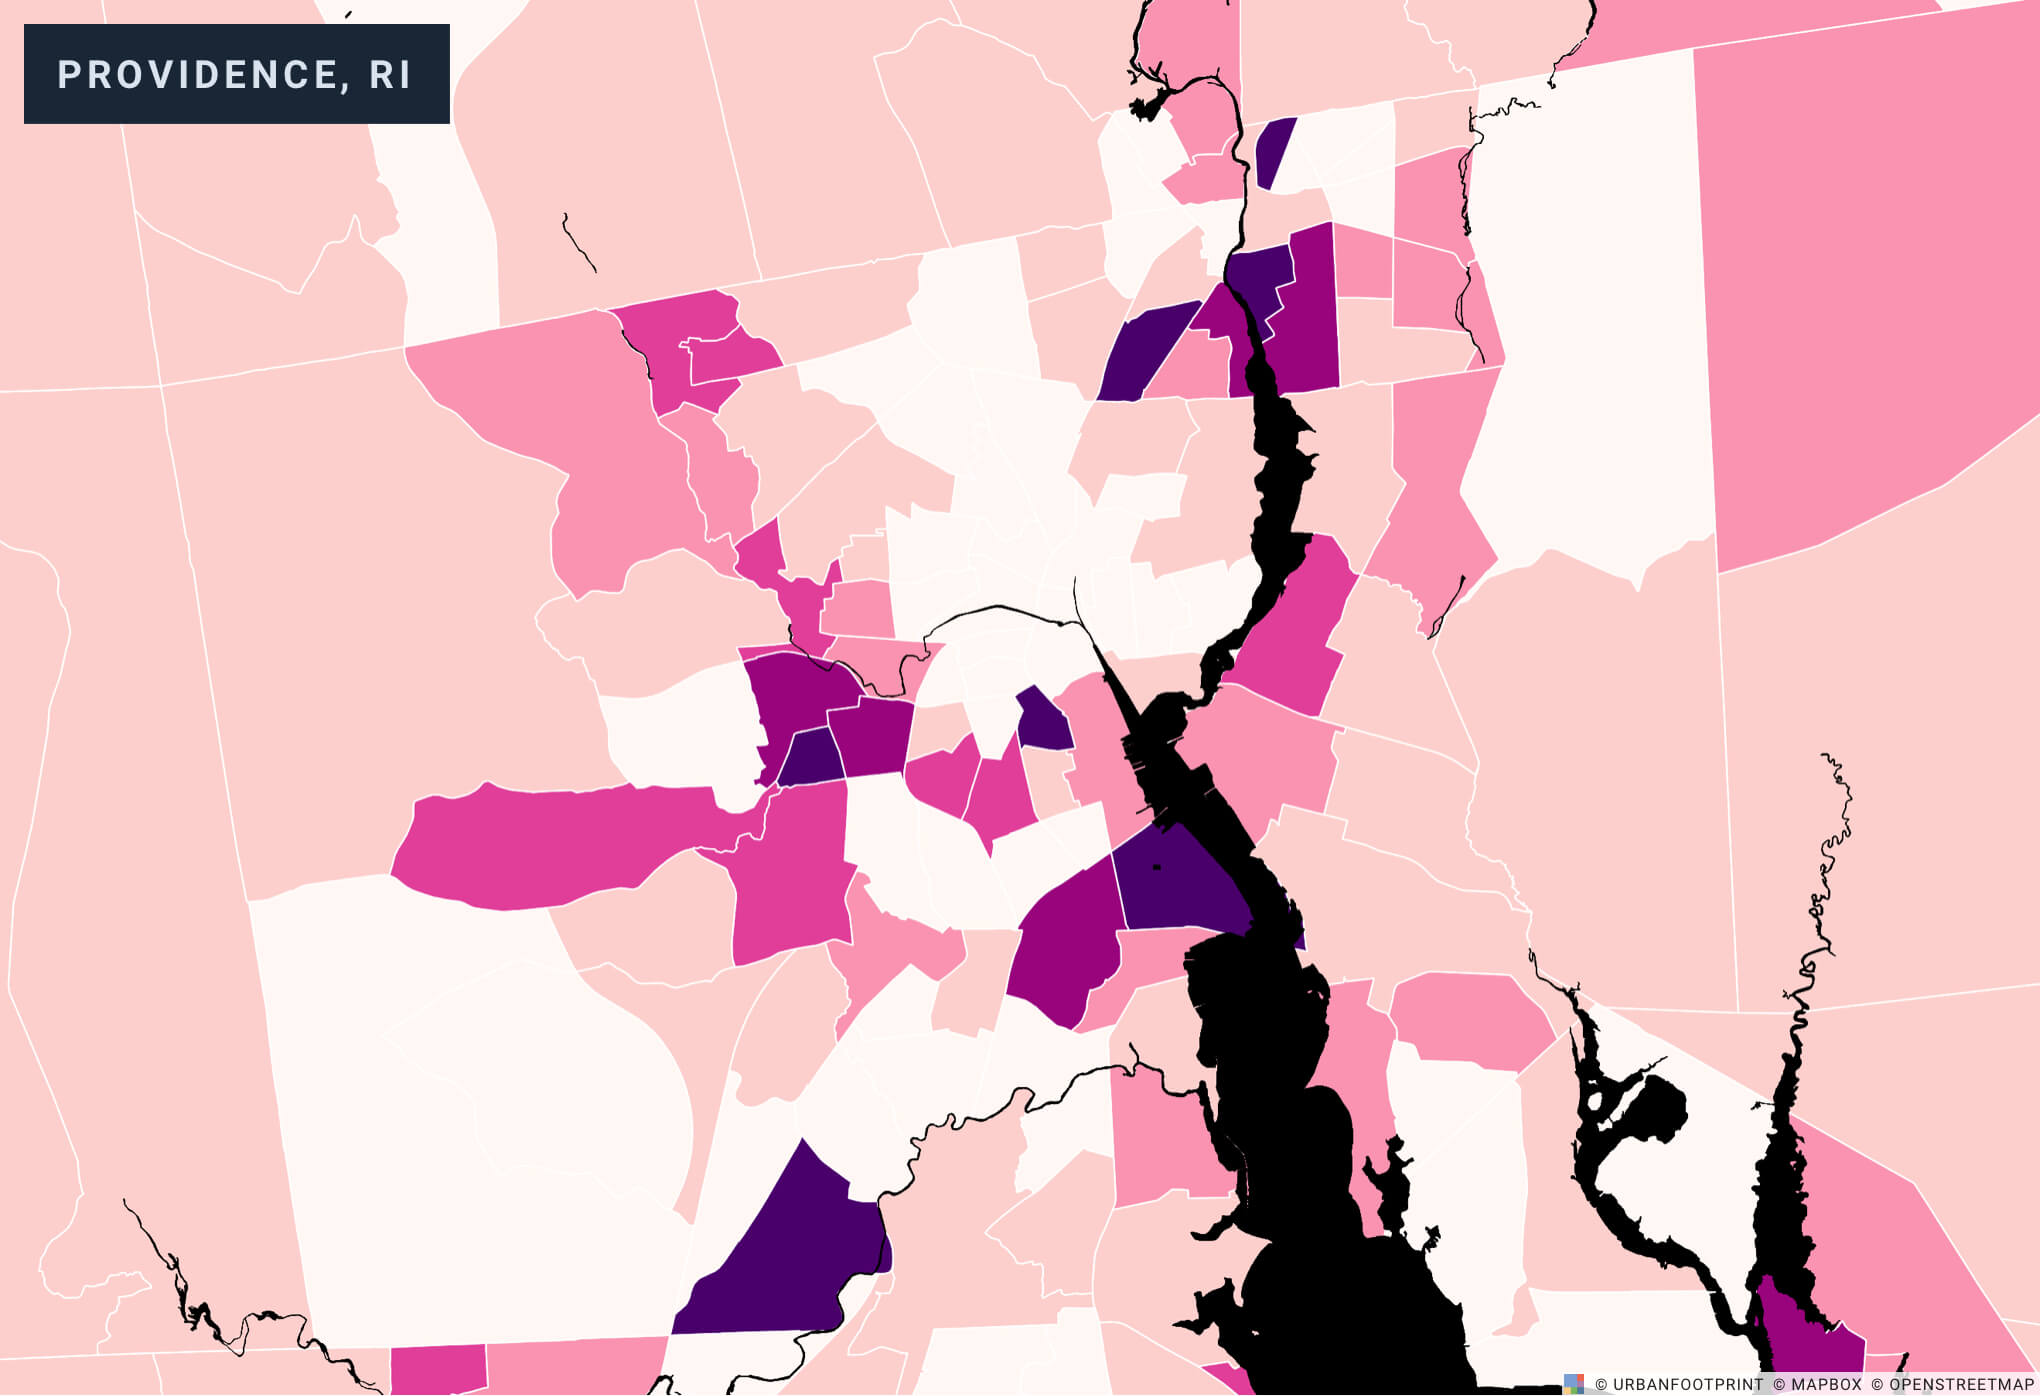
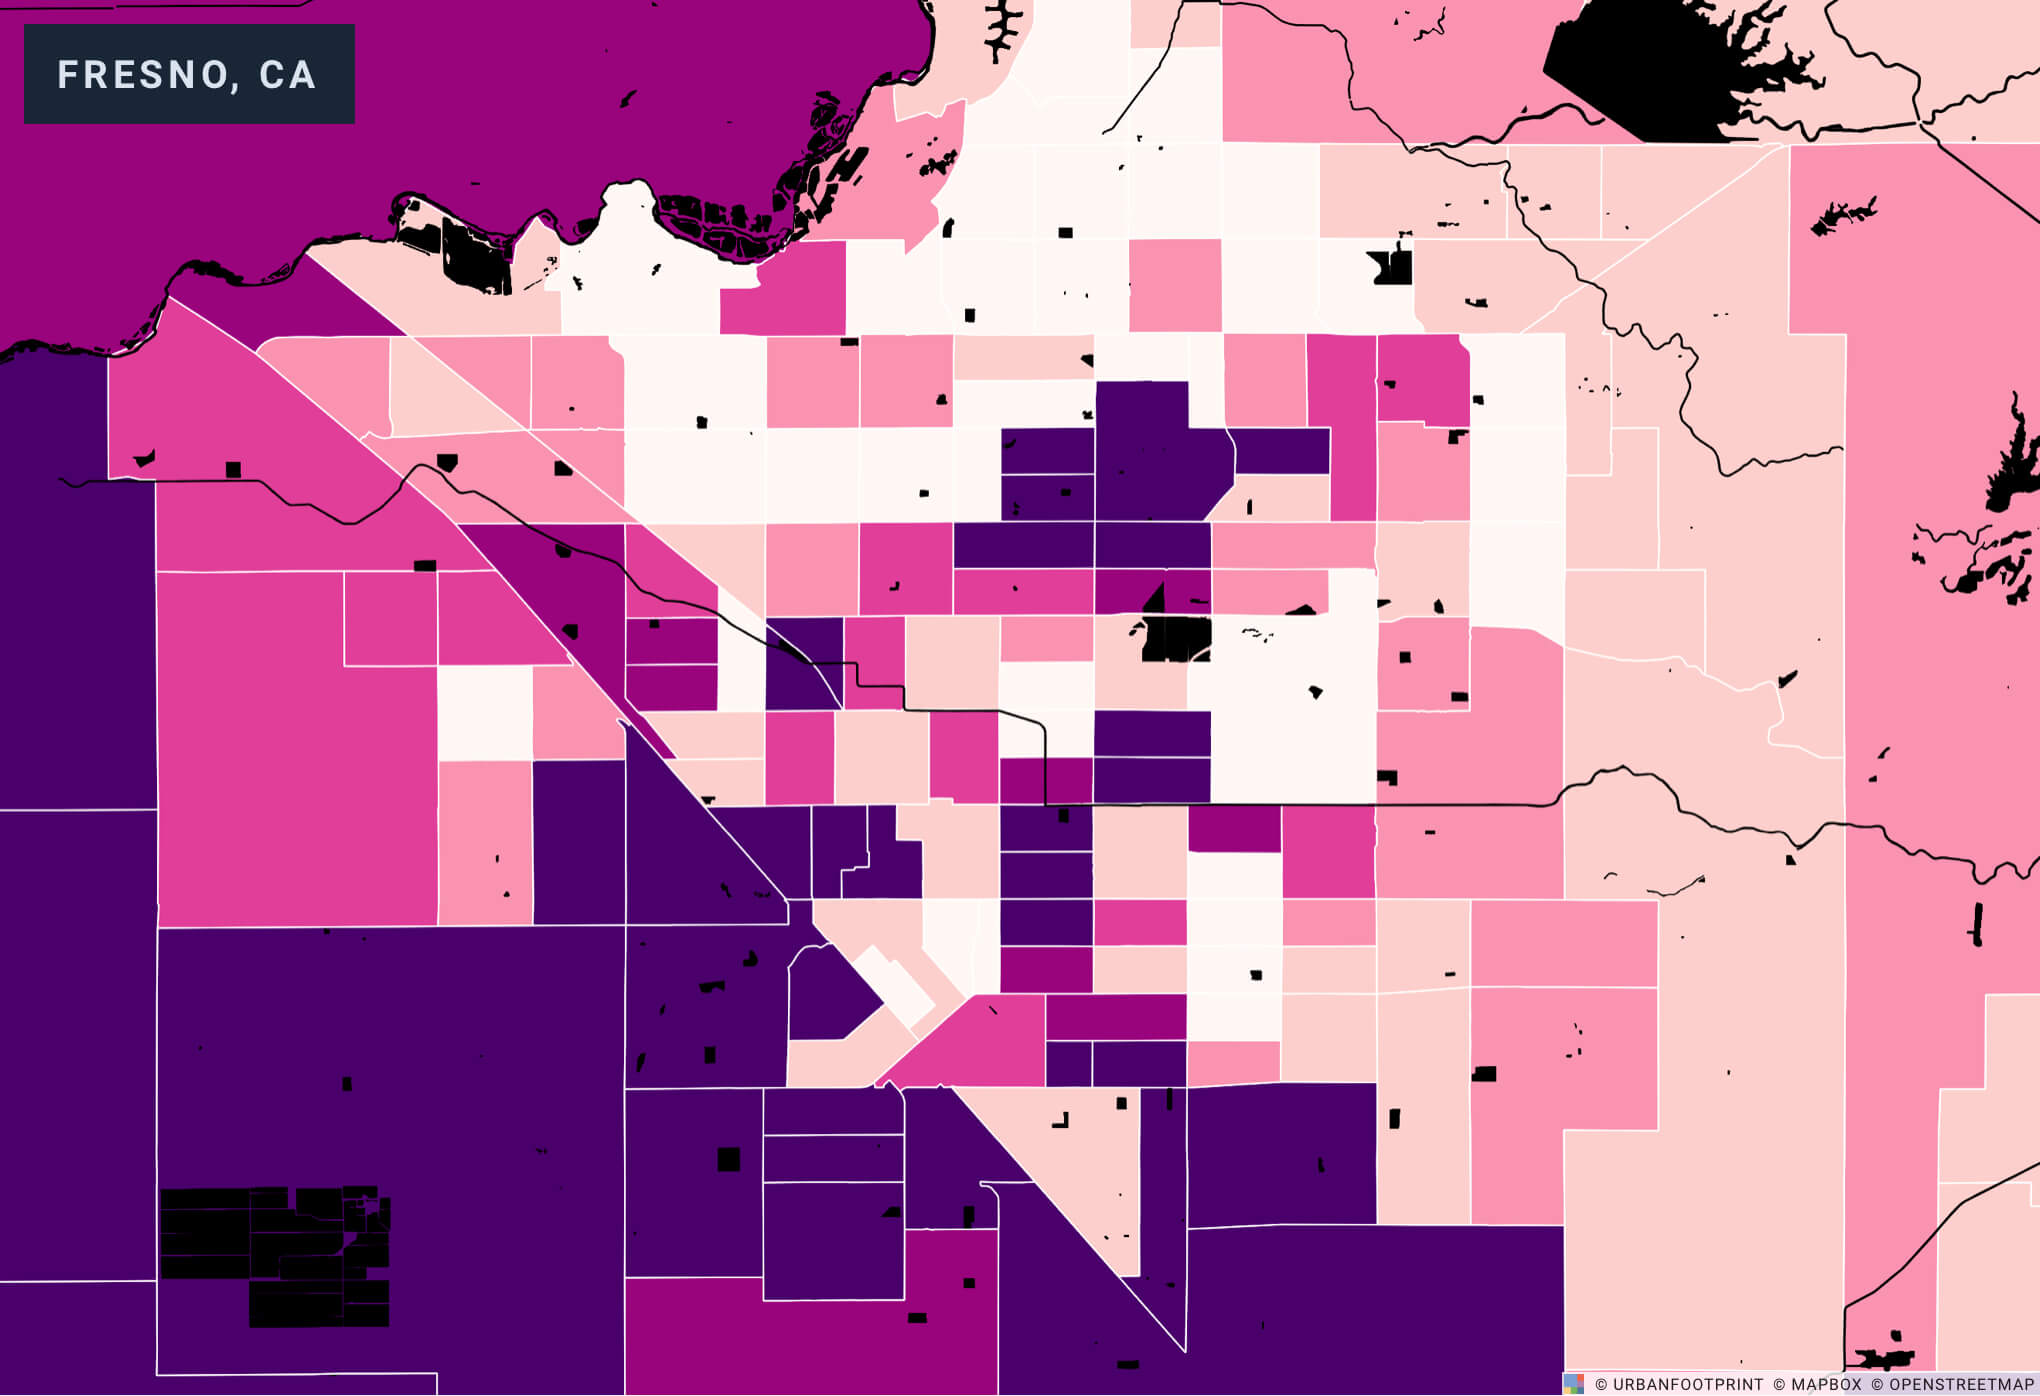
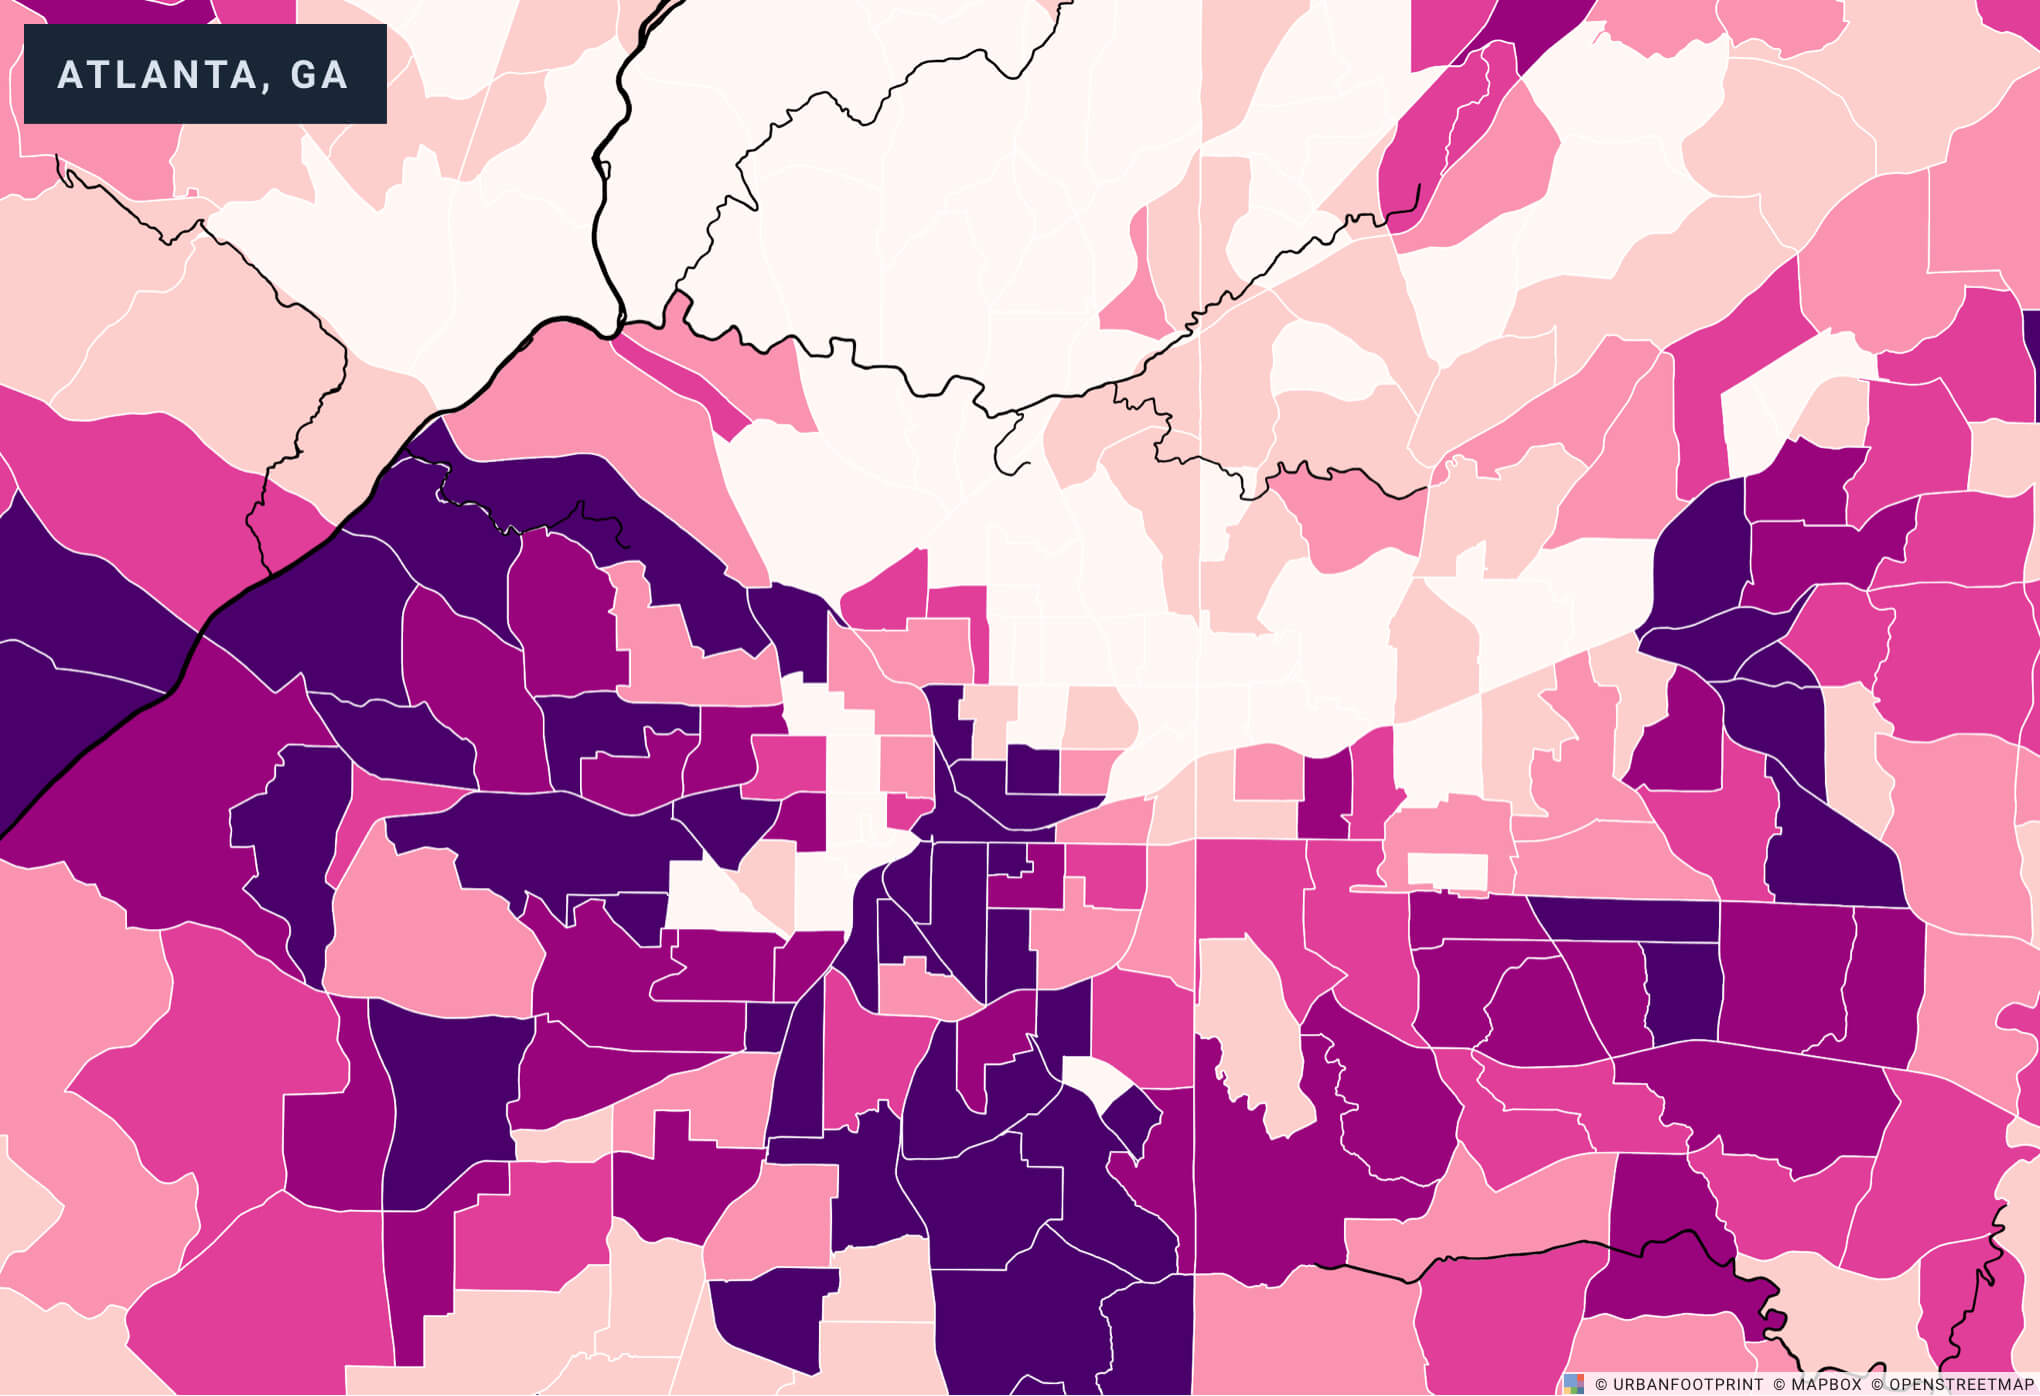

Percentage of the population that is both low-income and lives over a 1/2 mile away from a grocery store in (clockwise from top left) St. Louis, Providence, Atlanta, and Fresno.
The Food Access Research Atlas is a census tract level dataset provided by the Economic Research Services (ERS) and the US Department of Agriculture (USDA) that allows planners, academics, and community organizers to get a deeper sense of the prevailing food crisis across many of our neighborhoods.
While the downloadable data provided by the USDA is non-spatial, UrbanFootprint makes this data available for easy mapping by joining the information with census tract geometries. UrbanFootprint users can now view the 2015 dataset, pan around a region of their choice, and analyze the food access information in the context of a plethora of other datasets, including parcel-level land use information, to start comprehensively understanding food deserts in their communities or planning projects.
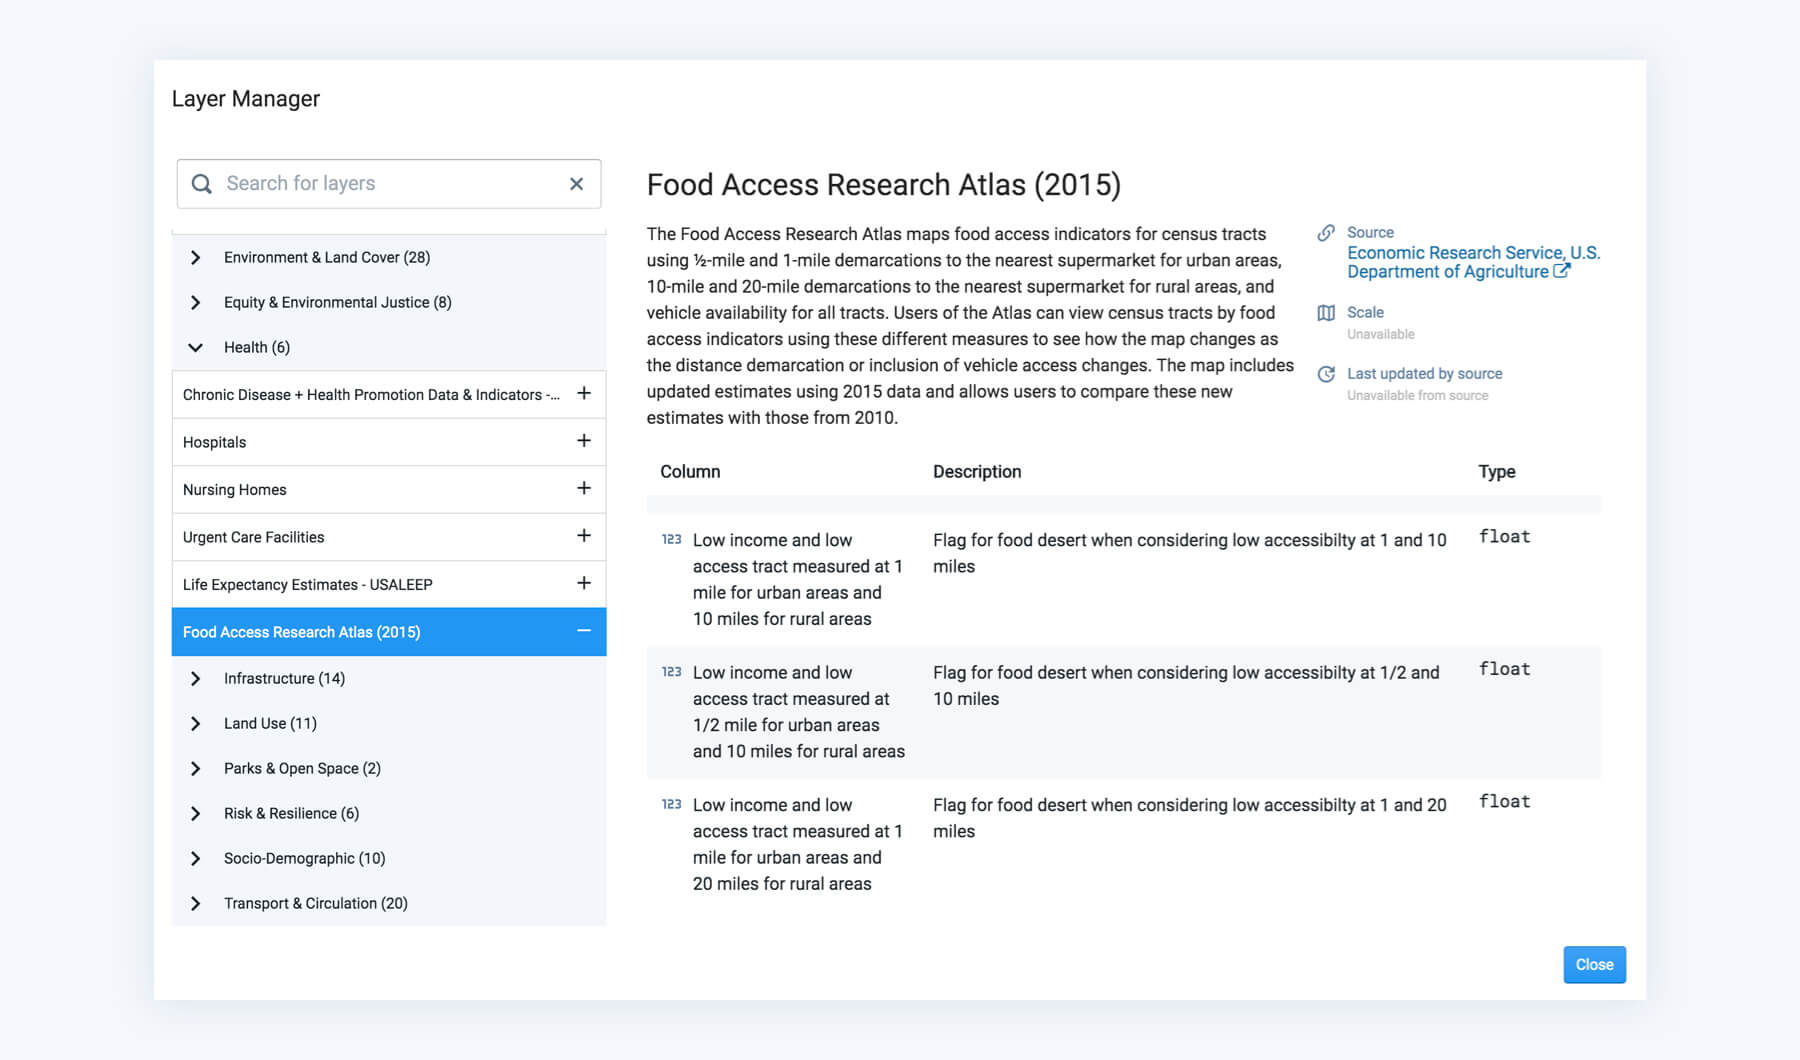
The Food Access Research Atlas dataset breaks down access to supermarkets by age, race, access to vehicles, and use of federal subsidies like SNAP (Supplemental Nutrition Assistance Program). It also provides different thresholds of measuring food access, including understanding food in both urban areas and rural areas, and also detailing access at specific distances to capture the nuances seen more in cities, ie. those living beyond half a mile, a mile, or 10 miles from supermarkets.
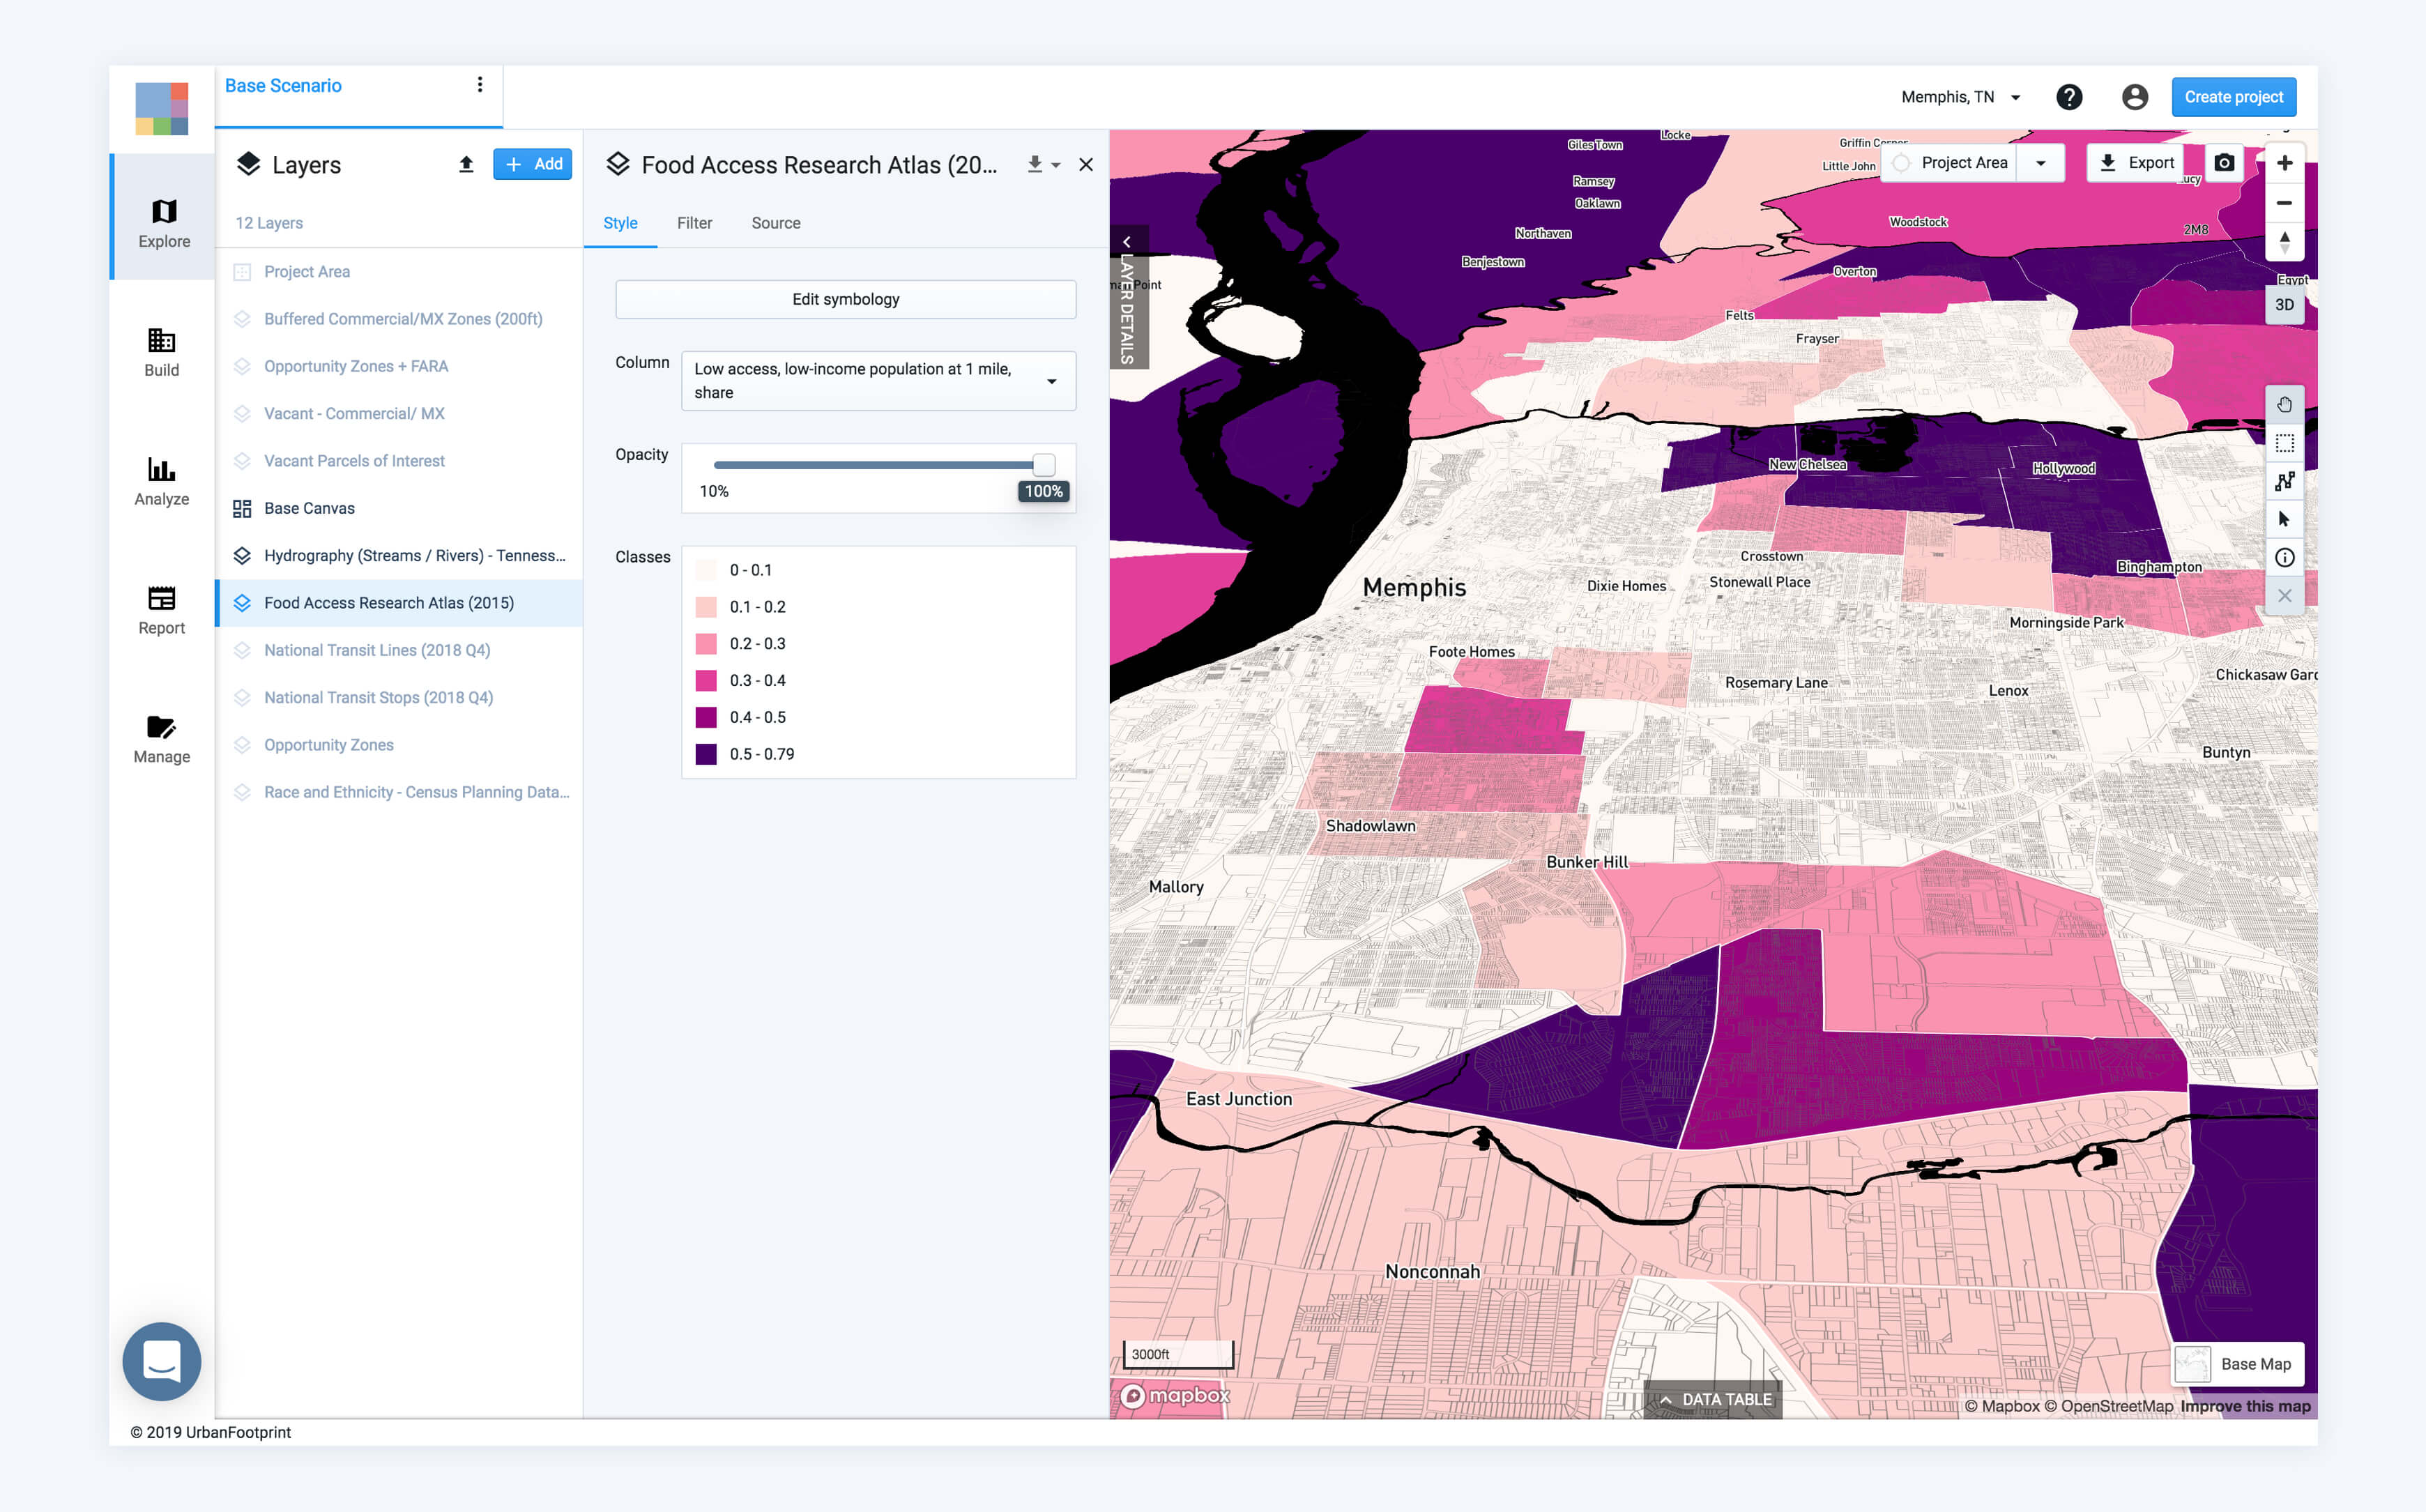
The map below shows census tracts in Memphis, TN. Here we’re mapping the percent of each census tract’s population that is considered low income and live more than a mile away from the nearest supermarket.
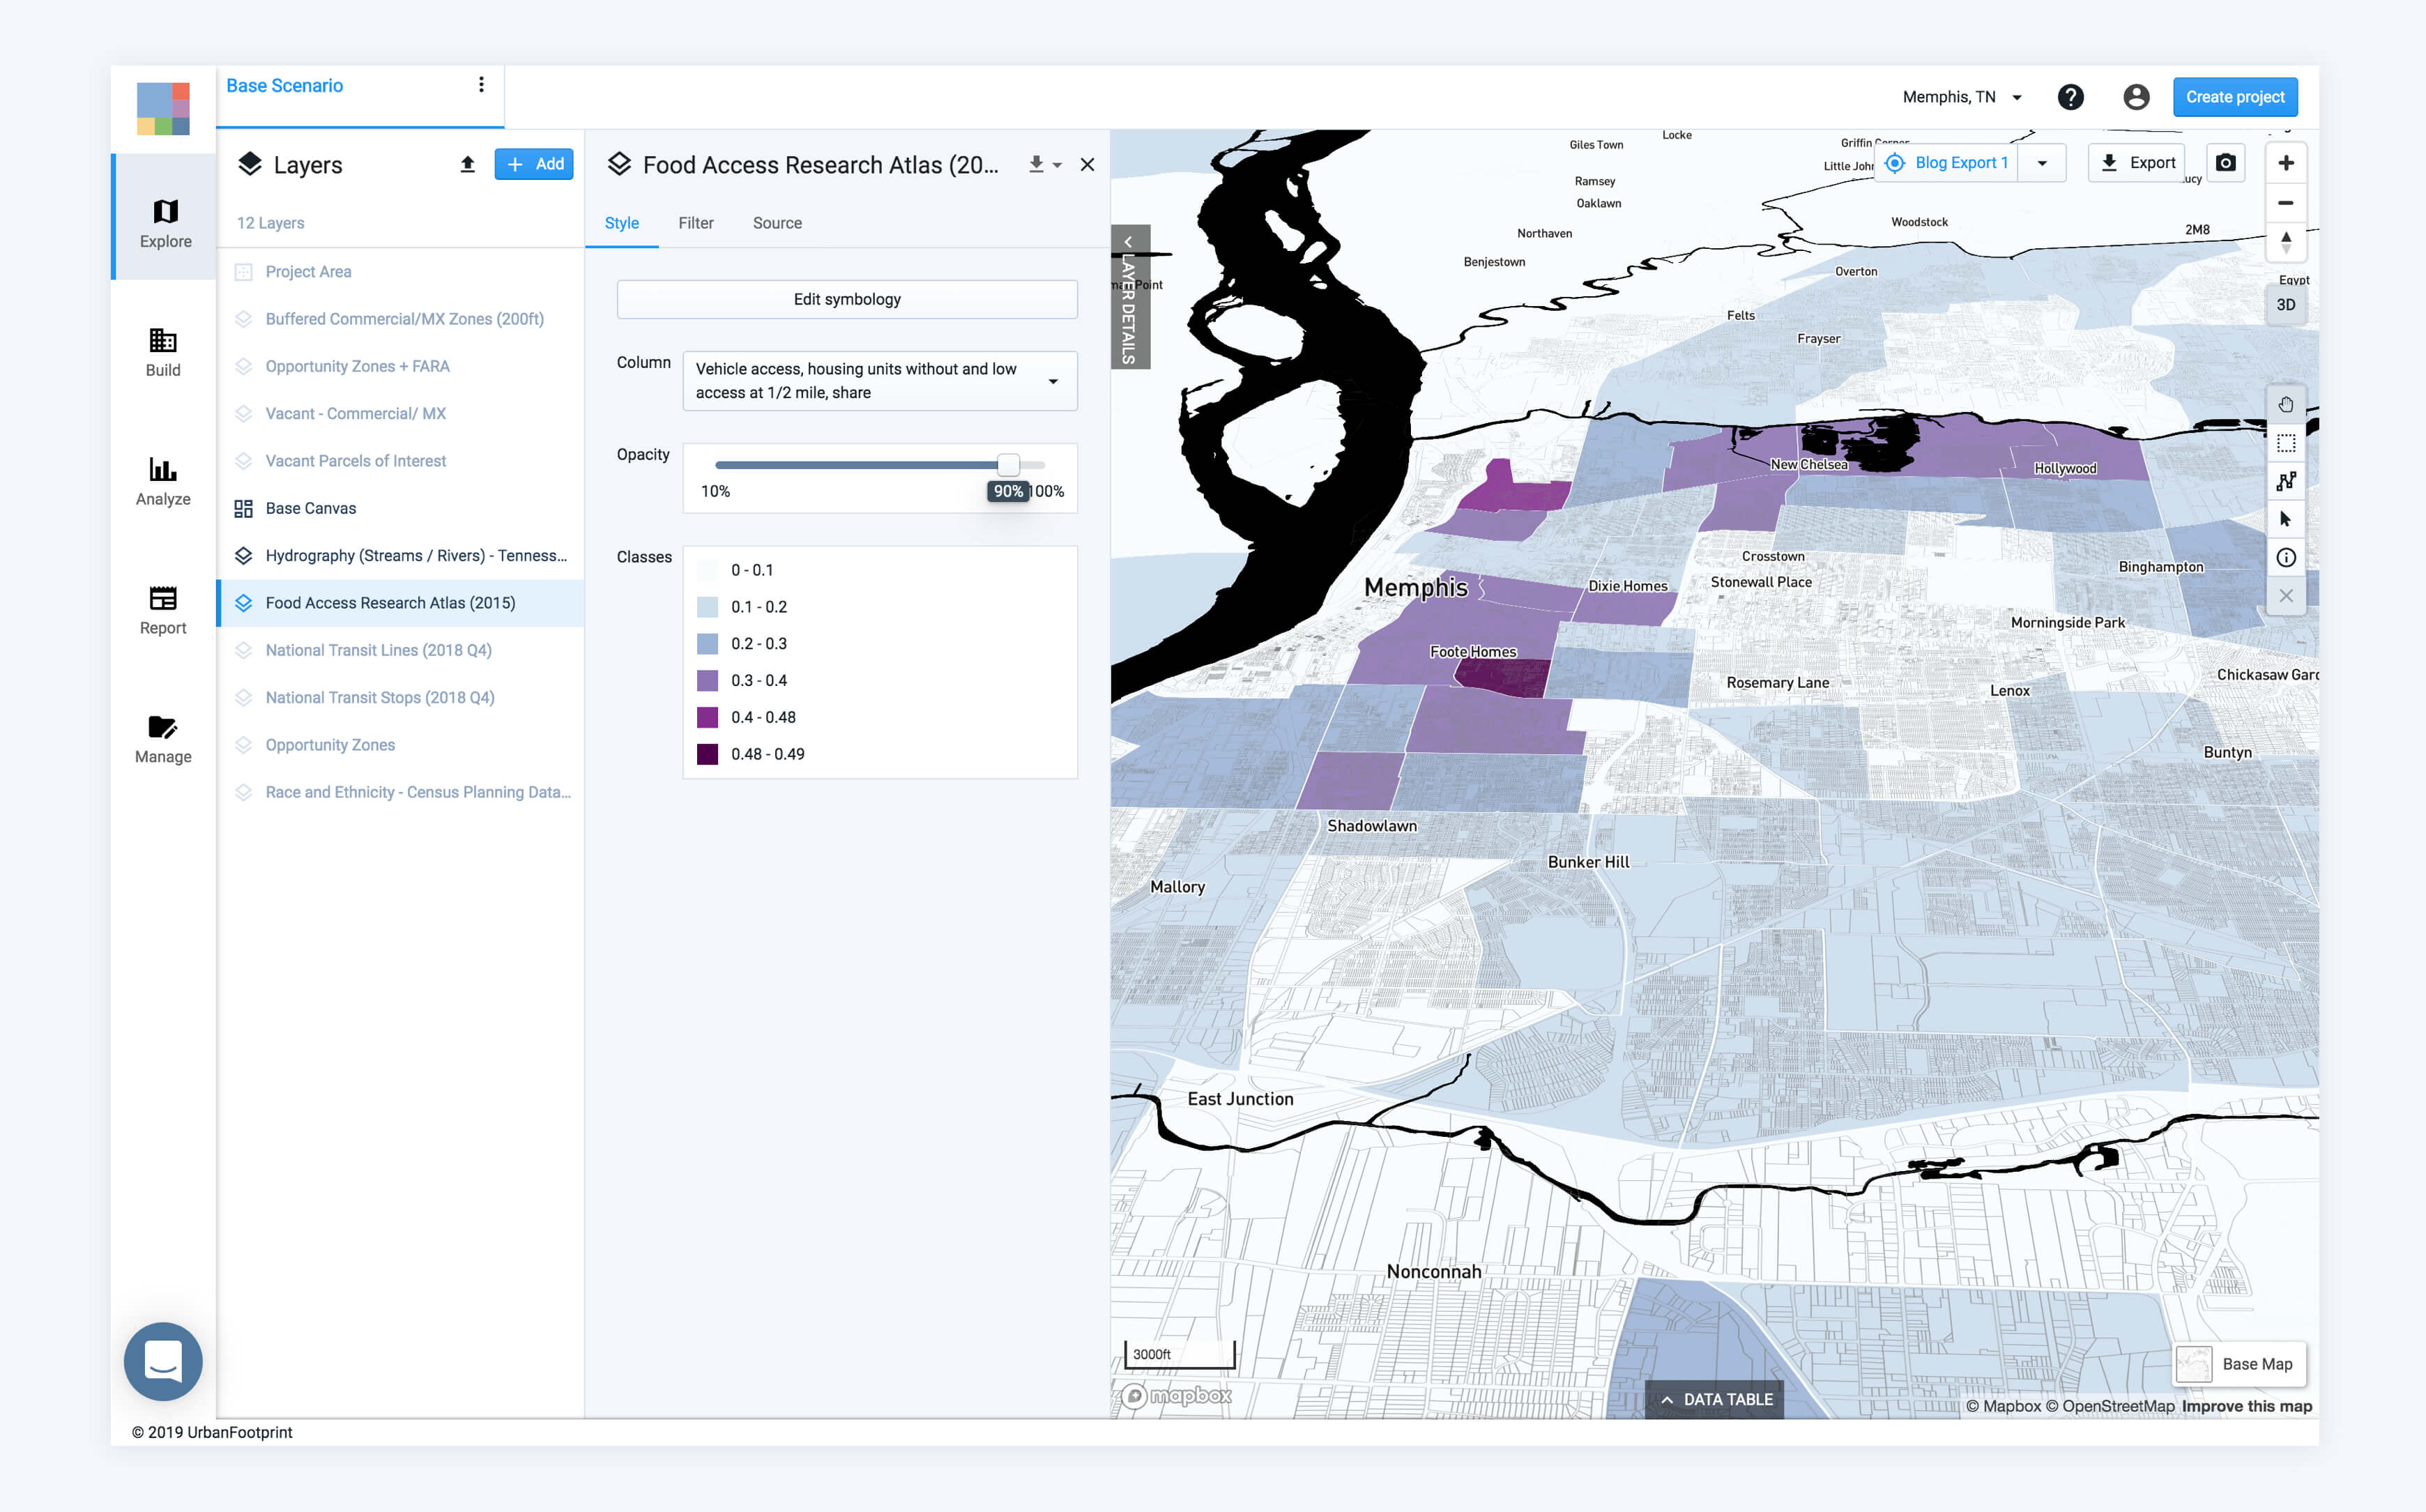
The dataset also permits us to look at how food access is potentially exacerbated by who has access to a vehicle or not.
Academics, planners, and community-led organizations talk about the factors that determine a neighborhood’s access to good, affordable food and their correlation with historic patterns of disinvestments in communities, especially low-income neighborhoods or communities of color. As the food access dataset is now easily accessible alongside UrbanFootprint’s vast library of additional datasets, it opens the door for multiple, intersectional questions such as:
- What is the role of transit in facilitating greater access to quality food for disadvantaged communities?
- In existing food deserts, what parcels could accommodate a new grocery store?
- Or even, how might a city redesign zoning policy so that having a vehicle is not a prerequisite to a healthy diet?
Food security and access to quality, affordable food is a resonant theme in working to build more equitable communities. We at UrbanFootprint want to make this data easily accessible and actionable as a key component of data-driven planning practices across government and private entities tackling the food crisis.
Interested in exploring food access data in your community or planning project?
We invite you to schedule a demo with our team. We’ll share how UrbanFootprint can quickly map existing food access conditions for any U.S. location.
Have a question? Let’s talk! Tweet us @UFplatform or send us a note.
