


If you’re interested in creating a project like this, let us know!
Planning for sustainable growth depends on building communities where both people and nature thrive. And yet without access to advanced mapping and analysis tools, it can be difficult for planners to visualize and quantify the potential environmental impacts and benefits of our land use choices. In this post, we’ll share how UrbanFootprint makes it easy to map important environmental datasets, like critical habitat areas, to better understand existing conditions, inform potential development constraints, and protect endangered or threatened species.
What are critical habitat areas?
The Endangered Species Act (ESA) of 1973 provides a conservation program for threatened or endangered plants and animals and the habitats in which they live.
Today, when a species is proposed for listing as endangered or threatened under the ESA, the U.S. Fish and Wildlife Service (USFWS) must consider whether there are habitat areas believed to be essential to the species’ conservation. Those areas may be designated as “critical habitats” – specific geographic areas necessary for the conservation of the species and may require special management and protection. Critical habitat areas may also include areas that are not currently occupied by the species but will be needed for its recovery.
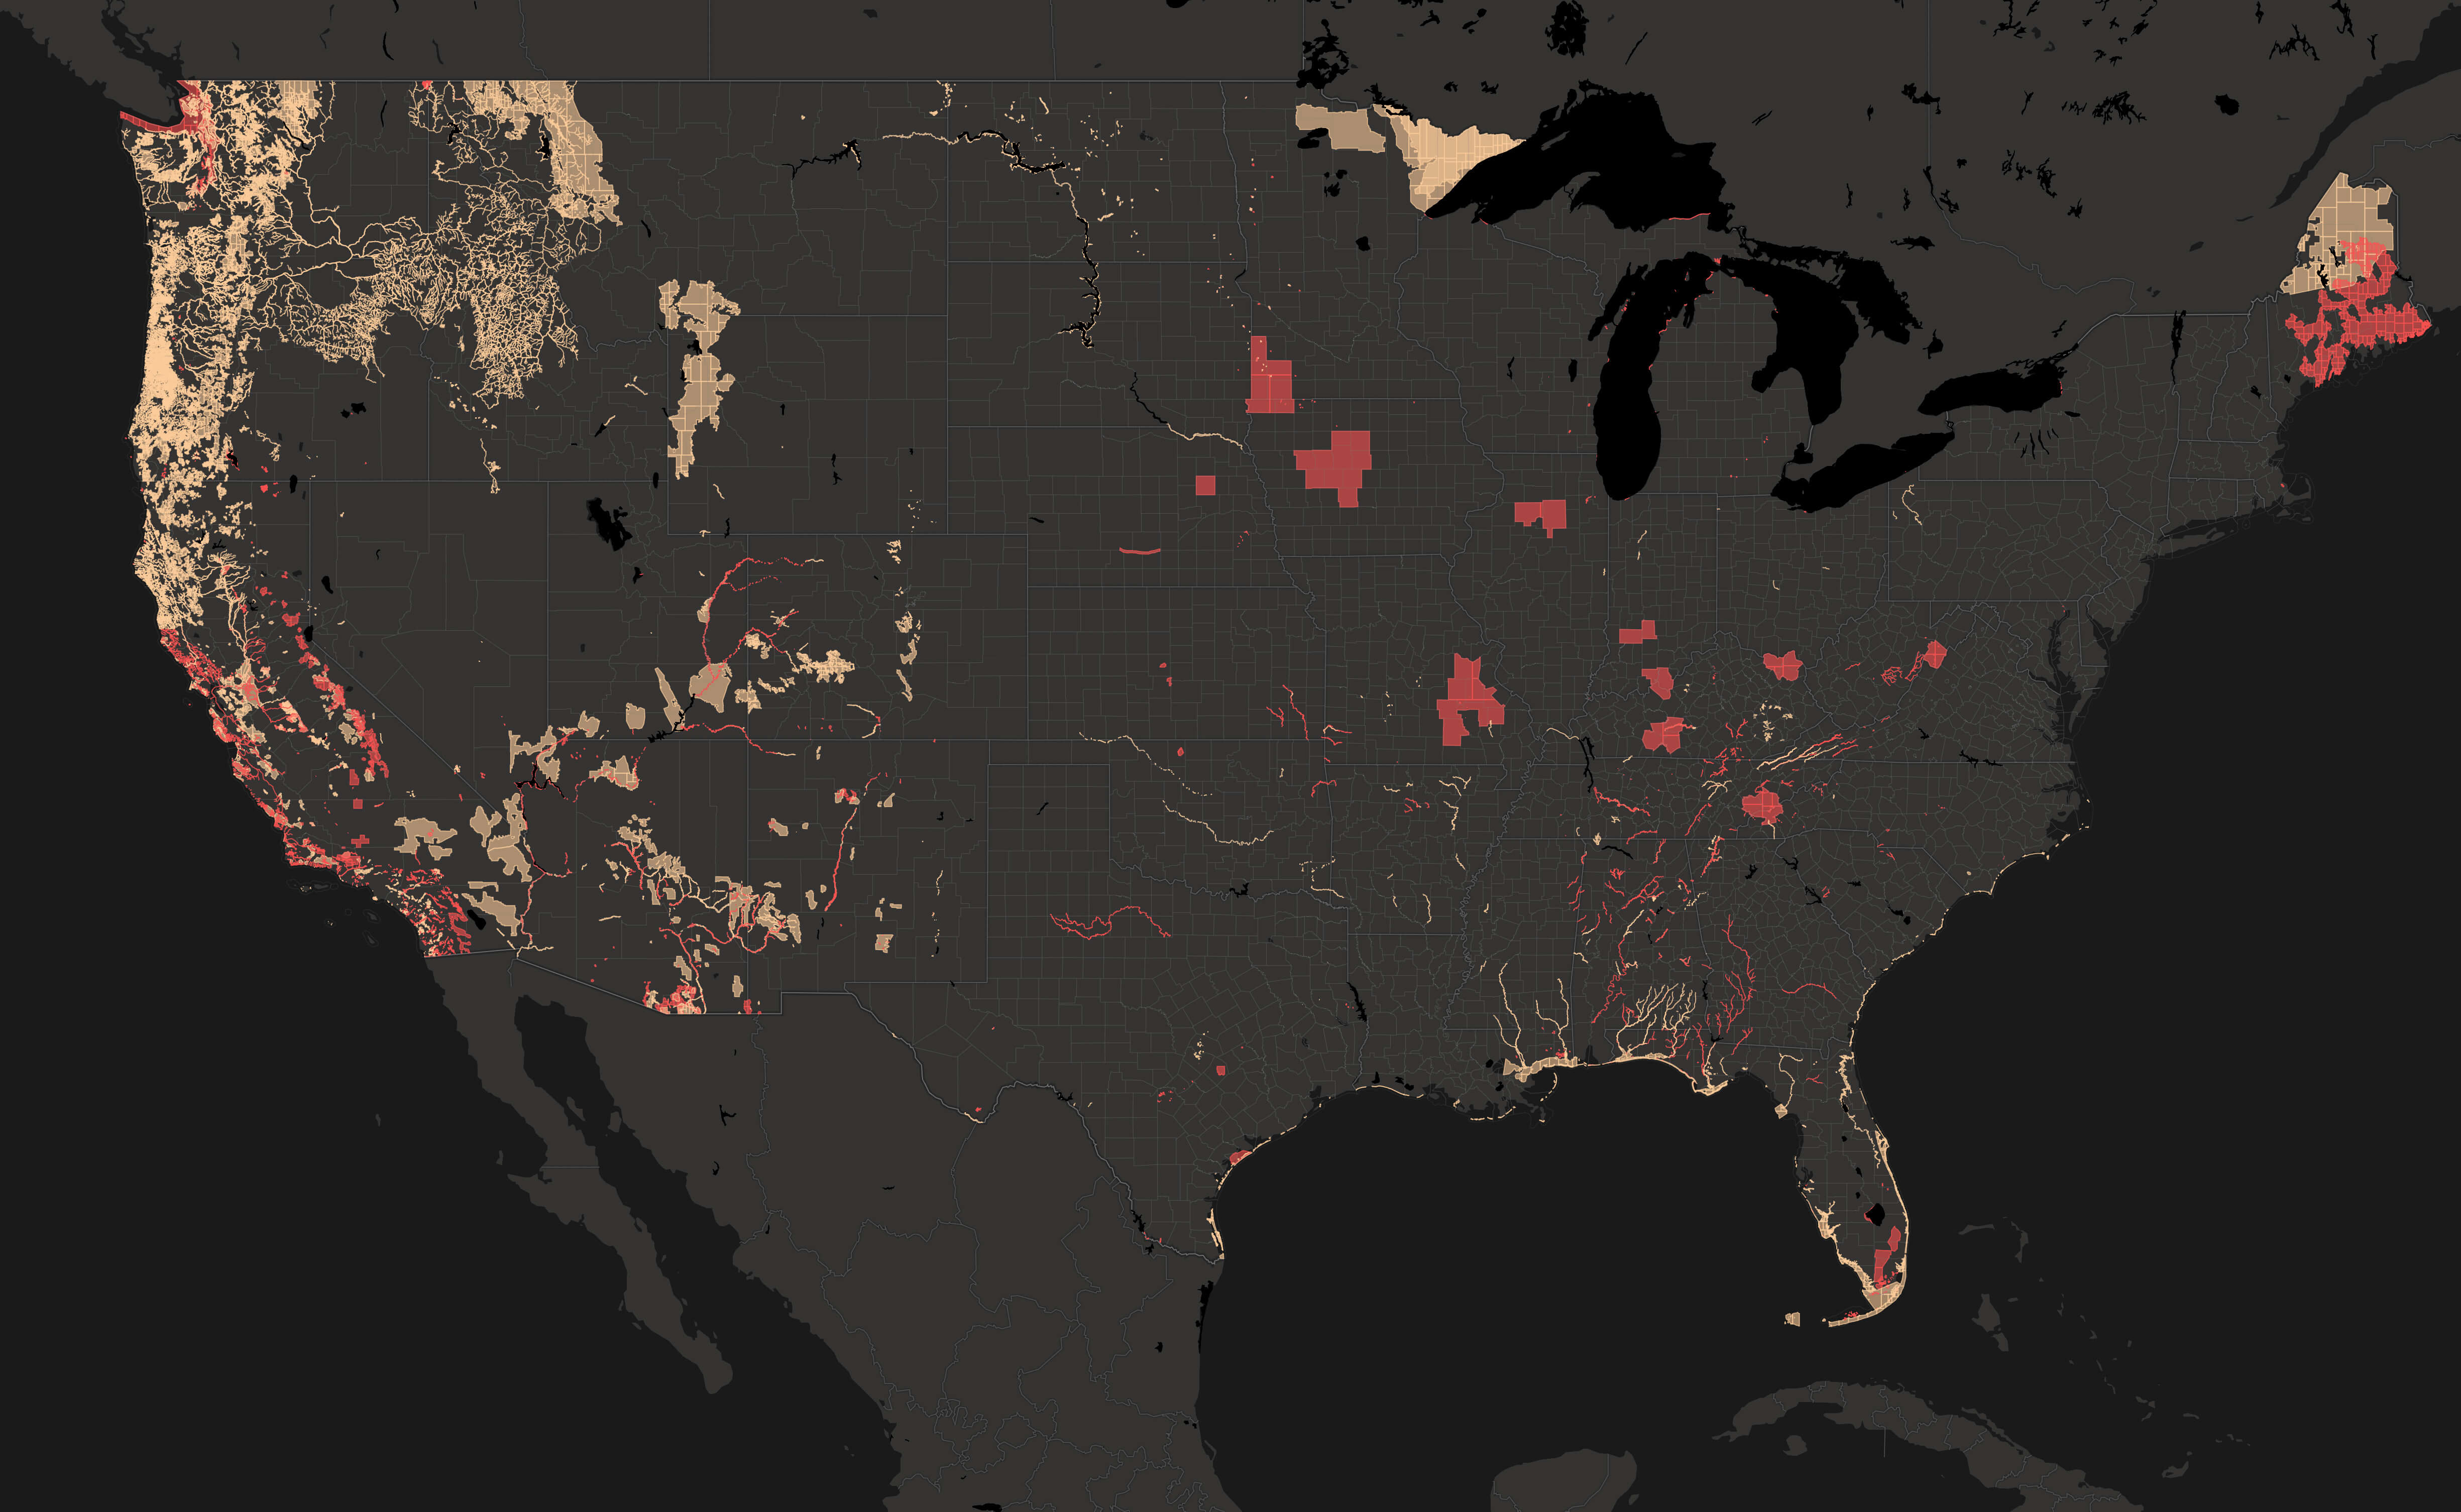
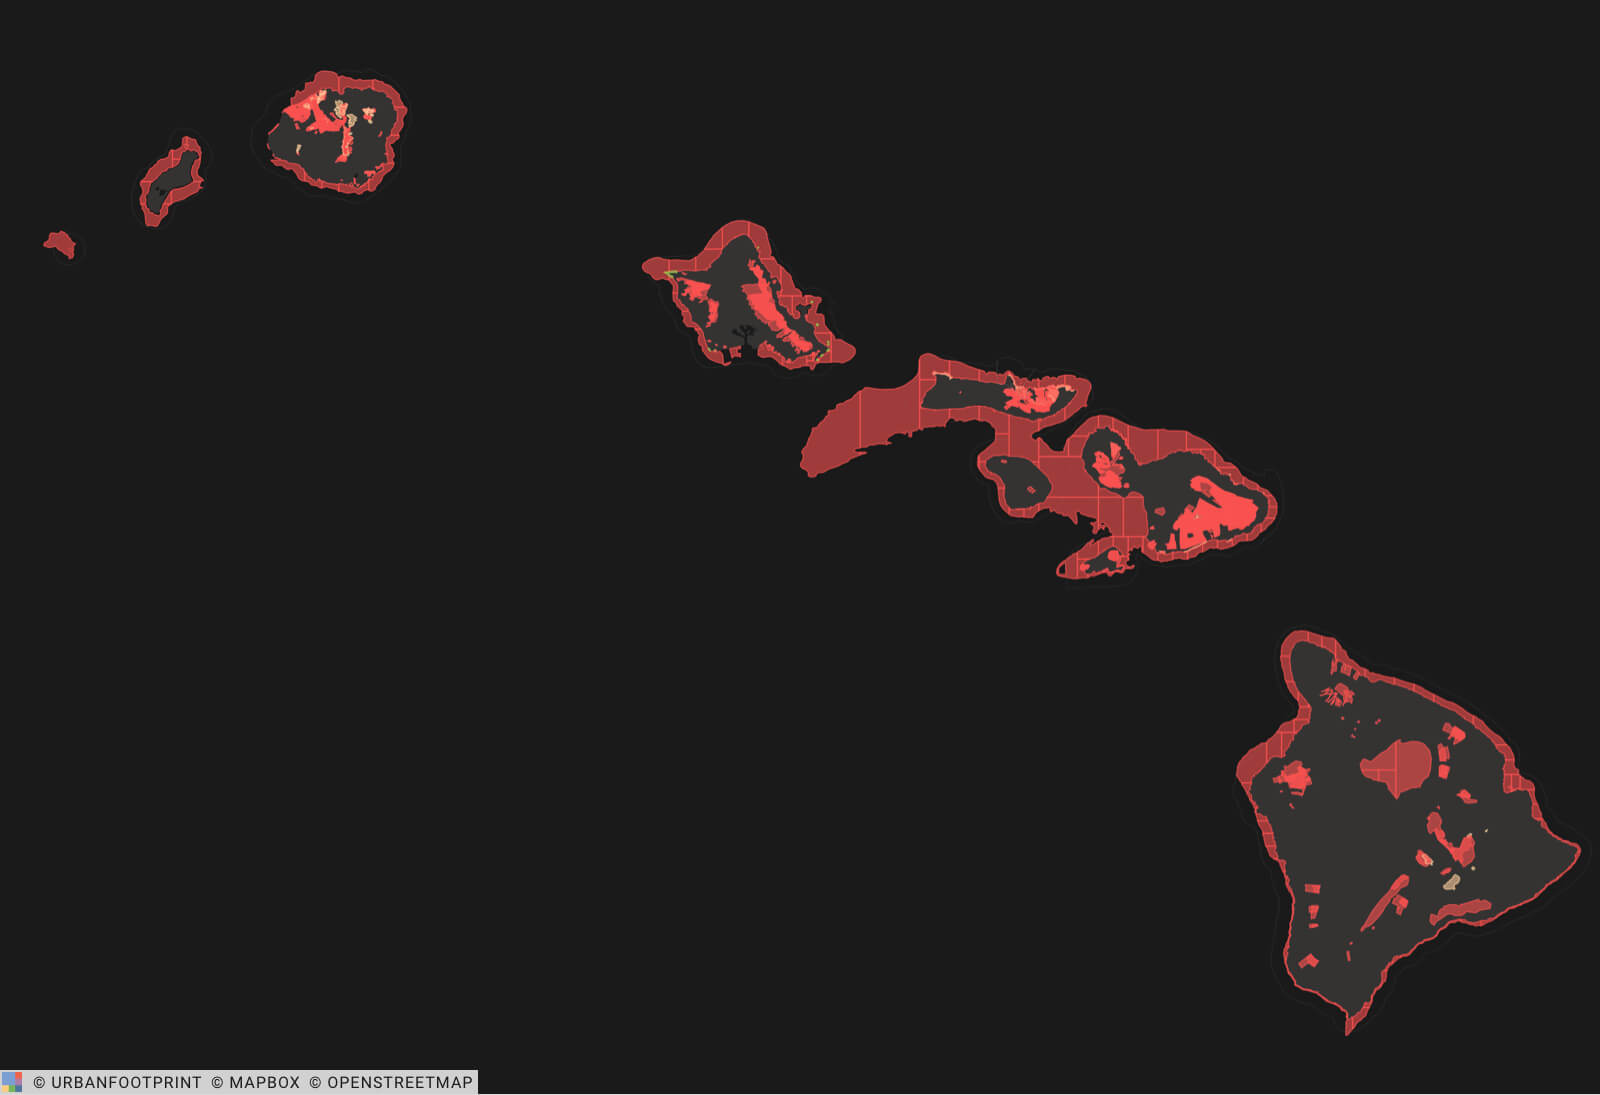
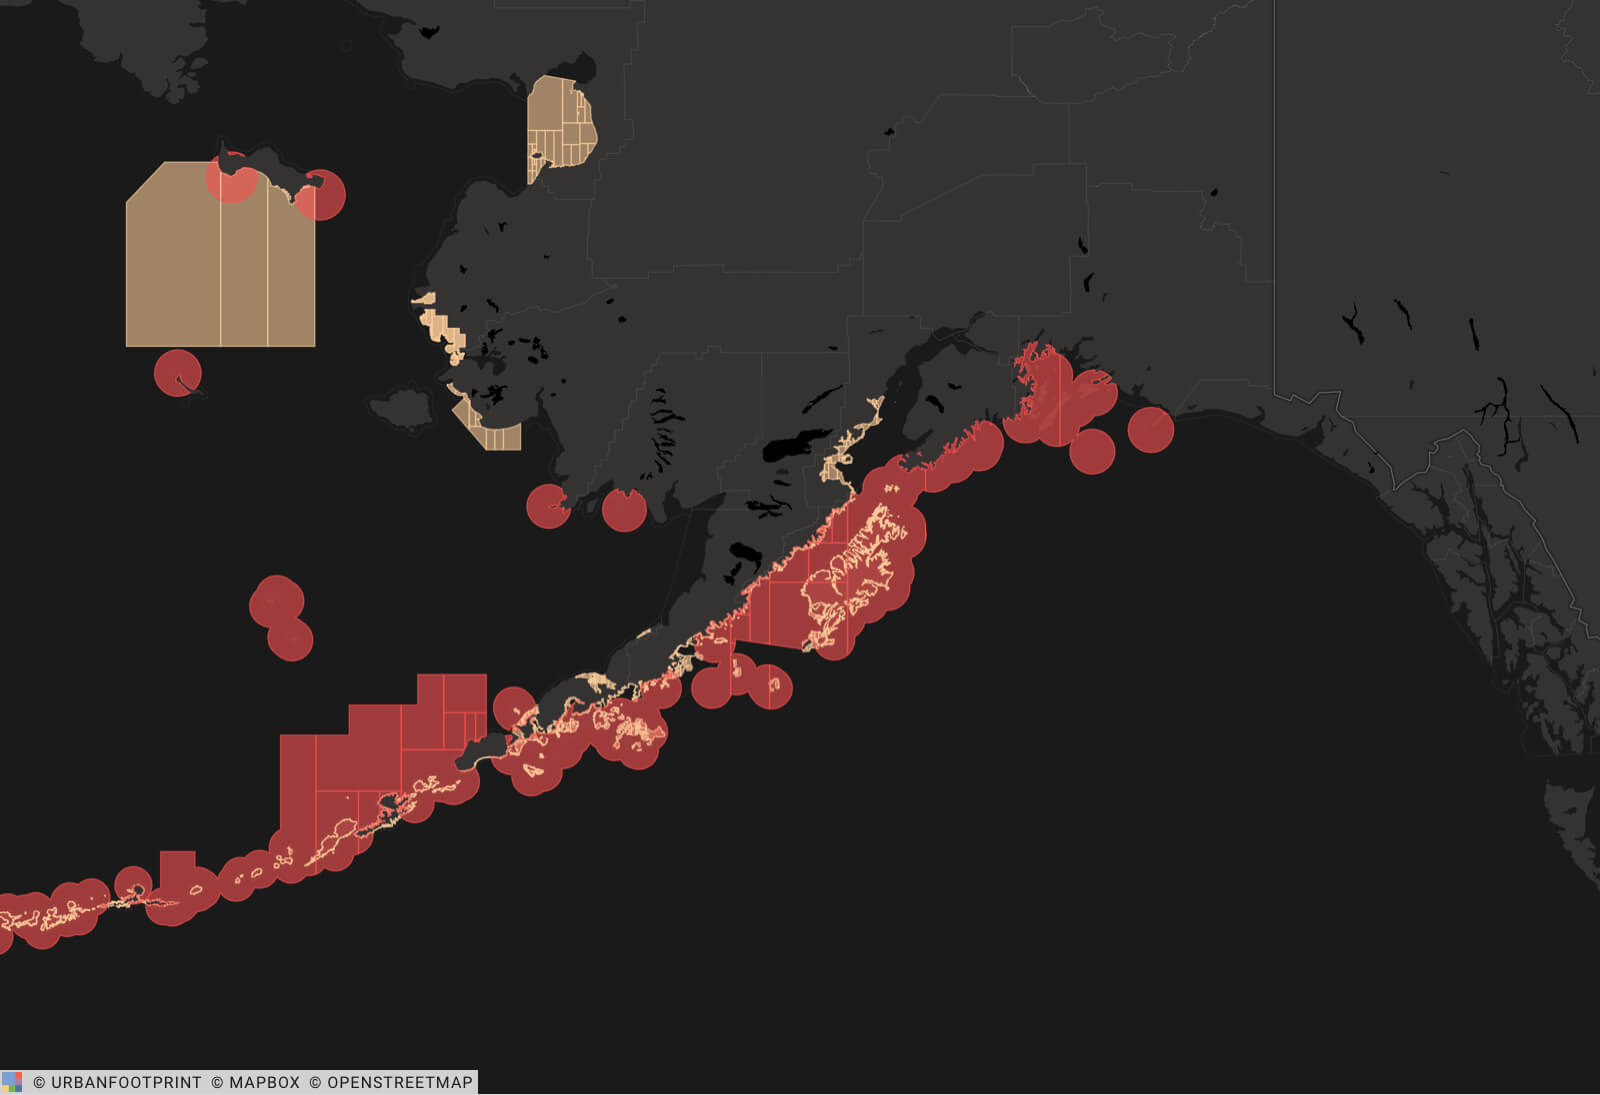
USFWS maintains an online data repository of critical habitat areas nationwide on their Environmental Conservation Online System that comes preloaded in UrbanFootprint, alongside thousands of additional, ready-to-map datasets.
Quickly locate existing critical habitat areas
There are two kinds of nationwide datasets maintained by USFWS – lines and polygons. Lines typically represent paths (streams, rivers, etc.) species use as part of their habitat or movement patterns. In contrast, the polygons represent larger critical habitat areas.
UrbanFootprint’s data pipeline makes this data easy to analyze by adding the length of lines in kilometers and the area of the polygons in square kilometers to provide users with quick access to coverage stats when viewing this layer in their project.

Quantify the reach of critical habitat areas in your city
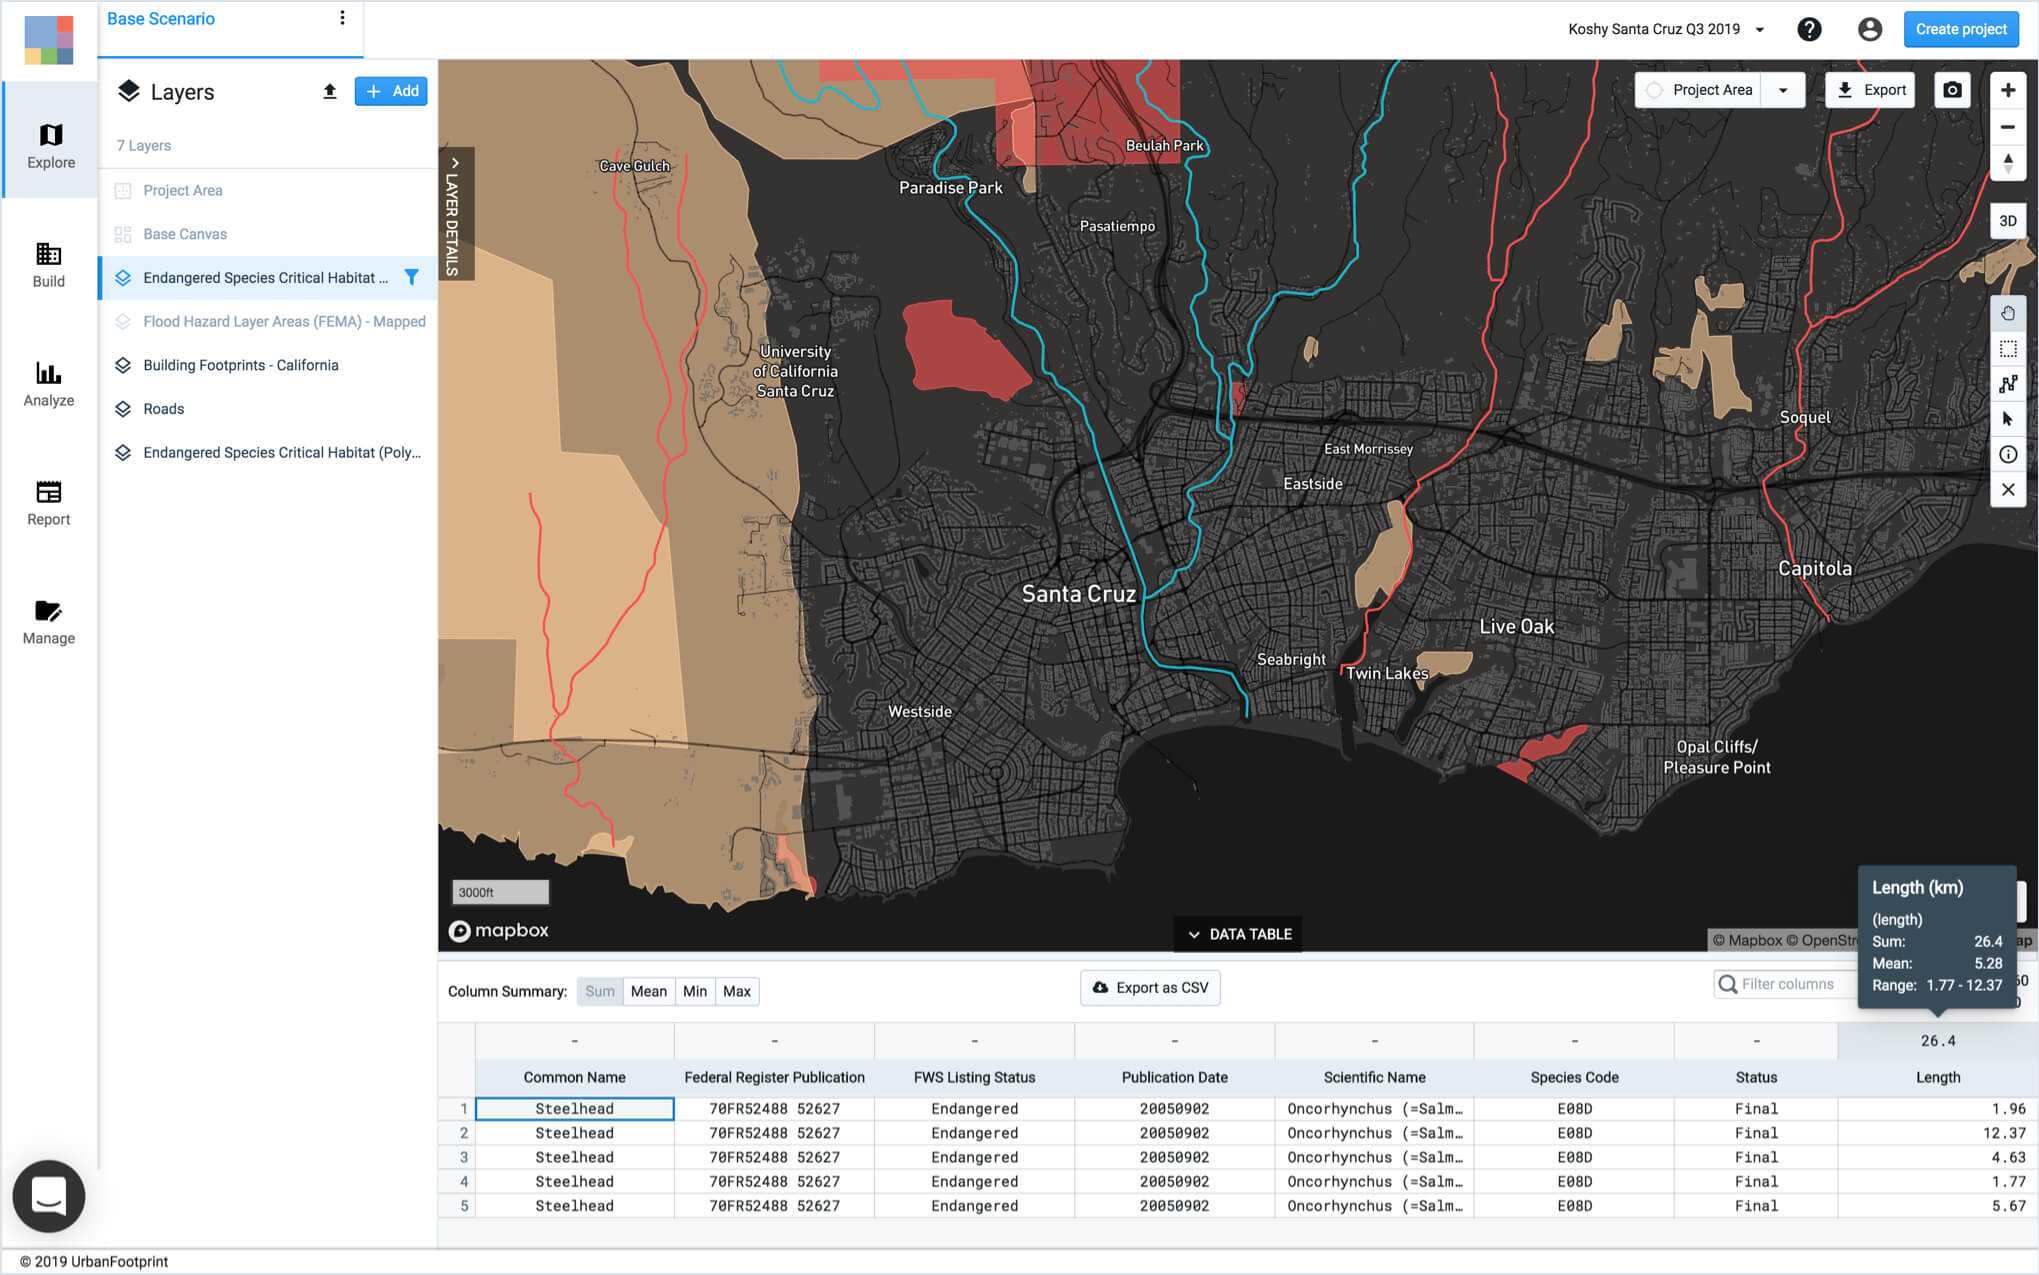
Now, let’s take a look at the Critical Habitat layer in action and create an example UrbanFootprint project in Santa Cruz, California. First, UrbanFootprint creates an out-of-the-box, base canvas (existing land use map) for the project area.
Using the layer manager, we add both the line and polygon layers for the Critical Habitat dataset. To better understand how these critical habitat areas may relate to our project area, we can quickly join these layers to the project boundary to filter for polygons and lines that directly intersect with the City of Santa Cruz.
With the UrbanFootprint data table, users can quickly summarize the coverage stats of lines and polygons in the project. In this example, there are 34 kilometers of lines and about one square kilometer of critical habitat polygons for threatened and endangered species in the vicinity of Santa Cruz.
We can also get details on which species these critical habitat areas support. For example, on the western edge of Santa Cruz, there is a large polygon for the California Red-Legged Frog covering over 200 square kilometers. Some of the other species include the:
- Marbled Murrelet
- Tidewater Goby
- Western Snowy Plover
- Robust Spineflower
- Santa Cruz Tarplant
- Steelhead
Plan scenarios to support sustainable growth and protect sensitive ecosystems
UrbanFootprint also allows users to analyze development alternatives to understand how future development choices may impact or protect the conservation of critical habitats. As we model new land use scenarios in UrbanFootprint’s Build Mode, we can quickly look at the Critical Habitat lines or polygons to make informed choices about where new development should go, or see if any planned new development lies in any of these critical habitat areas. You wouldn’t want these critters to show up at your city council meetings with NIMCHA signs!
Interested in mapping critical habitat areas near your community or project?
Book a demo and learn how to quickly map critical habitats and analyze existing conditions for any U.S. location.
