


If you’re interested in creating a project like this, let us know!
A recently announced California senate bill, SB 827, proposes a dramatic shift in zoning policy throughout California. Largely spurred by the state’s severe housing shortage, this bill has generated controversy from all sides of the housing debate in its aim to substantially upzone residential parcels within a half mile of major transit stops statewide. A common thread throughout such debates has been the question of how this would alter existing conditions throughout urban areas in California. Data-driven scenario planning is ideal for understanding such impacts and can be used to inform communities and inform policy makers with better data as they craft and refine legislation. In this post, we demonstrate how we used UrbanFootprint to quickly analyze how the bill could impact housing capacity at sites in the San Francisco Bay Area.
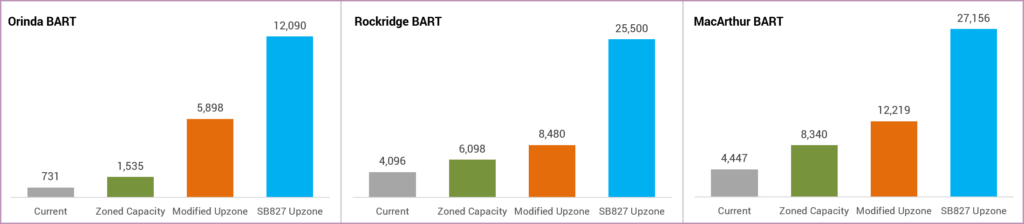
To examine the bill’s potential impact, we selected three BART rail stations in the East Bay of the San Francisco Bay Area: MacArthur, Rockridge, and Orinda. MacArthur and Rockridge are more urban stations while Orinda is more suburban, auto-oriented, and surrounded by single family housing.
SB 827 focuses intervention within quarter and half mile buffers of high quality transit service such as BART rail. As currently drafted (March 1, 2018 Senate Update), it calls for upzoning these areas based on the following parameters:
Along streets greater than 70 feet wide:
- Residential parcels within a quarter mile of BART station up-zoned to 85 feet (~8 stories)
- Residential parcels within a half mile of BART station up-zoned to 55 feet (~5 stories)
Along streets narrower than 70 feet wide:
- Residential parcels within a quarter mile of BART station up-zoned to 55 feet (~5 stories).
- Residential parcels within a half mile of BART station up-zoned to 45 feet (~4 stories).
We used UrbanFootprint to assess existing conditions and built the following three scenarios for each station area:
- Zoned Capacity: The maximum capacity based on current zoning.
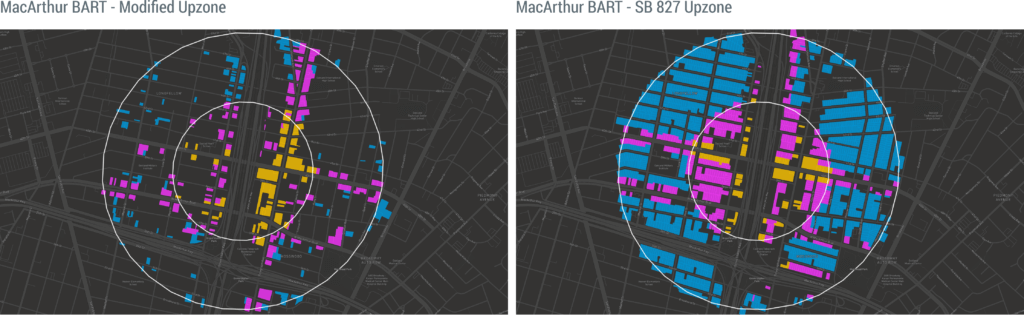
- SB 827 Upzone: A capacity projection based on the current draft of SB 827, which allows for intensifying residential development on parcels that currently allow residential development.
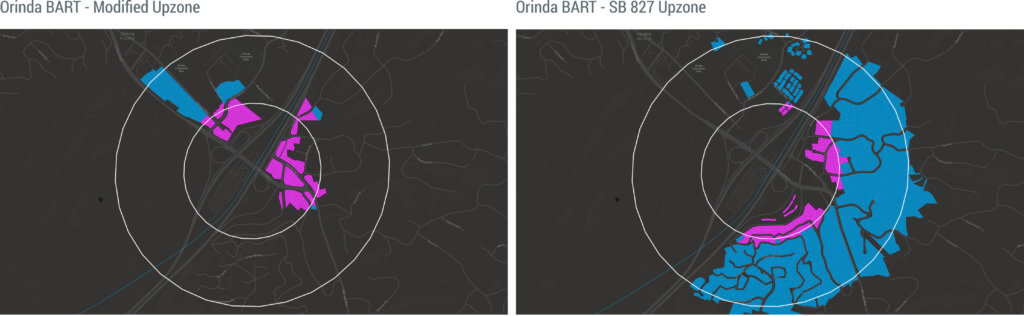
- Modified Upzone: This scenario takes single-family homes and townhomes off the table and instead places additional mixed-use development on existing commercial/mixed-use corridors.
It’s interesting to see how housing capacity changes with these different scenarios. While more detailed studies at each of these sites would be needed to support real changes to zoning, two conclusions can initially be observed. First, more capacity is available currently that is not being captured. Second, there are a number of ways to achieve greater levels of housing production, especially around major and costly infrastructure such as BART rail. Here is a quick summary of the aforementioned scenario stats.
How Did We Build the Scenarios?
First, we selected the three stations and created half-mile buffers for our study area projects.
Each project was provisioned with UrbanFootprint’s built-in parcel data of existing conditions, and loaded with transit and zoning data for each site.
With base data loaded, we could immediately evaluate existing conditions. For our first scenario, Zoned Capacity, we identified what each transit site’s housing capacity is under current zoning.
Using our zoning data and UrbanFootprint’s filtering tools, we selected parcels whose dwelling unit count was less than what current zoning allows for and “painted” our new scenario to achieve maximum build-out under current zoning.
Next we built the SB827 Upzone scenario to find out what the bill would change in the study areas. We needed to be sure we were upzoning with the types of buildings and densities laid out by SB827. For this, we used UrbanFootprint’s built-in library of buildings to identify regional construction typologies. From these prototypes, we were able to create a representative blend for each of the 85-foot, 55-foot, and 45-foot heights stated by the bill.
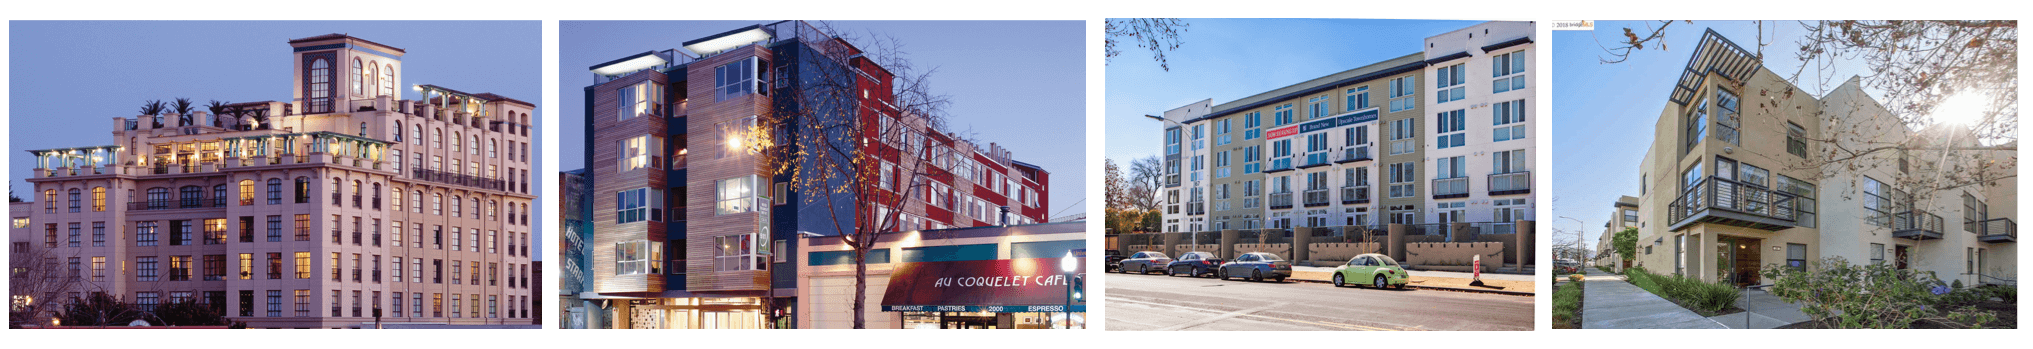
Just as we did with the zoning data, we created a new scenario and selected all residentially zoned parcels within a quarter and half mile of BART. We “repainted” them accordingly, each receiving the density and utilization characteristics similar to that of our example building types. This produced a substantial increase in housing capacity for each study area, well beyond existing conditions or the Zoned Capacity scenario.
Next, we tested an alternative solution that preserves existing single family and townhome units. This scenario focused on more ‘surgical’ infill along existing commercial corridors. We adjusted our building types to allow for the preservation of ground floor retail and added mixed-use housing above these already active commercial and multi-family parcels. We deployed a quick filter to choose parcels and then ‘painted’ them with moderate and higher density residential and mixed use building types along these commercial corridors.
With UrbanFootprint’s tracking and reporting charts, we could easily monitor our scenario statistics and remotely collaborate on generating comparison exhibits.
These features allowed us to iteratively test additional scenarios and quickly understand how new land use modifications may impact population, housing units, and dwelling unit composition.
As the SB827 debate continues to unfold, we hope this analysis will inspire others to explore how UrbanFootprint could help them in engaging in informed, data-driven land use and planning discussions. We’ll continue to track the bill and make updates to the scenarios to reflect substantial changes. We’ll post changes here on our blog.
Want to learn more about UrbanFootprint? Watch our 6-minute demo video for a quick overview of the platform.
